AI Topic Competitiveness Heatmap
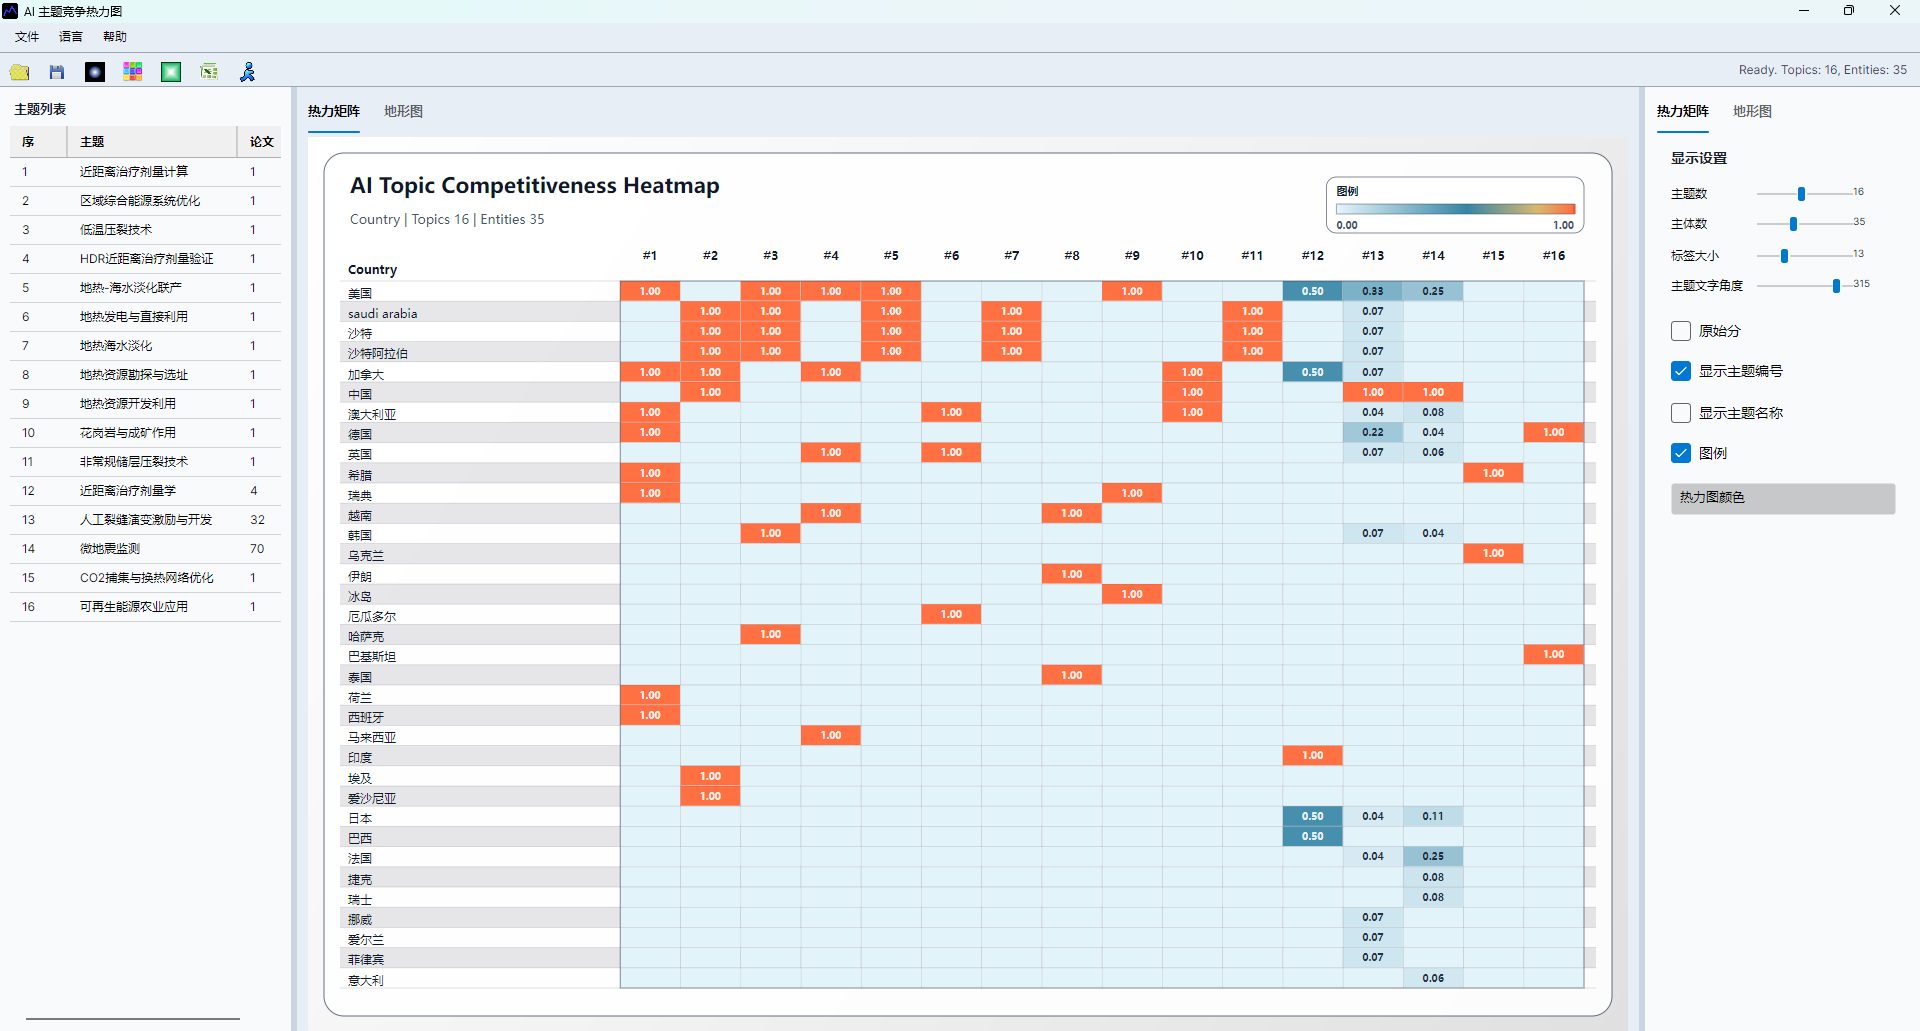
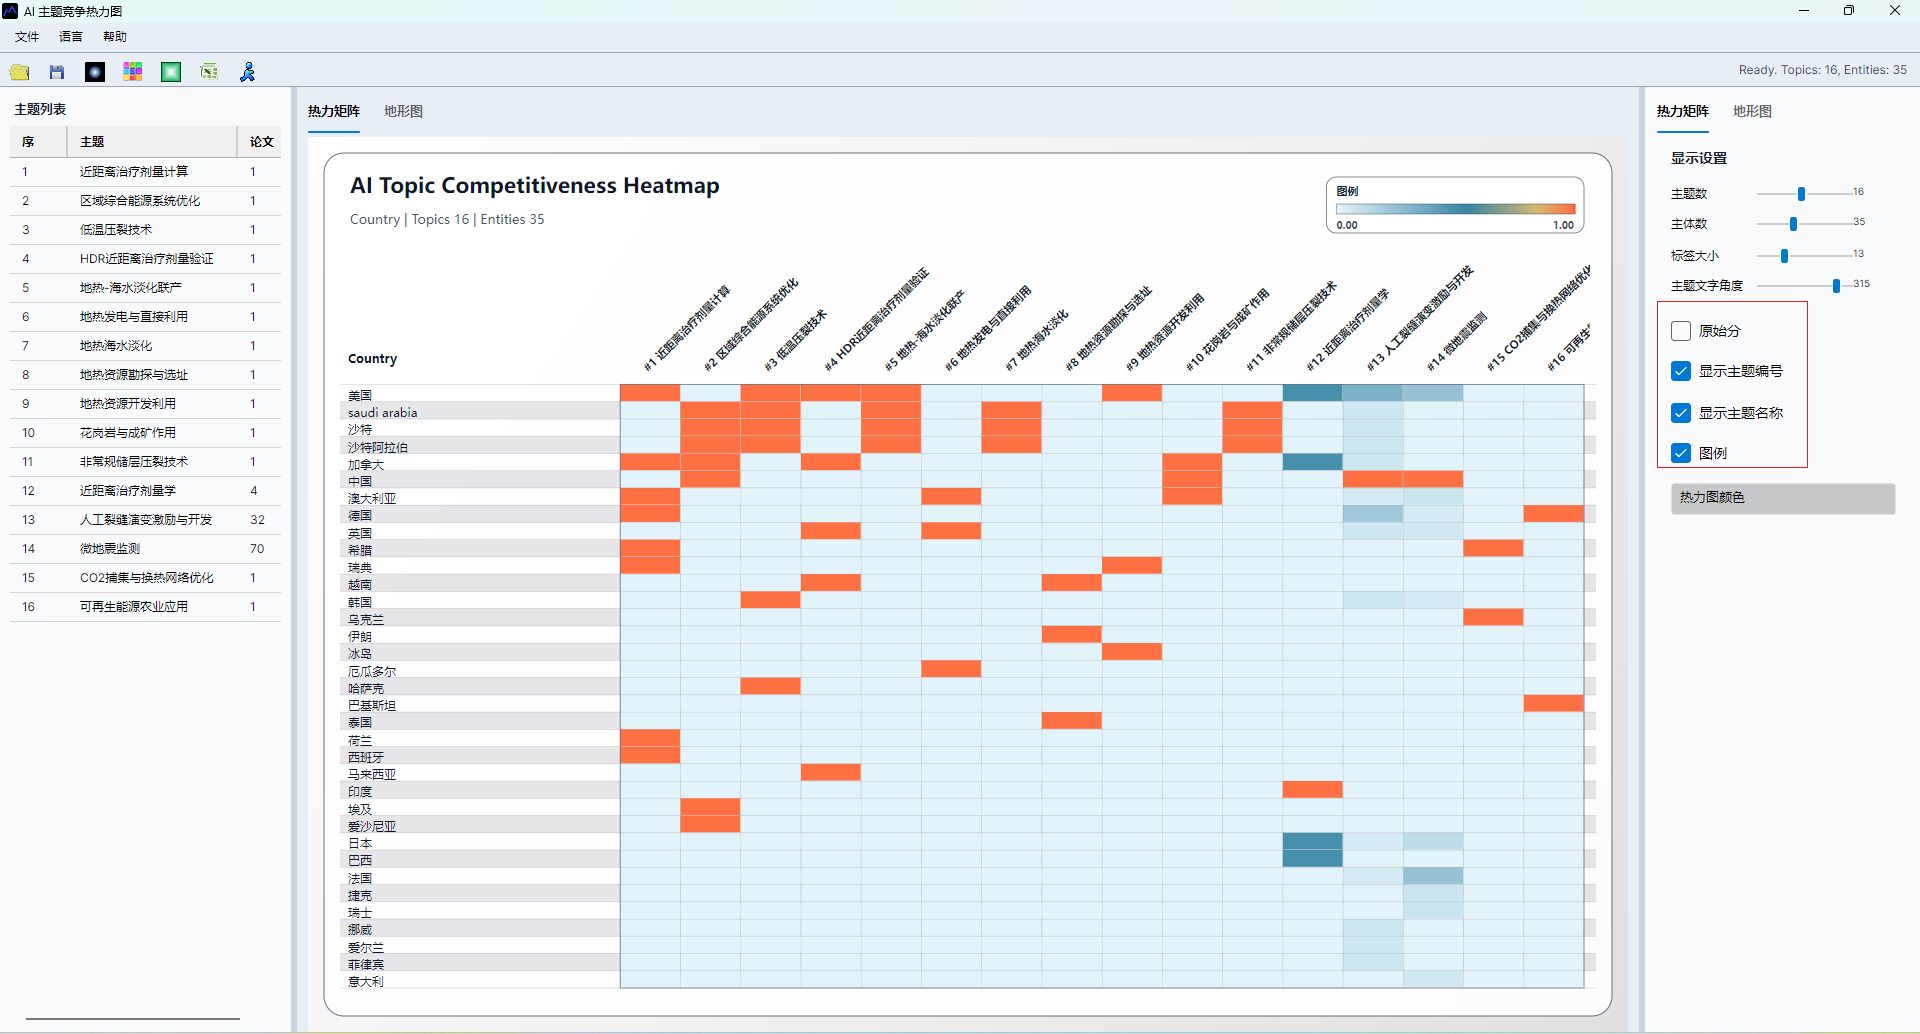
The AI topic competitiveness heatmap converts subject-topic relationships into a matrix. Rows usually represent topics, columns represent subjects, and color intensity represents the relative competitive strength or activity level.
Recommended Data Preparation
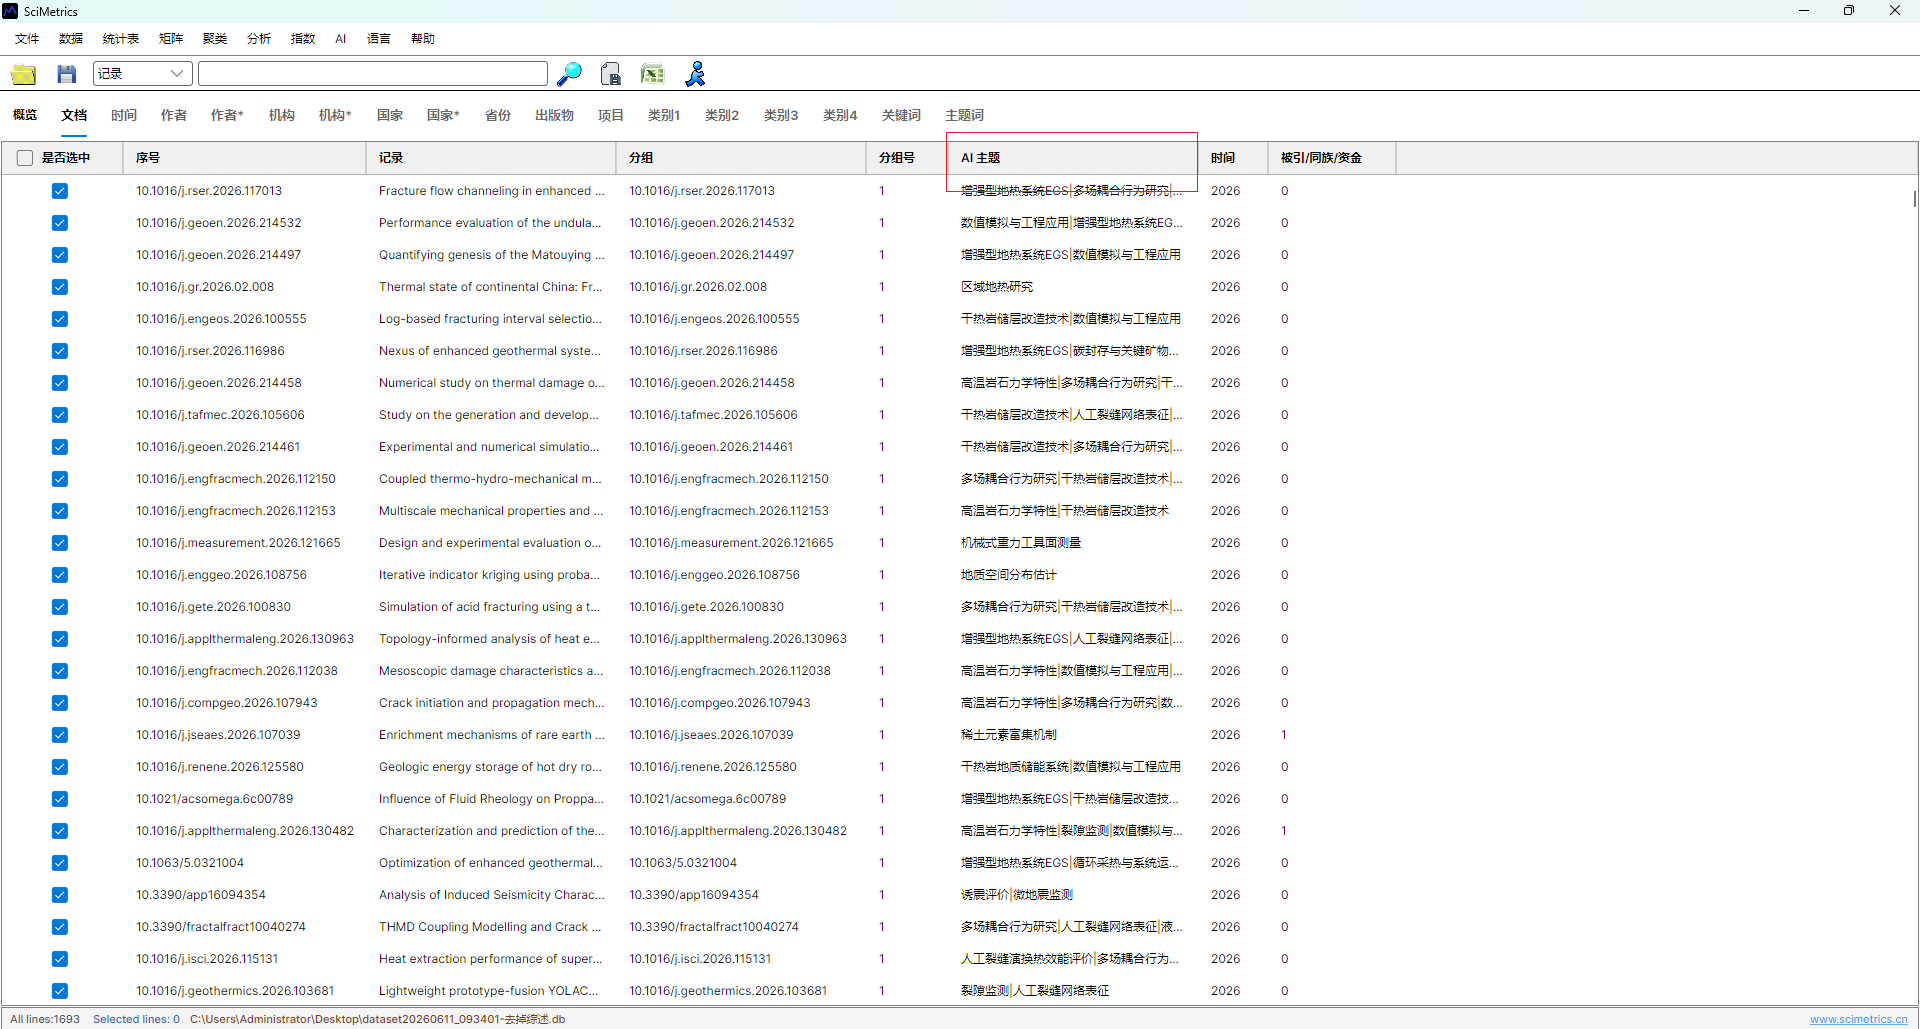
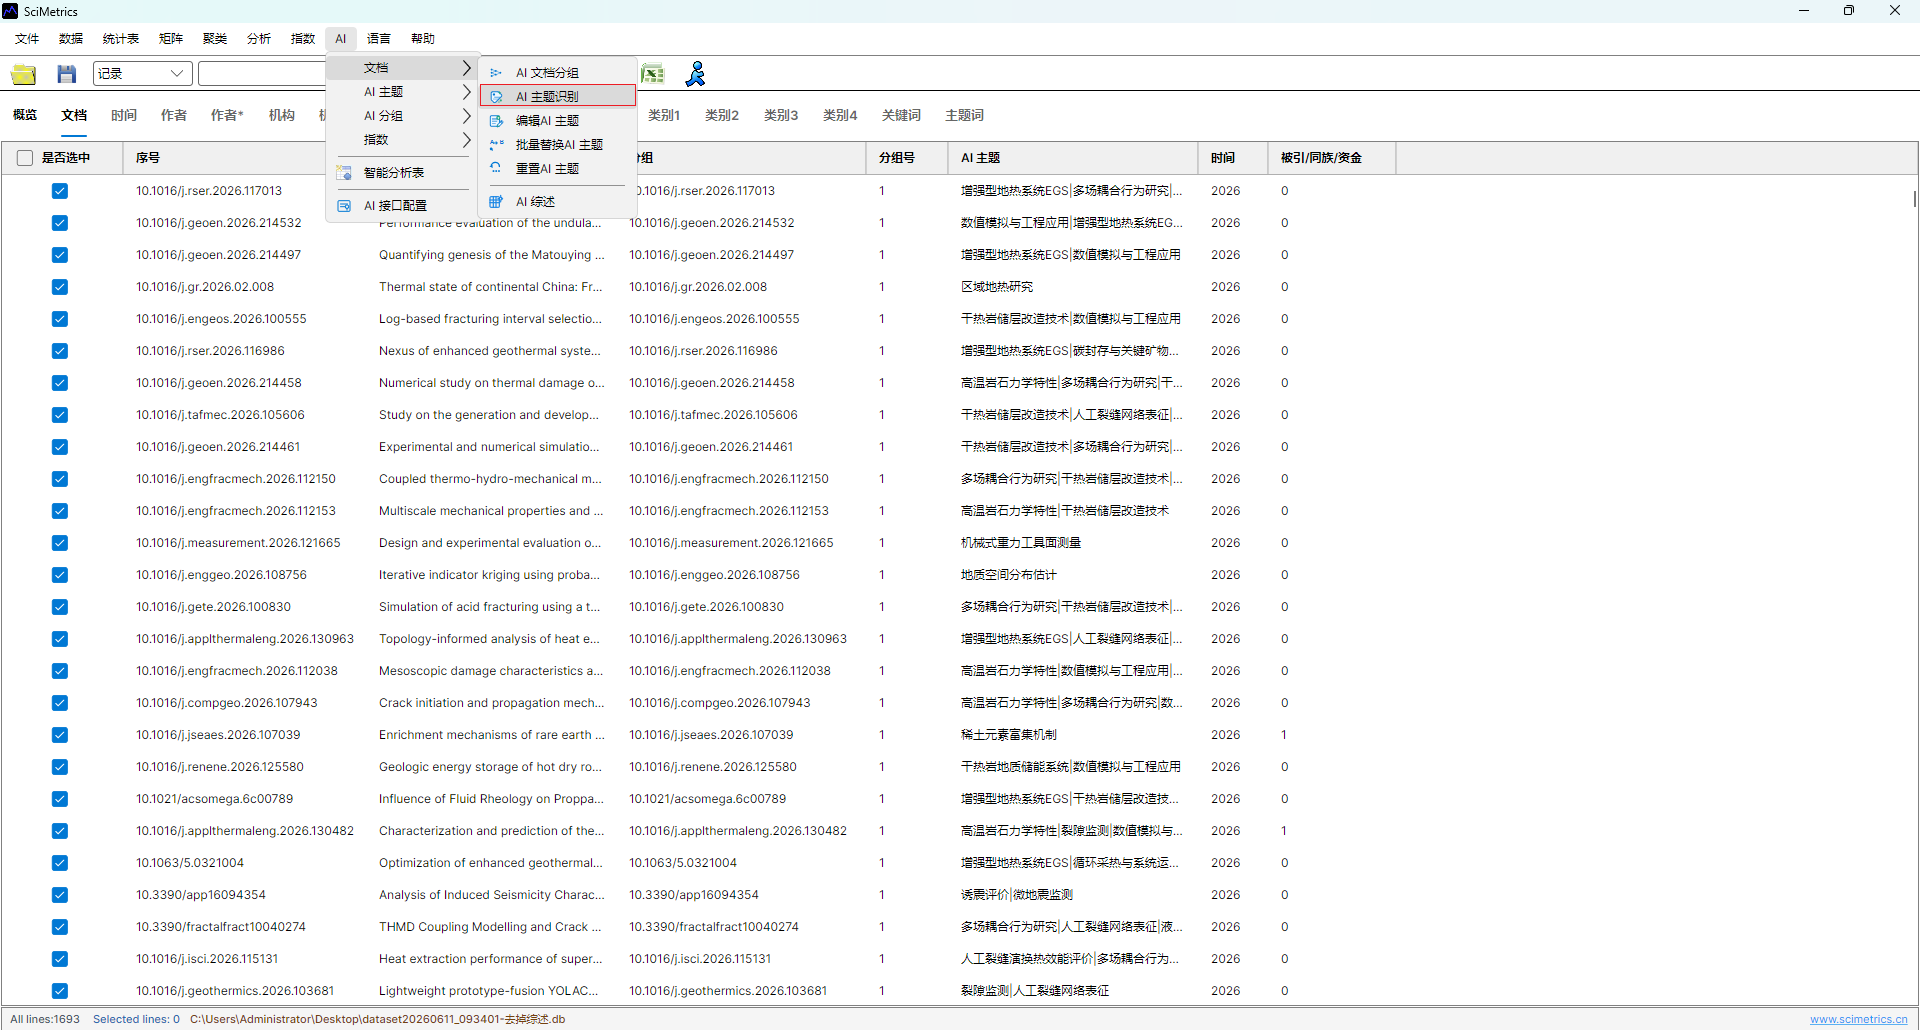
- Complete AI topic identification.
- Merge institution, author, or other subject names before comparison.
- Remove obvious noise and duplicate aliases.
- Decide the subject dimension and topic range before generating the matrix.
Generate The Heatmap
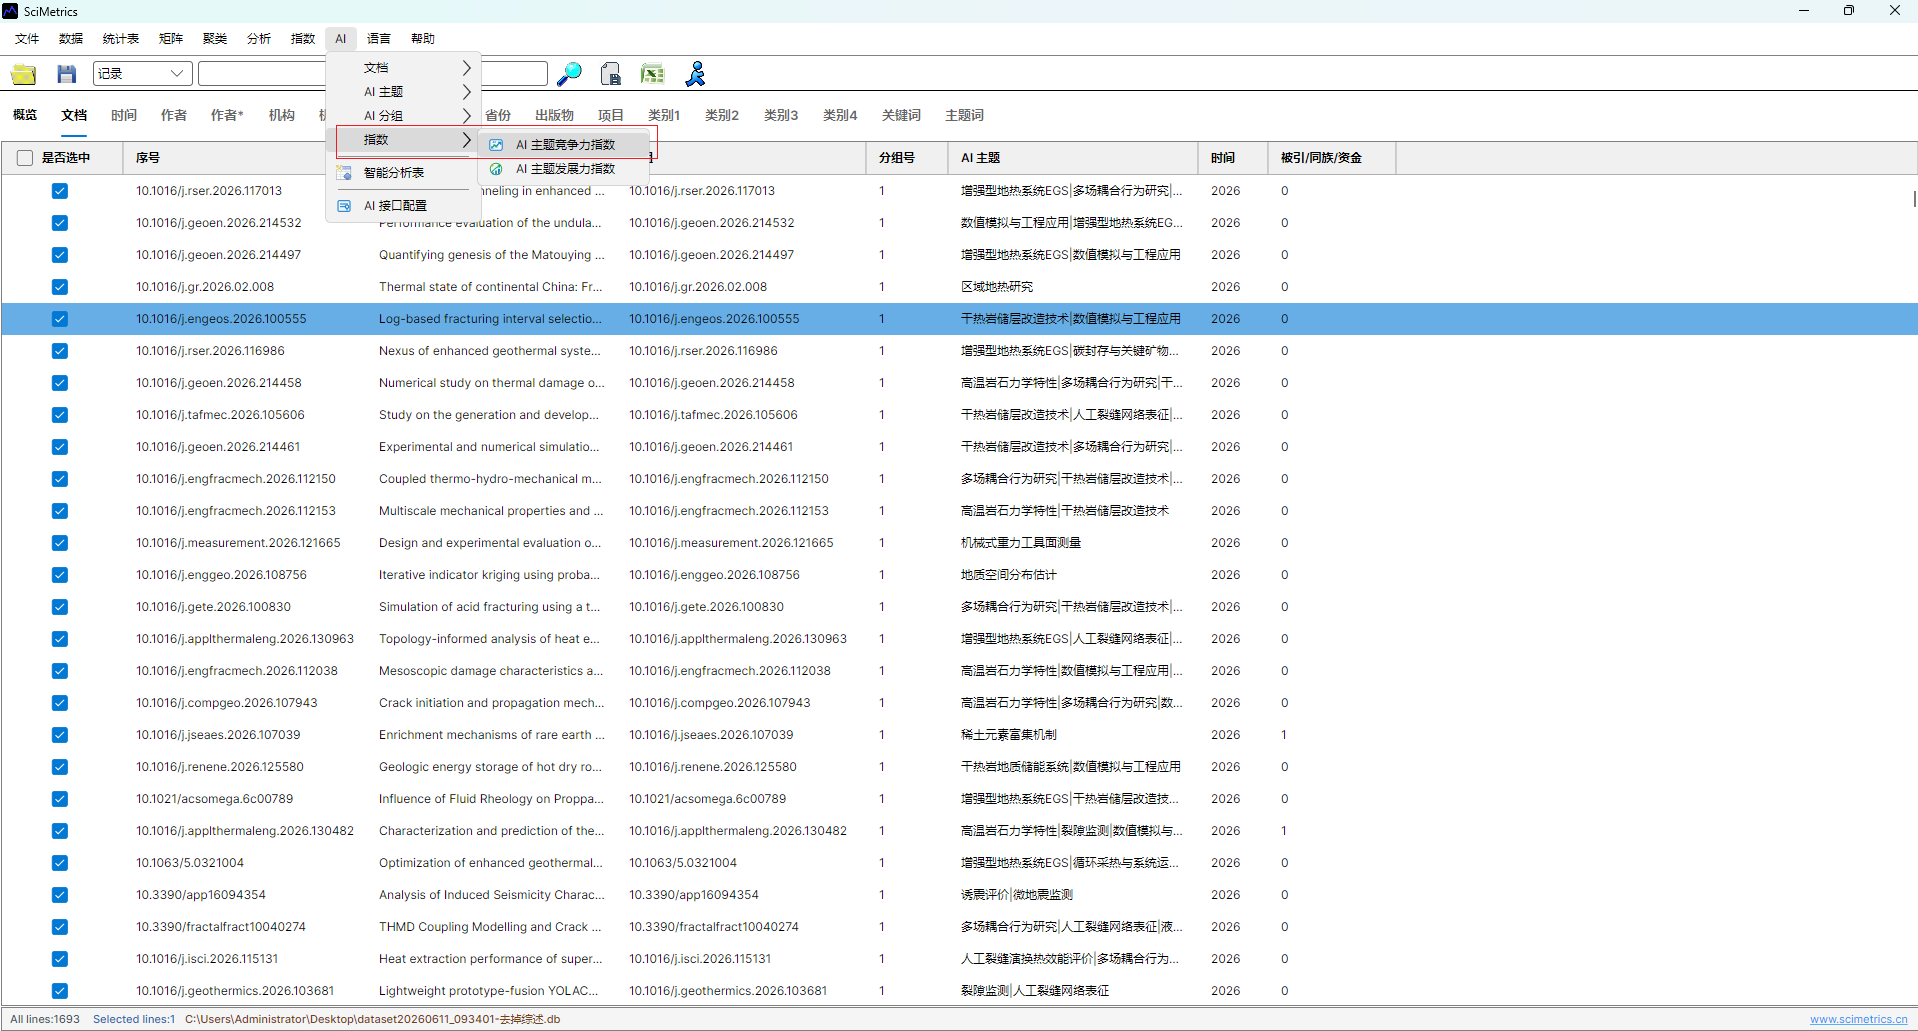
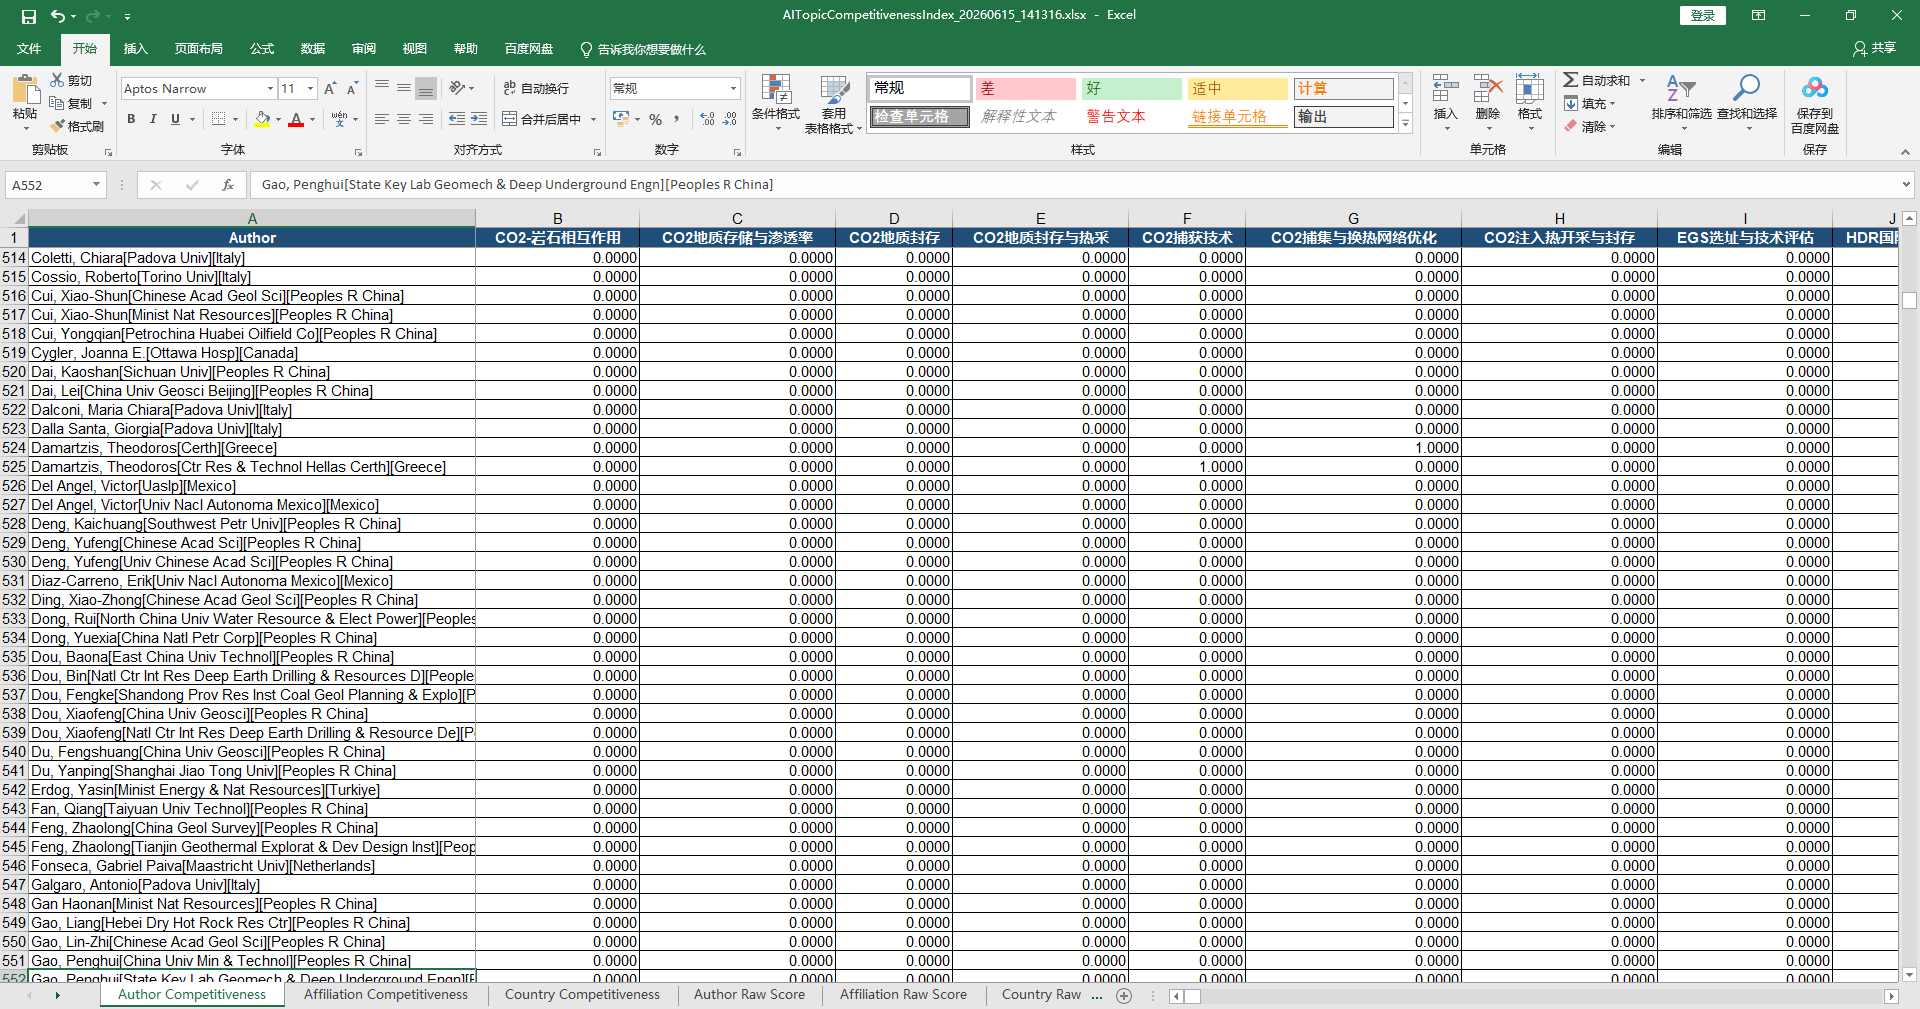
- Export or calculate the AI topic competitiveness index.
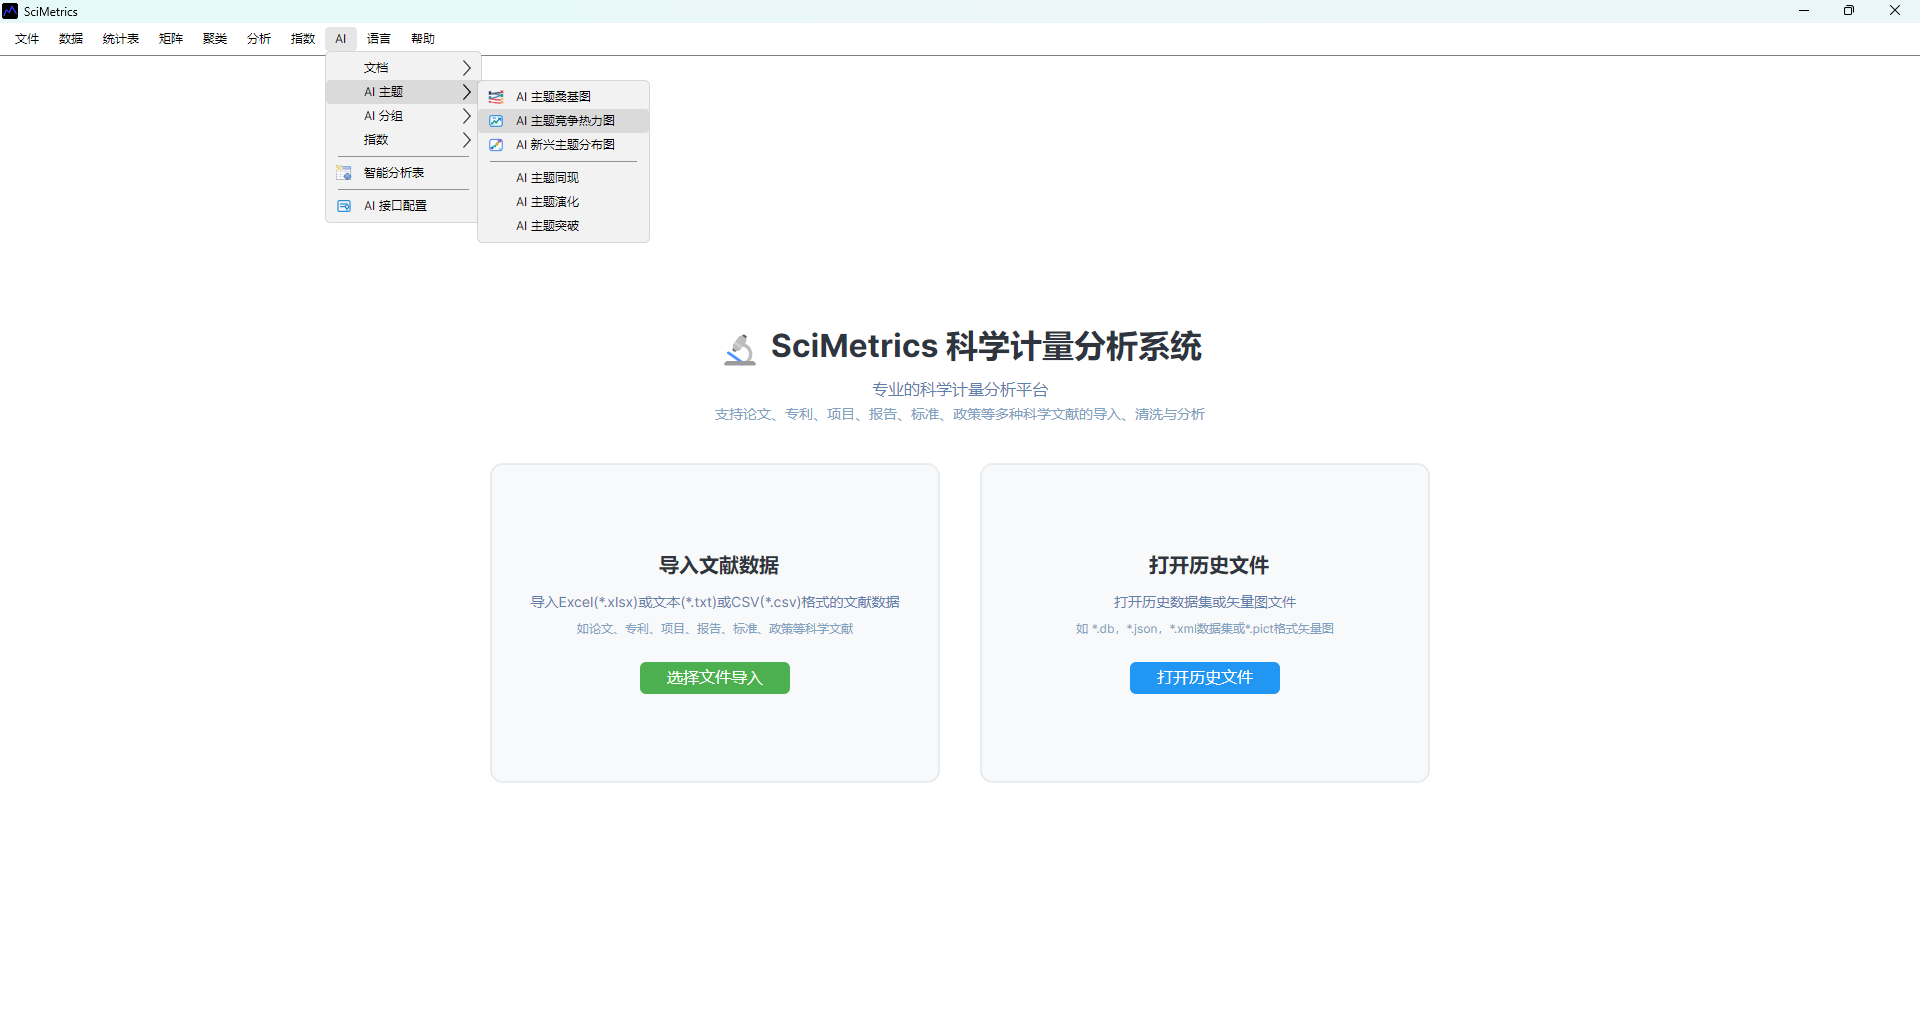
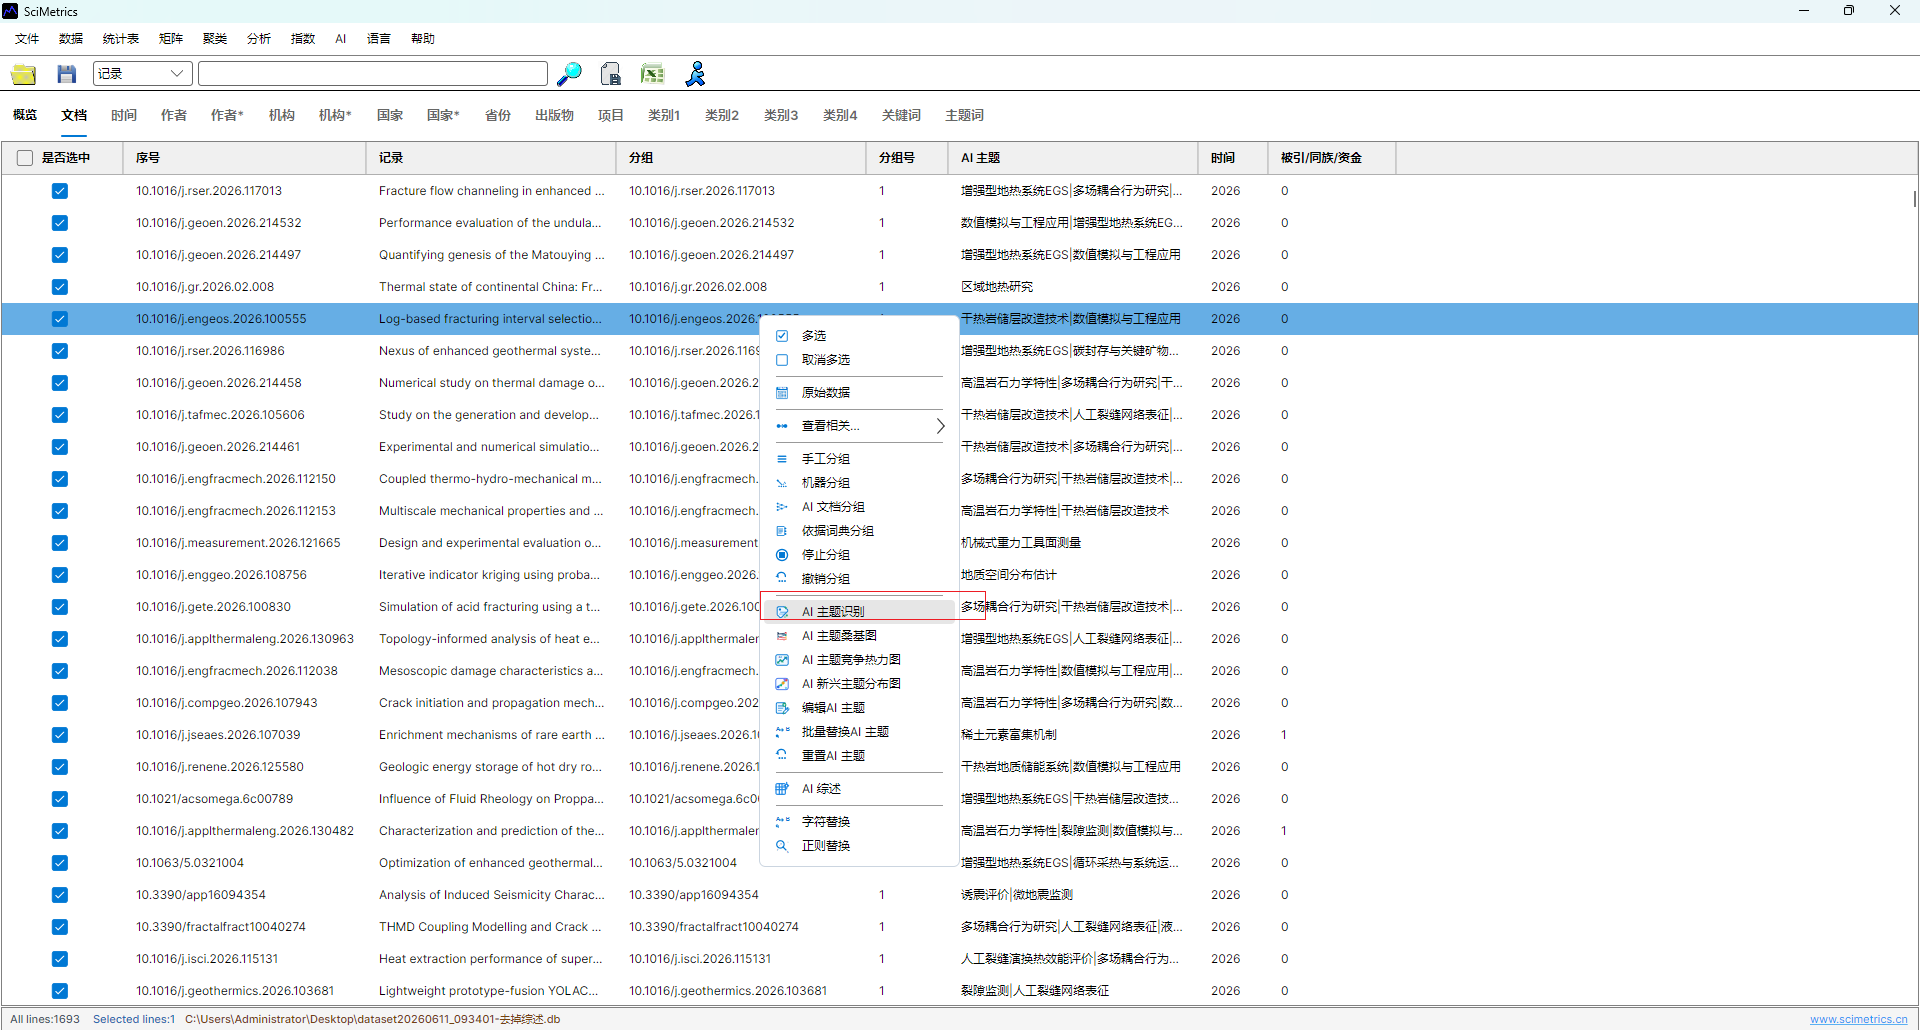
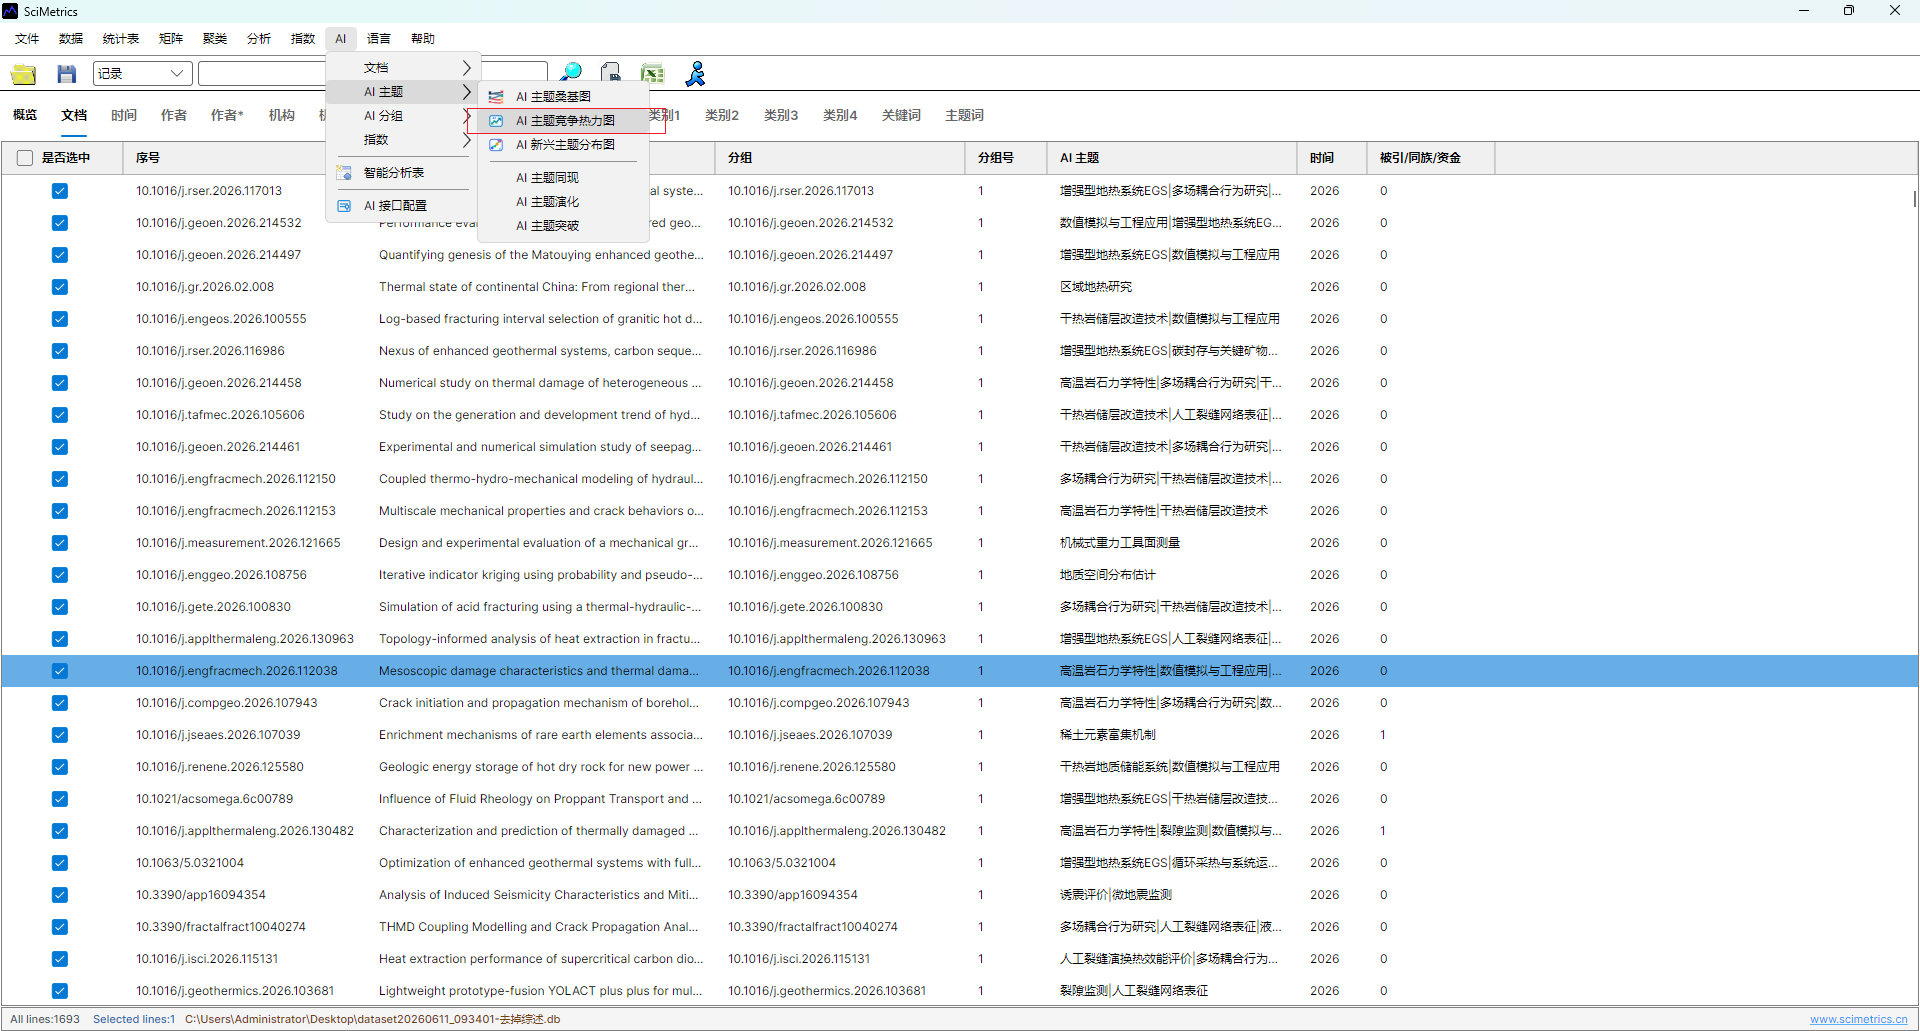
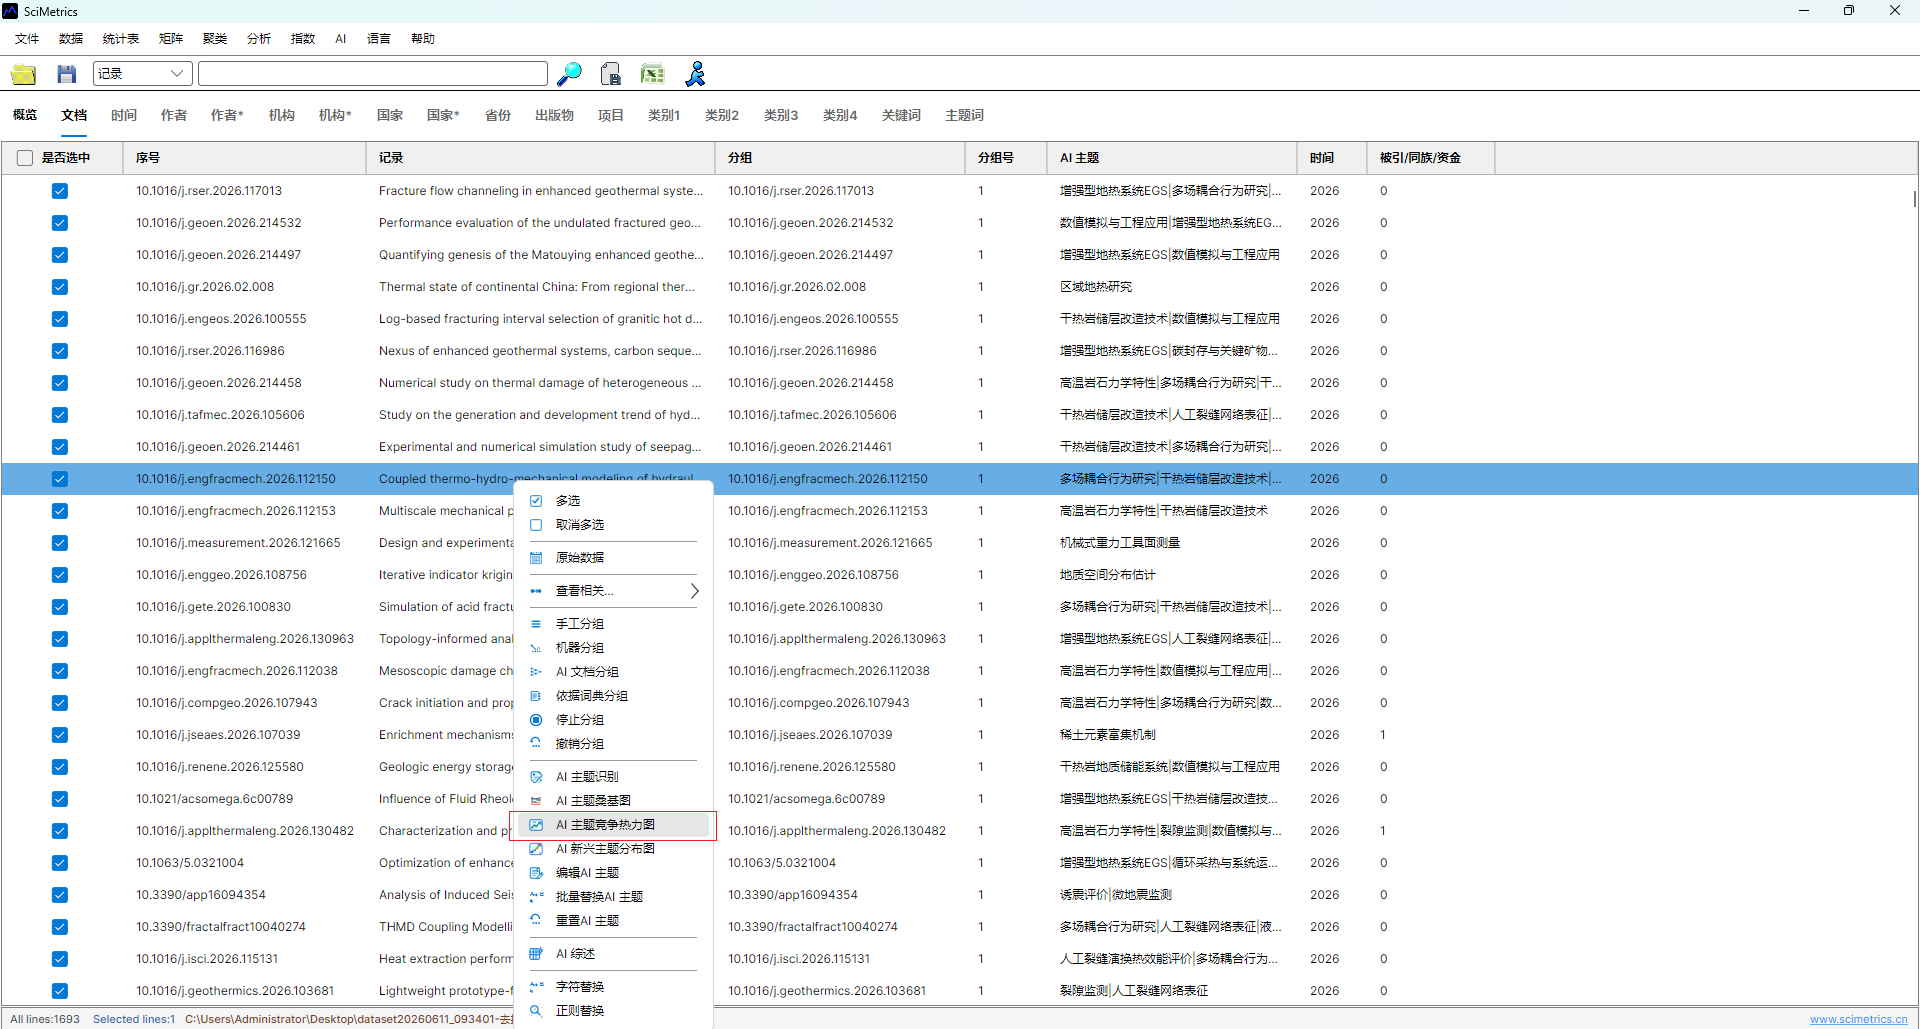
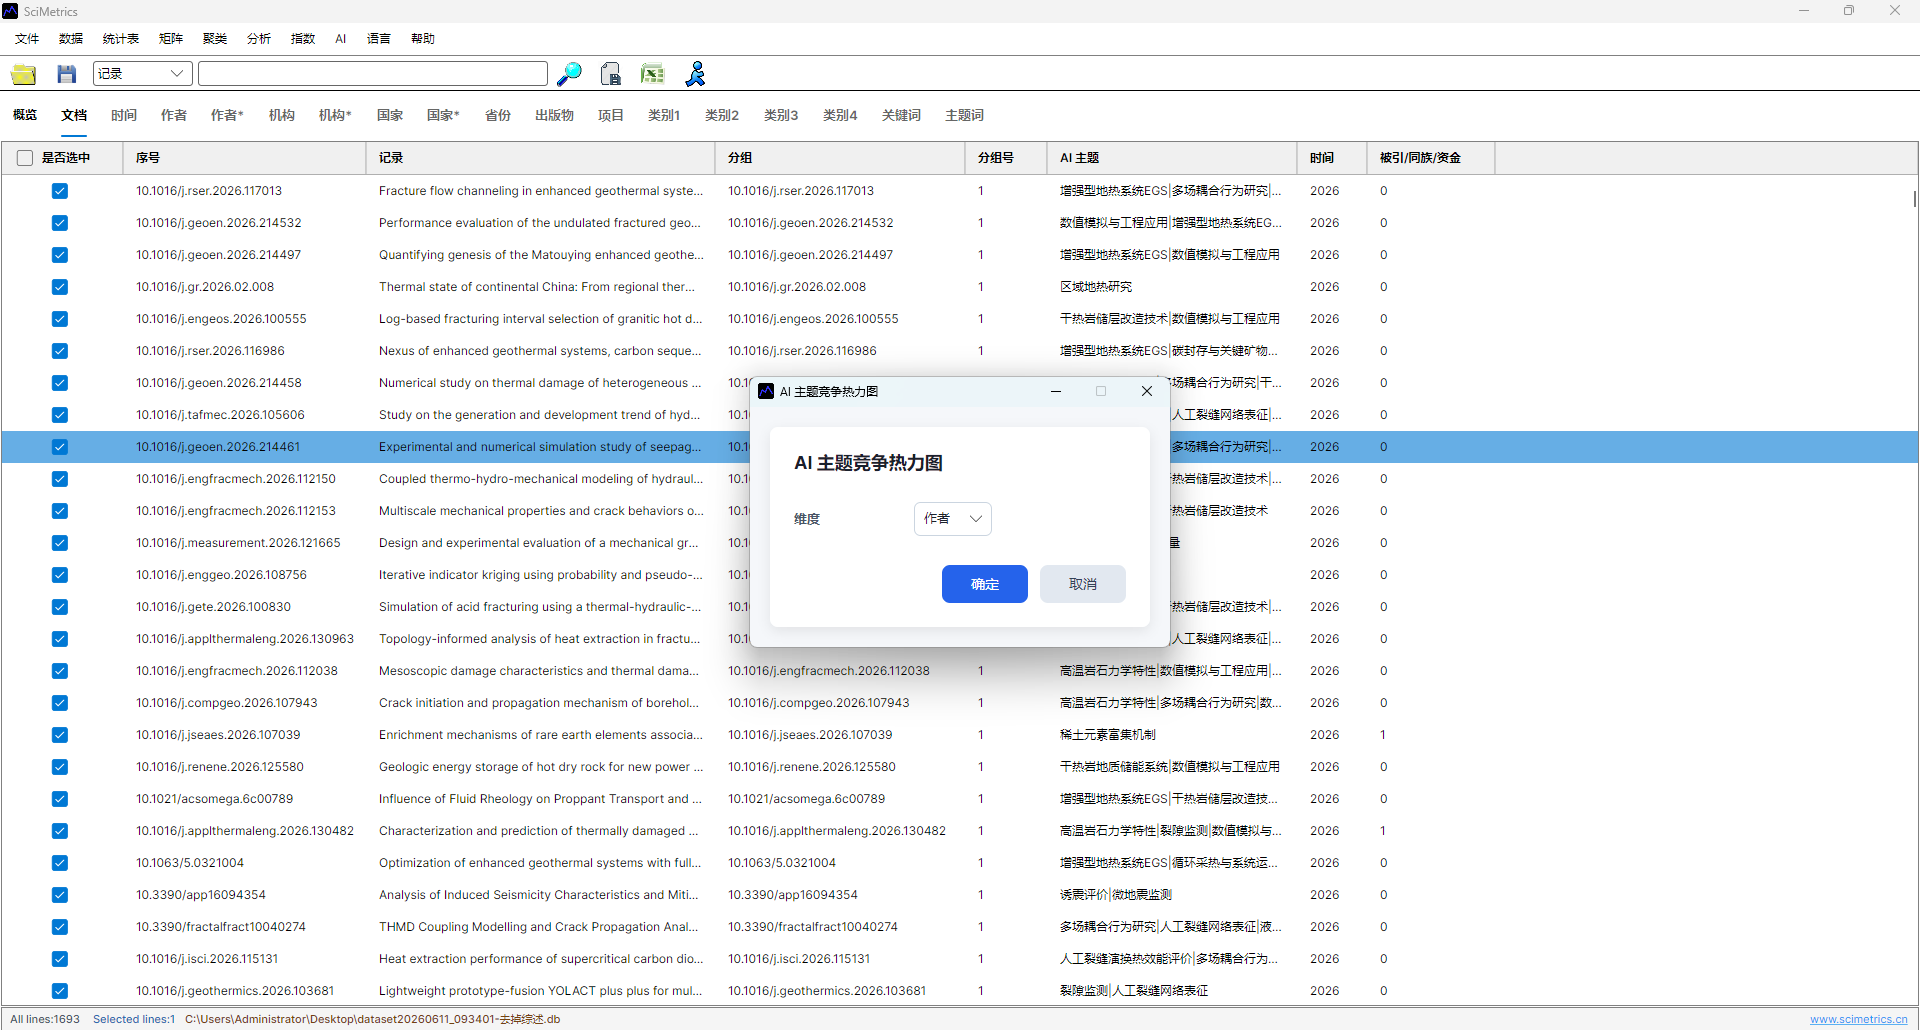
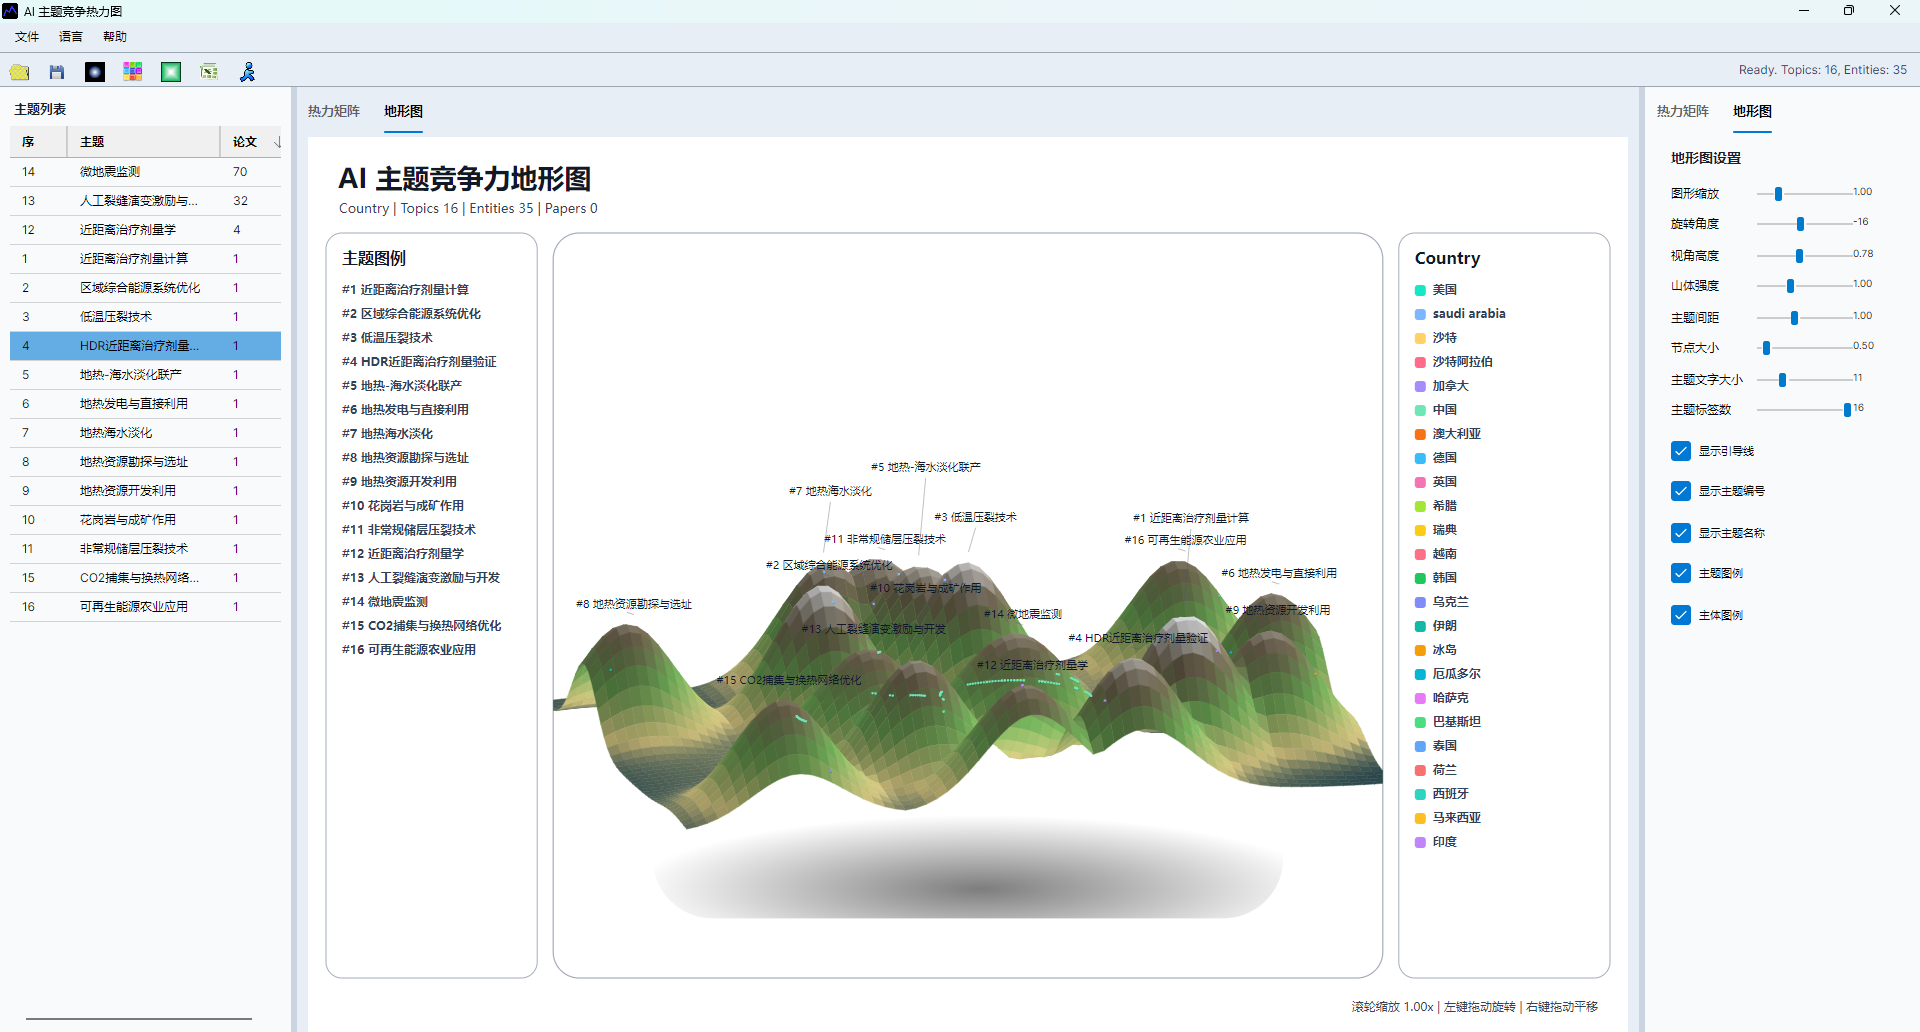
- Open the AI topic competitiveness heatmap or terrain view.
- Choose the subject dimension.
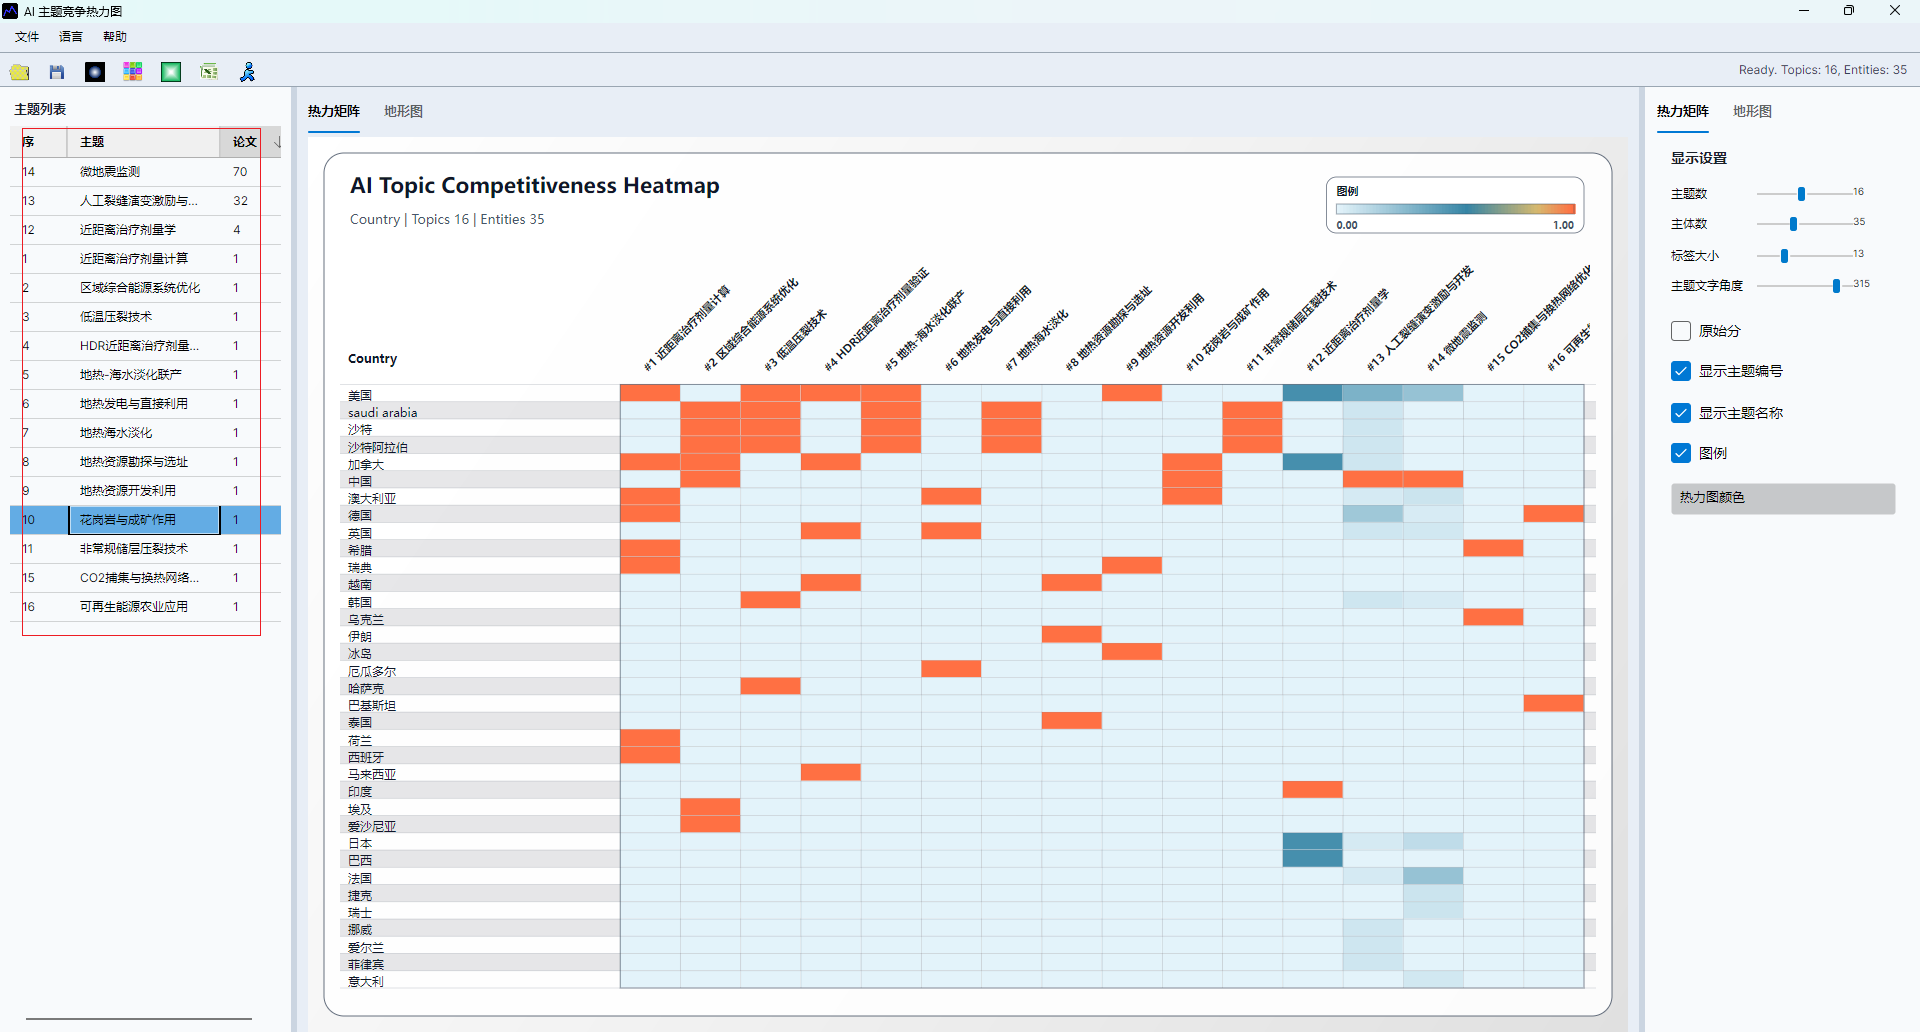
- Set topic and subject limits.
- Generate the matrix and adjust display options such as color, labels, background, and scale.
Reading The Heatmap
High-intensity cells show where a subject is highly active or competitive in a topic. A row with many strong cells means the topic is widely contested. A column with several strong cells means the subject has a broad topic layout.
The terrain view can help communicate concentration and high-value areas, but the heatmap is usually easier for precise comparison. Use exported Excel data when a numeric conclusion is needed.
Review Rules
- Check whether the subject names were merged correctly.
- Avoid comparing topics with very different document volumes without reading supporting counts.
- Use selected-paper mode only when the selection rule is clear and recorded.
- Keep the exported matrix together with the figure for evidence tracking.
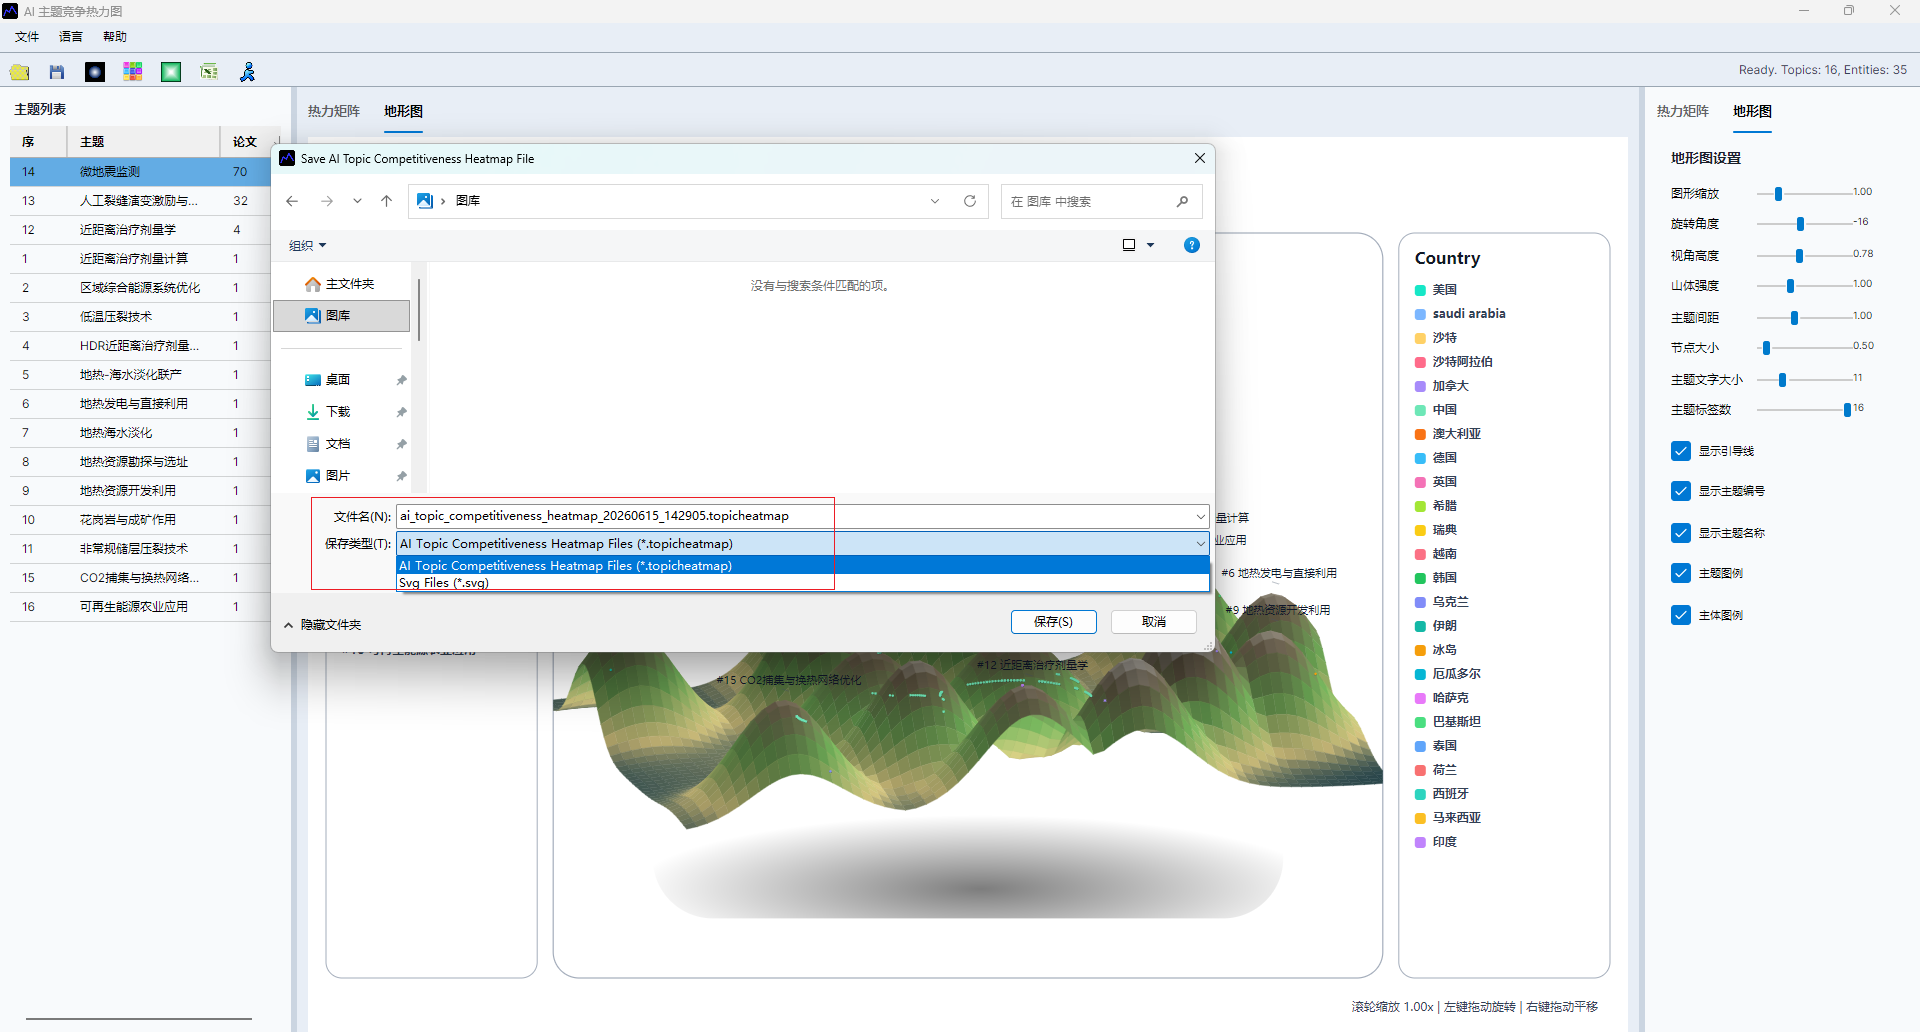
Interface Screenshots
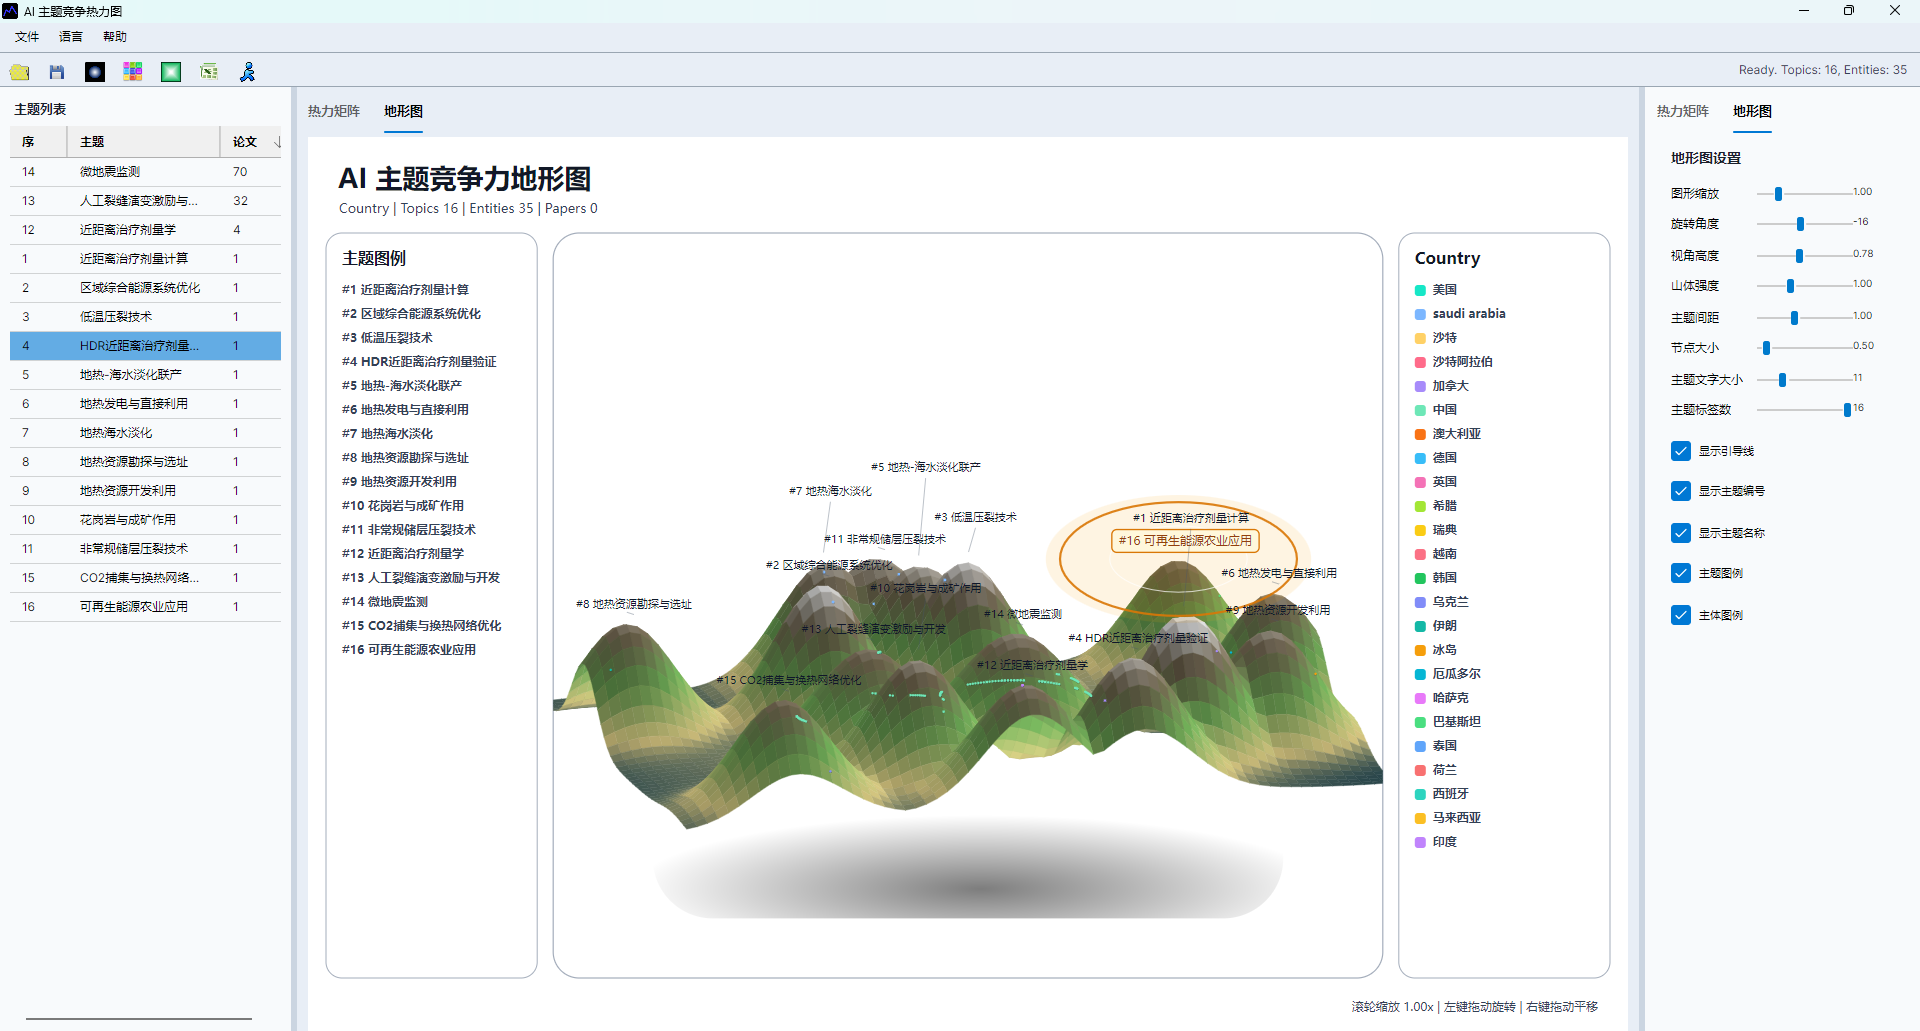
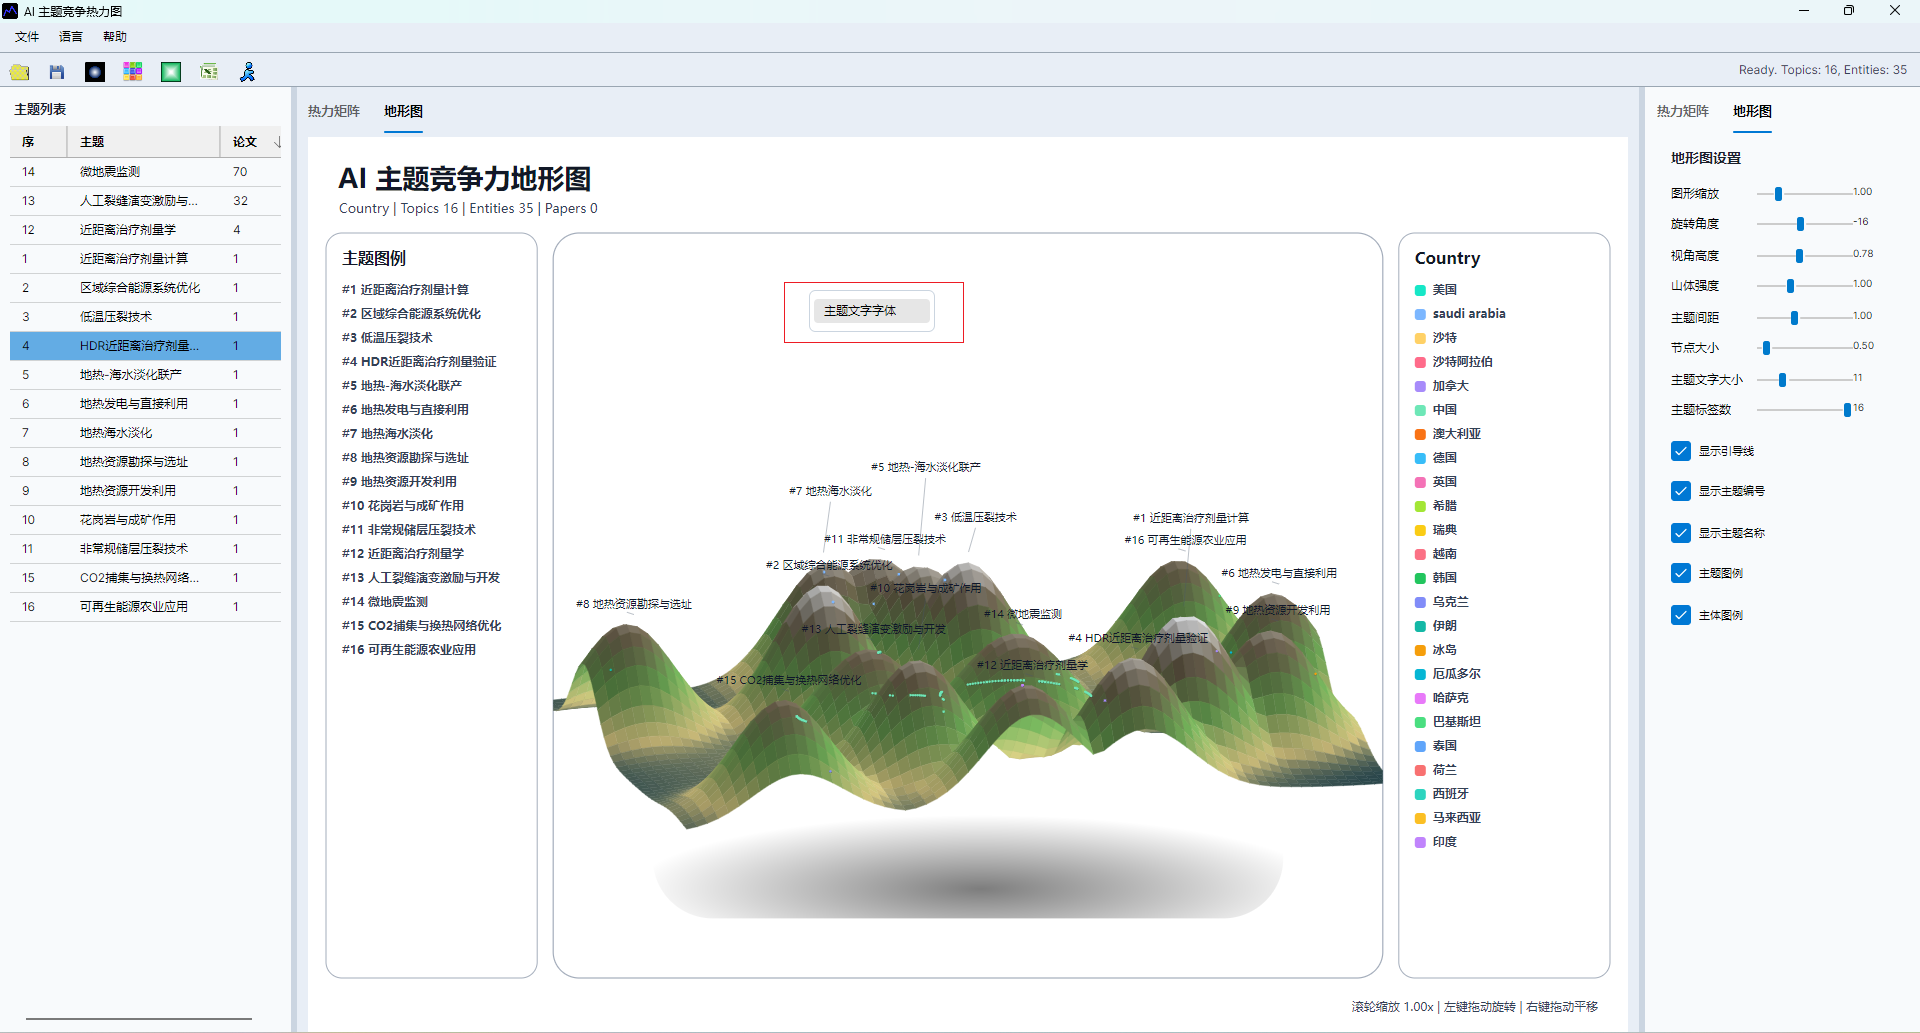
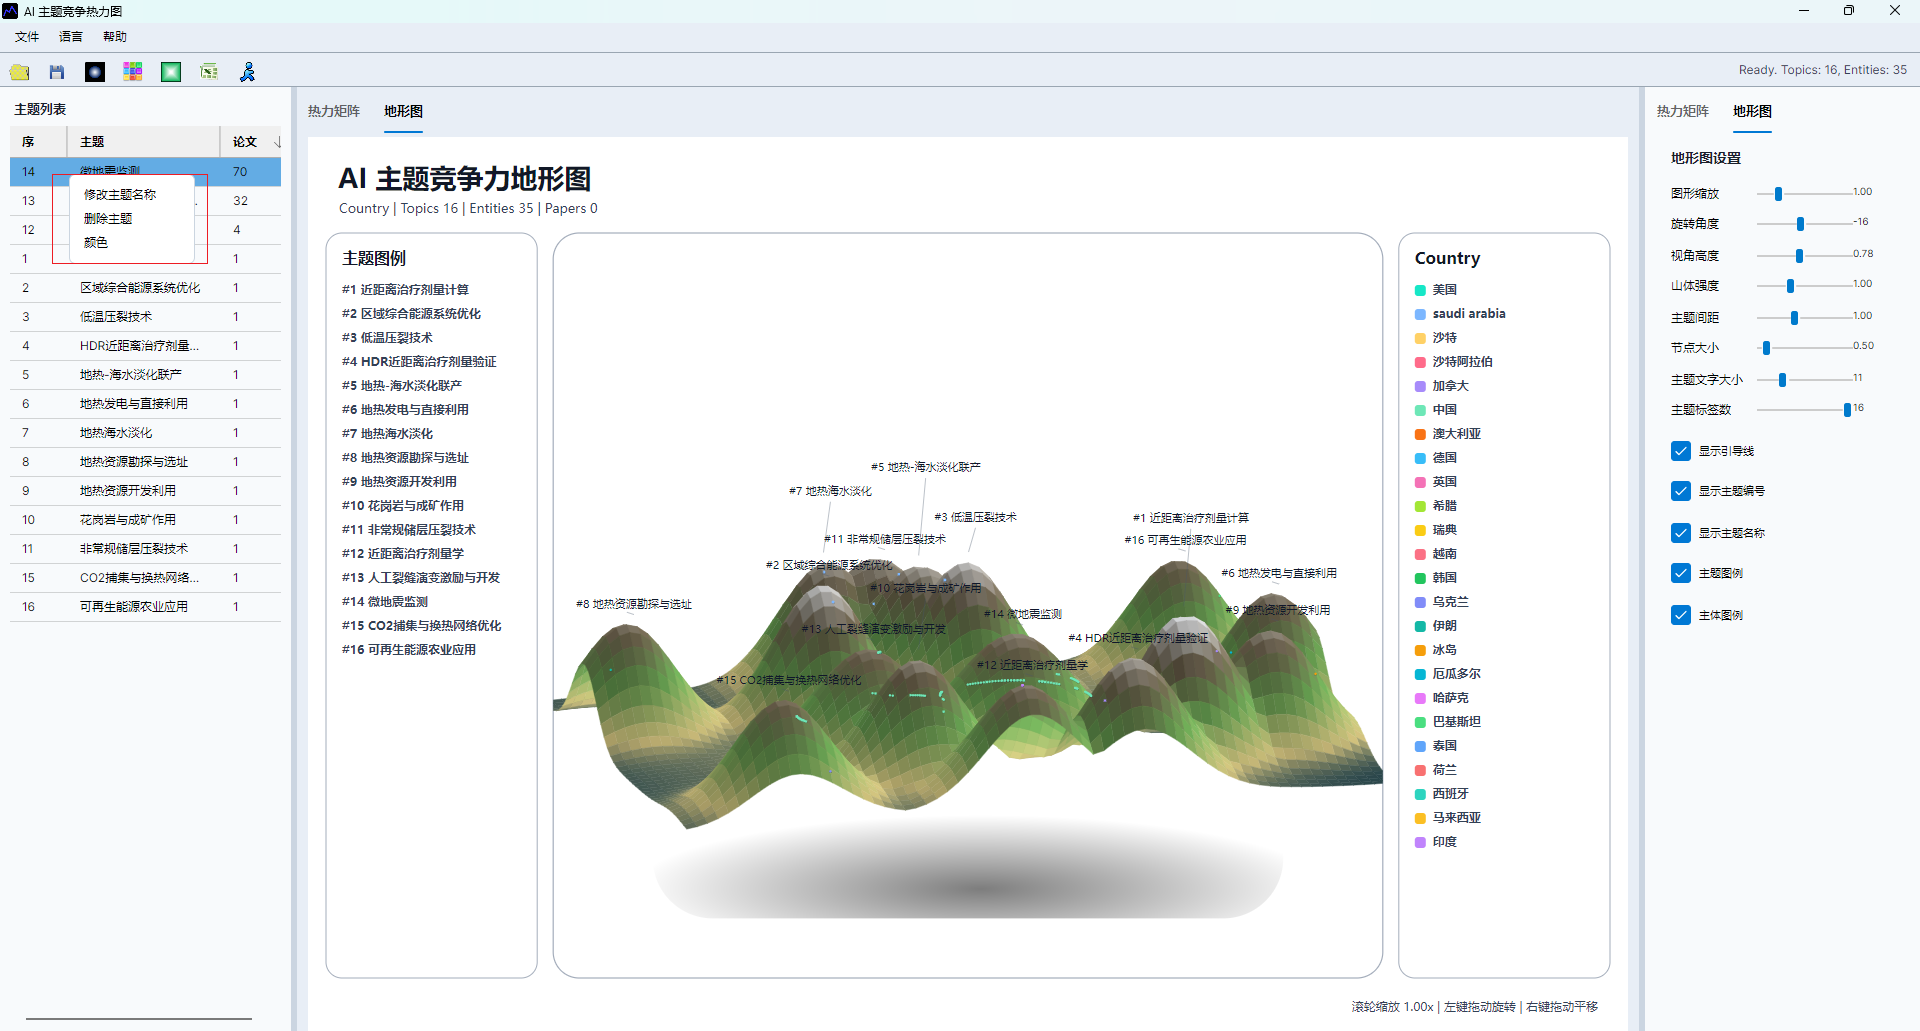
The screenshots below are retained to verify menu entries, parameter settings, result views, and export locations.