
Quick Start
Install SciMetrics, sign in, check basic settings, and run a small sample before processing formal data.
Quick Start
Use this page when you open SciMetrics for the first time or need to verify a new workstation.
First run
- Download the installer that matches your operating system from the home page.
- Install SciMetrics and launch the application.
- Sign in with your assigned account, group license, or registration code.
- Open the settings page and check language, default storage path, AI model configuration, and network access.
- Import a small sample dataset first. After the workflow is verified, import formal data.
Recommended preparation
- Keep a copy of the original dataset before cleaning or merging records.
- Prepare a short project note describing data source, retrieval date, search query, and inclusion scope.
- If AI features are needed, configure the endpoint, model name, and API key before analysis.
- If your organization has data-security rules, confirm whether data can be sent to a cloud model.
Import Data
Import literature, patent, project, institution, and other research data into a reusable project dataset.
Import Data
SciMetrics supports literature, patent, project, institution, and other research data scenarios. Import quality affects every later result, so spend a few minutes checking fields before analysis.
Recommended workflow
- Choose the data type and file format in the data reading window.
- Verify key fields such as title, author, institution, keyword, source, and time.
- Switch filters or map fields manually if recognition is incomplete.
- Save the result as a project dataset for reuse.
Before import
- Use clear file encoding and stable column names in Excel or CSV files.
- Keep the same source and export format within one batch.
- Avoid mixing time, author, institution, and keyword values in one column.
- Keep raw export files in a separate folder so the analysis can be repeated.
Common checks
| Check item | Why it matters |
|---|---|
| Time field | Trend analysis depends on reliable years or dates. |
| Author and institution fields | Collaboration networks require stable entity names. |
| Keyword and topic fields | Topic analysis depends on clean terms. |
| Source field | Journal and publication analysis needs source metadata. |
Clean Data
Standardize names, merge synonyms, and reduce noise so indicators and networks are more reliable.
Clean Data
Cleaning standardizes names, merges synonyms, and reduces noise so indicators and networks are more reliable.
Common actions
- Use replace, merge, and delete tools to fix obvious errors.
- Apply dictionaries or thesauri to authors, institutions, and keywords.
- Filter the scope by topic, year, source, or organization.
- Save cleaning rules so similar datasets can be processed consistently.
Notes
- Do not reduce terms blindly. Keep the level of detail required by the research question.
- For multilingual data, normalize aliases before clustering or network analysis.
- Keep a short cleaning log. Record major merge rules, deleted records, and filter conditions.
Quality checklist
- Key institutions use the same official name.
- Author variants have been checked before merging.
- Stop words and low-value keywords are removed.
- Important emerging terms are not accidentally merged into broad categories.
Analysis and Visualization
Move from basic statistics to networks, topic discovery, and trend evolution according to the question.
Analysis and Visualization
Move from basic statistics to networks, topic discovery, and trend evolution according to the question.
Analysis path
- Review basic statistics to understand data size, year distribution, and key entities.
- Build relation networks for authors, institutions, keywords, or topics.
- Tune thresholds, layout, clustering, and labels to improve readability.
- Compare tables and graphs to record evidence-backed findings.
Visualization checklist
- Node labels do not cover key information.
- Colors and clusters carry consistent meaning.
- Titles, legends, annotations, and time ranges are correct before export.
- The exported image resolution is suitable for the final report.
Interpretation tips
Use charts as evidence, not as the conclusion itself. A good report connects the visual pattern to a concrete question: who is active, what is growing, where collaboration happens, and what direction deserves attention.
AI-Assisted Workflow
Use AI for topic identification, text interpretation, report drafting, filter generation, and result review.
AI-Assisted Workflow
AI can support topic identification, text interpretation, report drafting, filter generation, and result review.
How to use
- Configure the model service before enabling AI features in analysis windows.
- Provide clear questions, field ranges, and output format requirements.
- Review AI-generated topics, summaries, and suggestions manually.
- Save confirmed results back to the project as report material or analysis input.
Quality control
- Treat AI output as assistance, not as a substitute for expert judgment.
- Confirm local or cloud model policies before processing sensitive data.
- Ask AI to explain its grouping logic when it generates topic labels or report paragraphs.
- Keep prompts and outputs when a result will be used in a formal report.
Good prompts
Summarize the following topic cluster in 3 sentences.
Keep institution names unchanged.
Return: topic label, evidence keywords, and interpretation.
AI Emerging Topic Visualization
Identify recent active topics, representative papers, novelty signals, and visual topic clusters.
AI Emerging Topic Identification and Visualization
This document explains how to identify emerging research topics from an imported literature dataset and render them as a visual paper map. It is useful for discovering recent active directions, representative papers, topic clusters, and papers with high novelty even when citation counts are still low.
Prerequisites
- A literature dataset with titles, years, citations, keywords, topic terms, references, or classification fields.
- A working AI model configuration for topic identification.
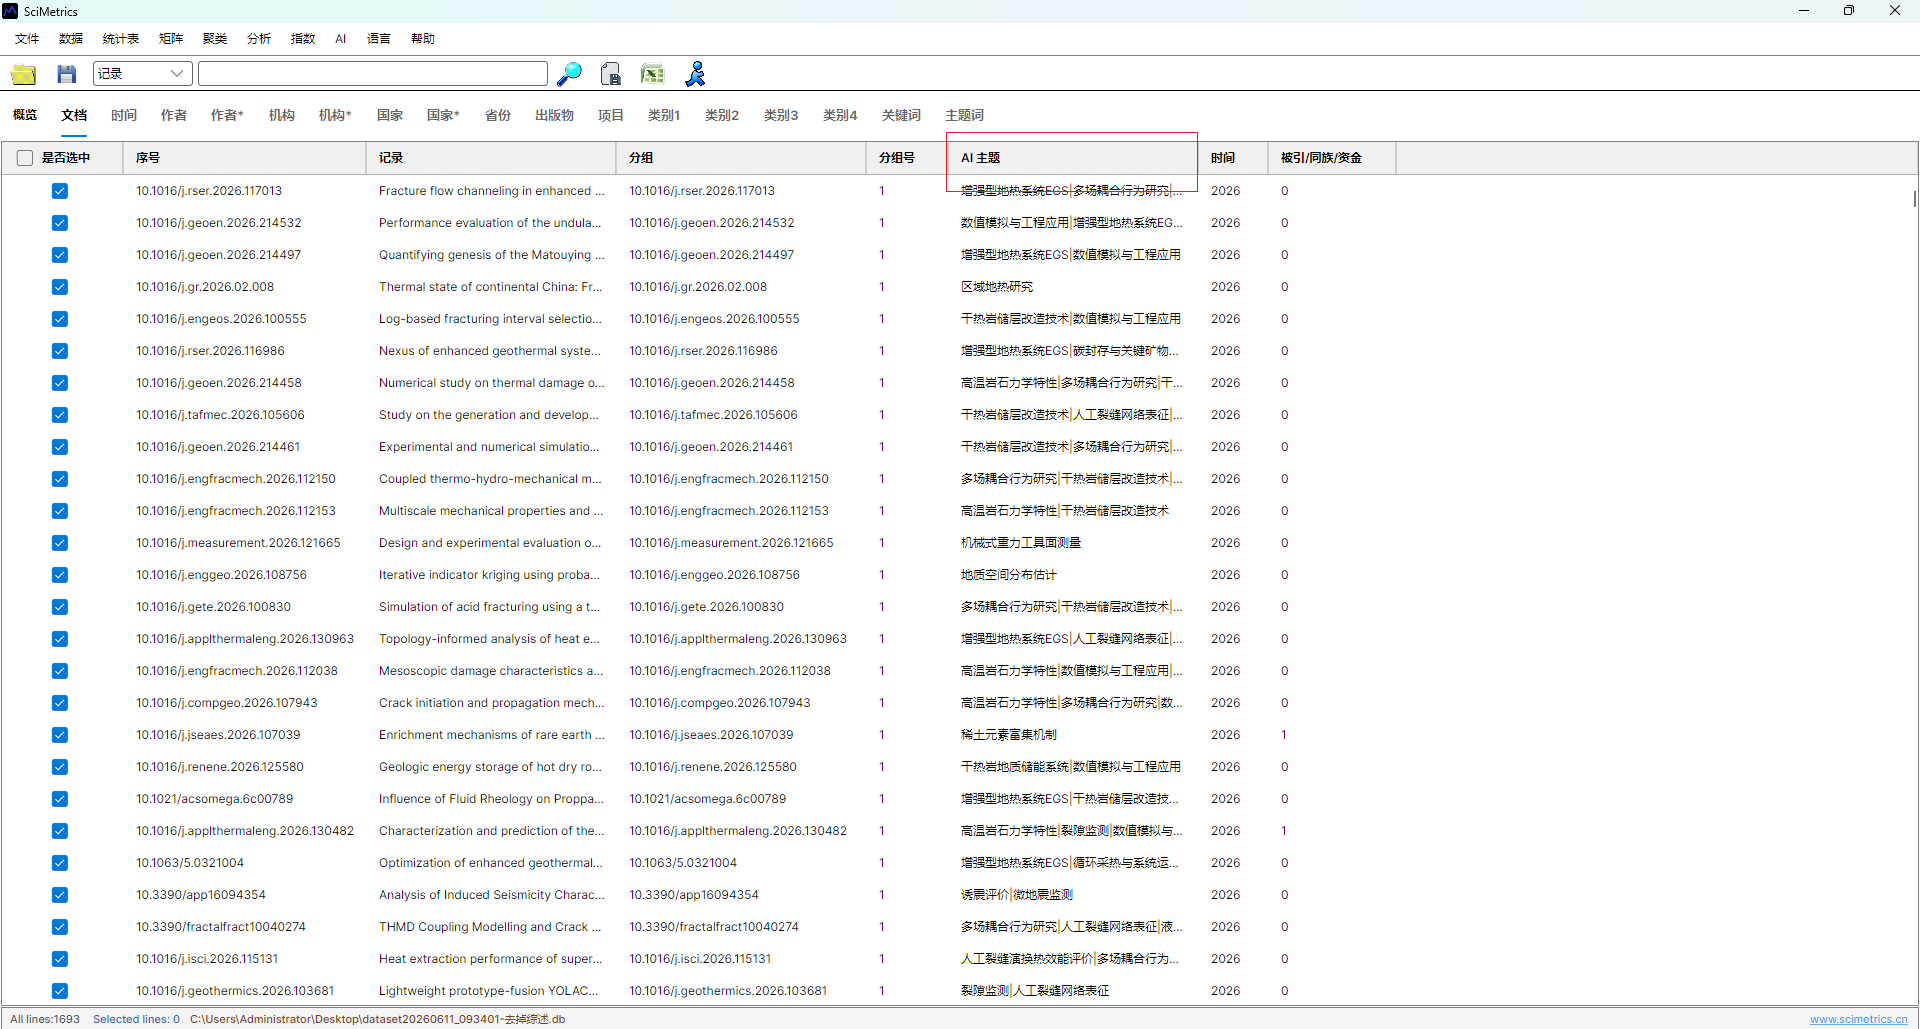
- AI topic labels generated or reviewed before visualization.
Workflow
- Open or import the dataset.
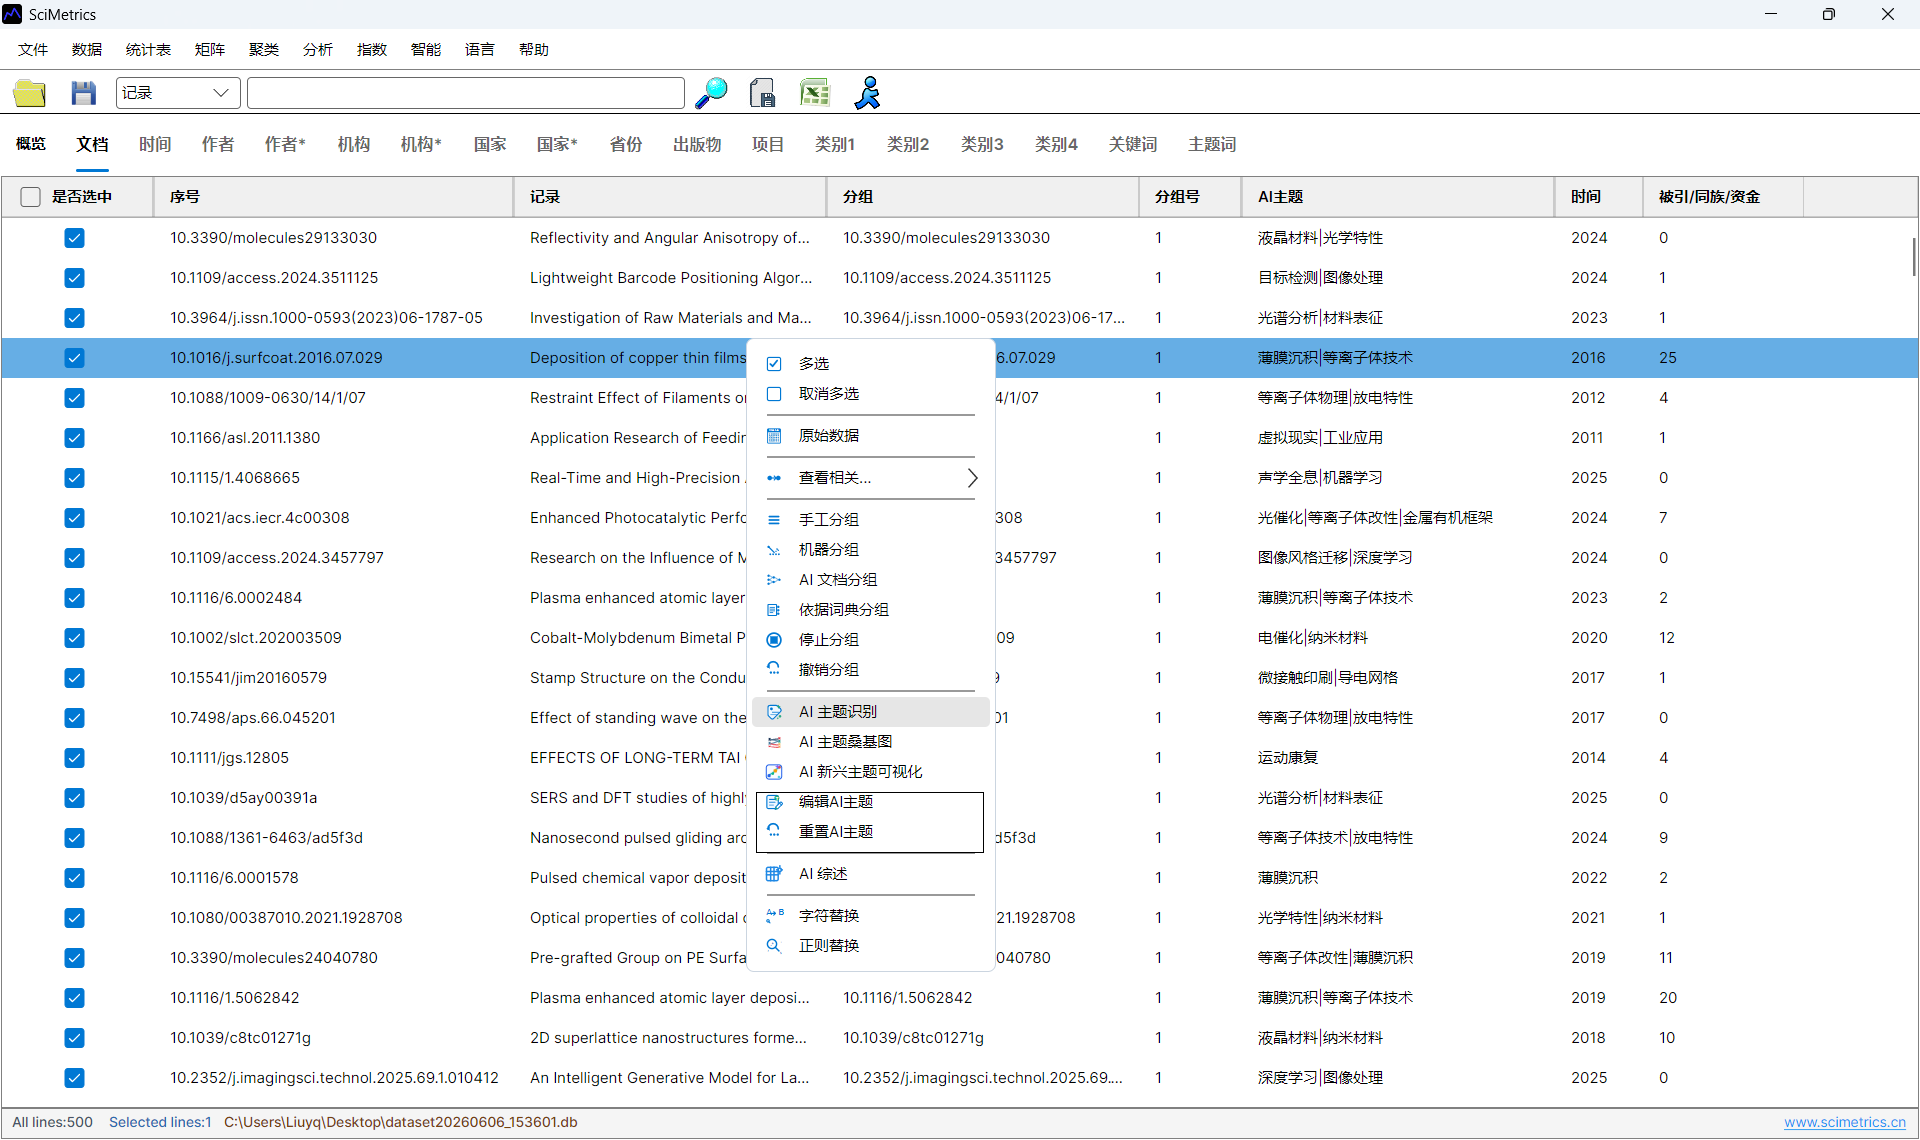
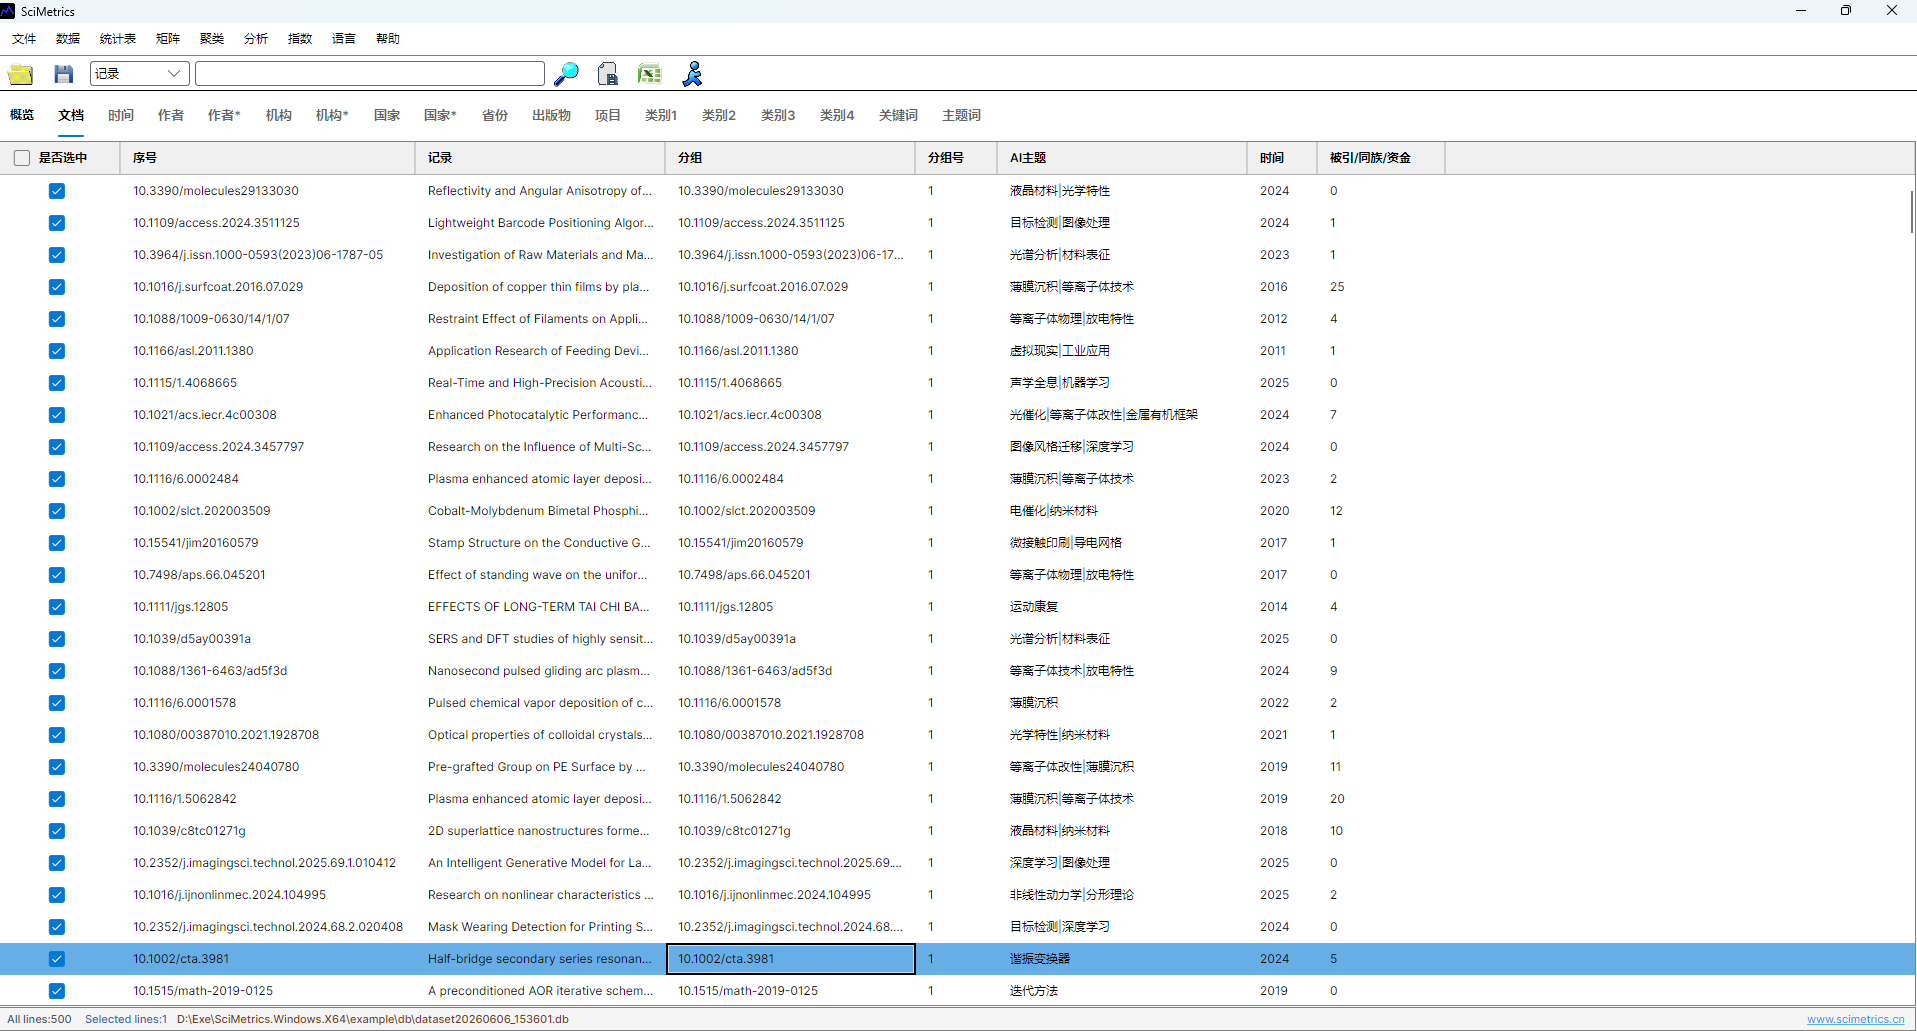
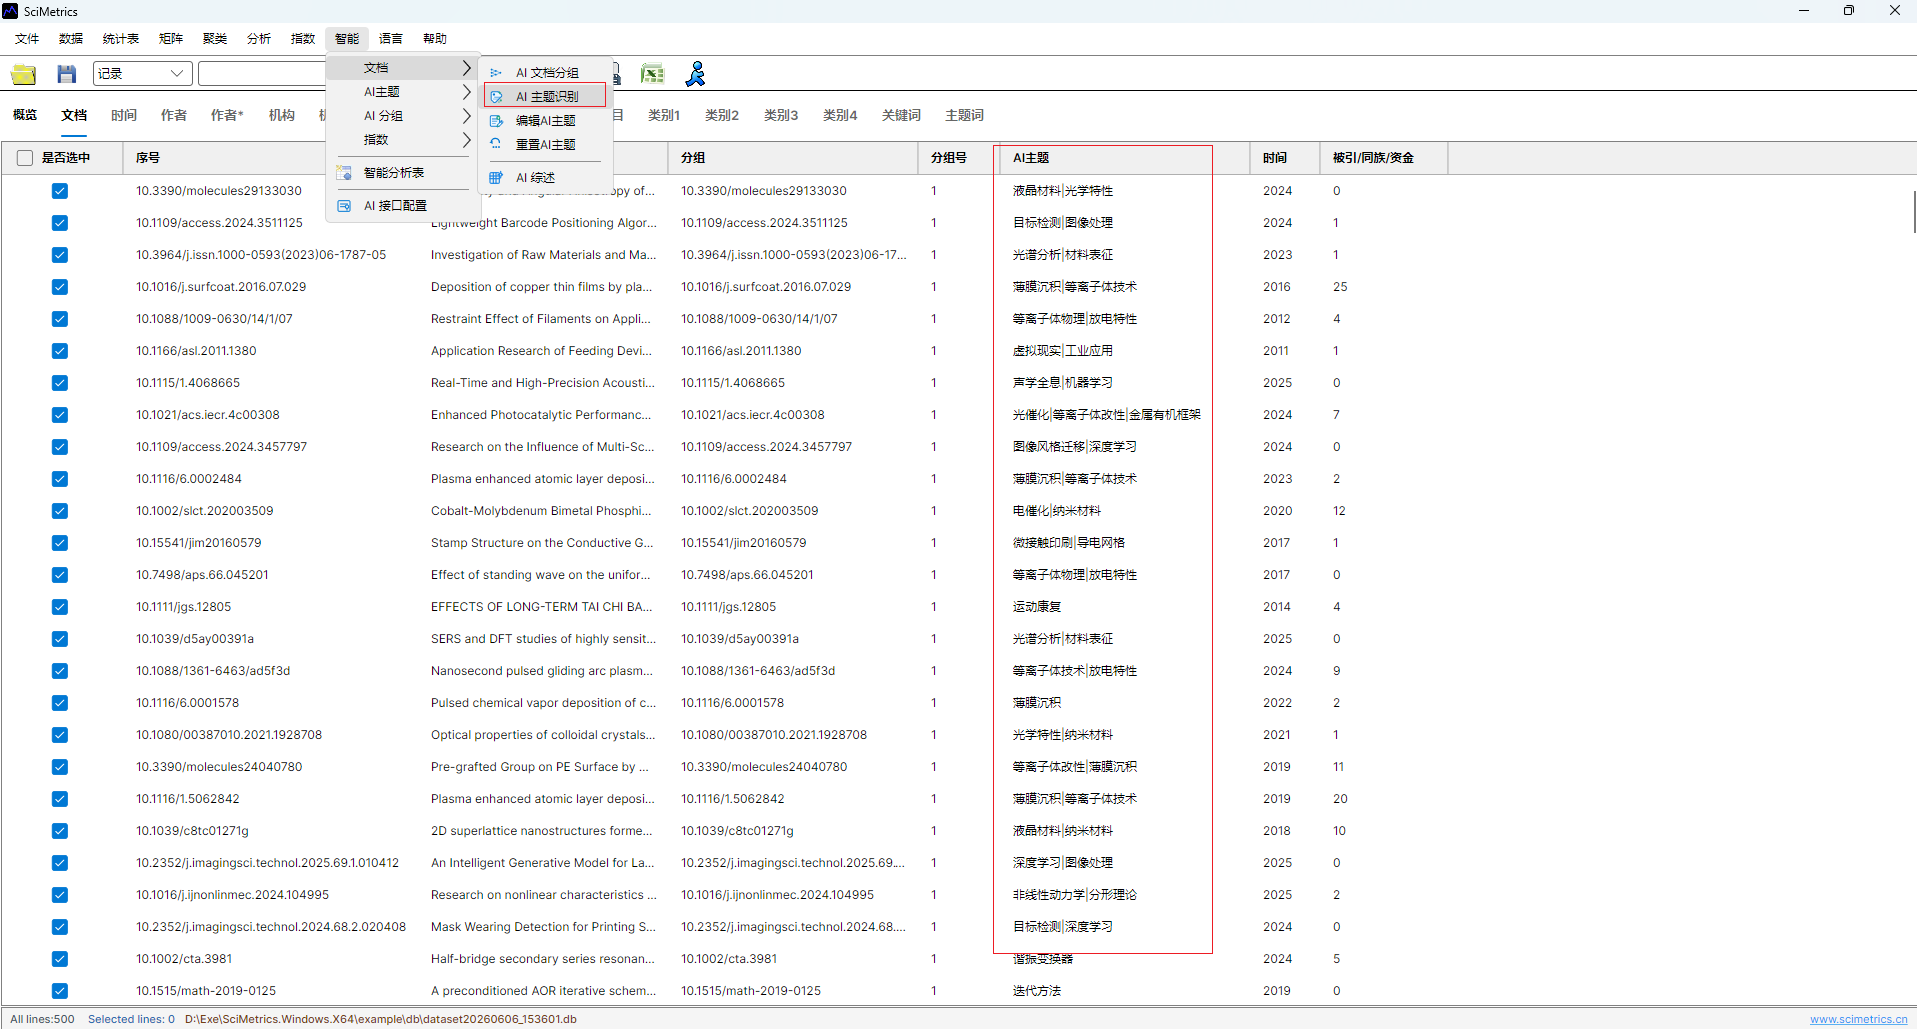
- Run
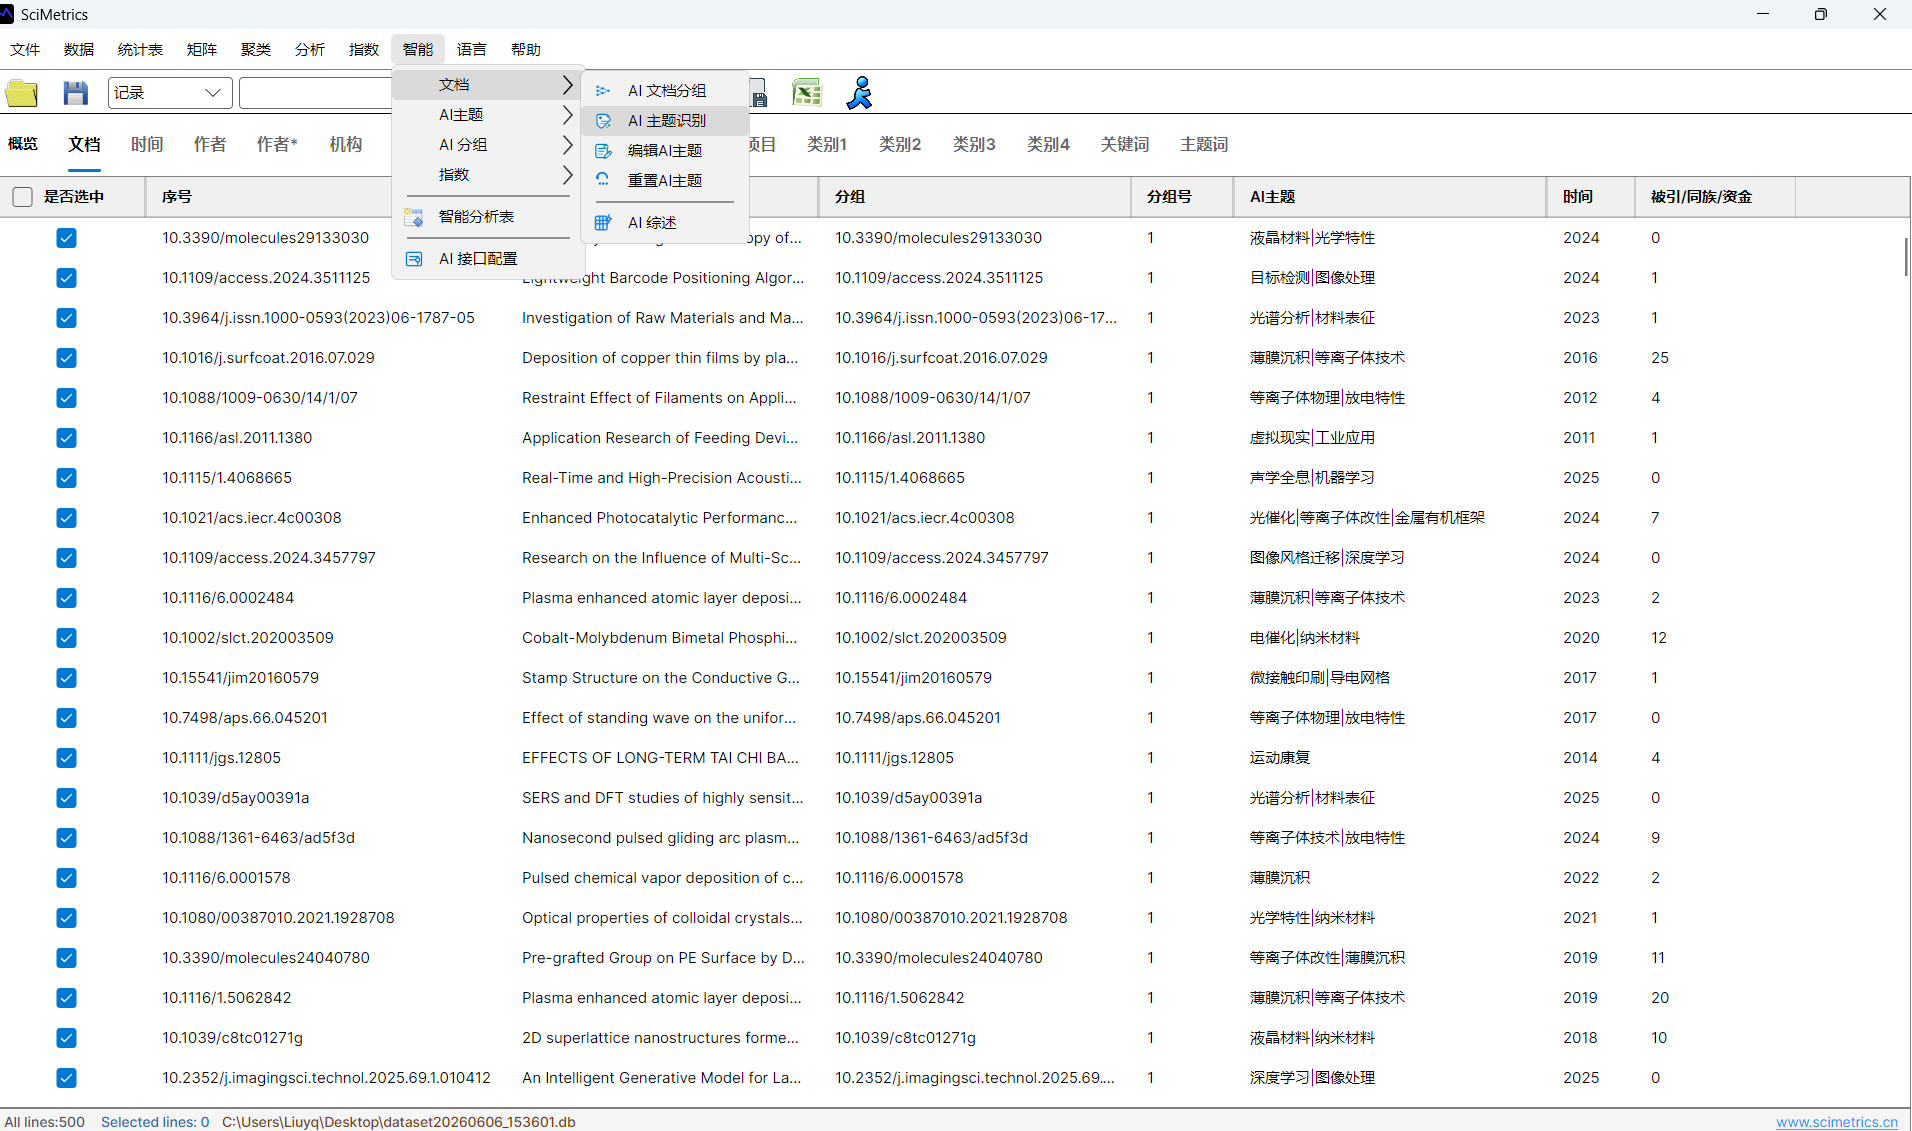
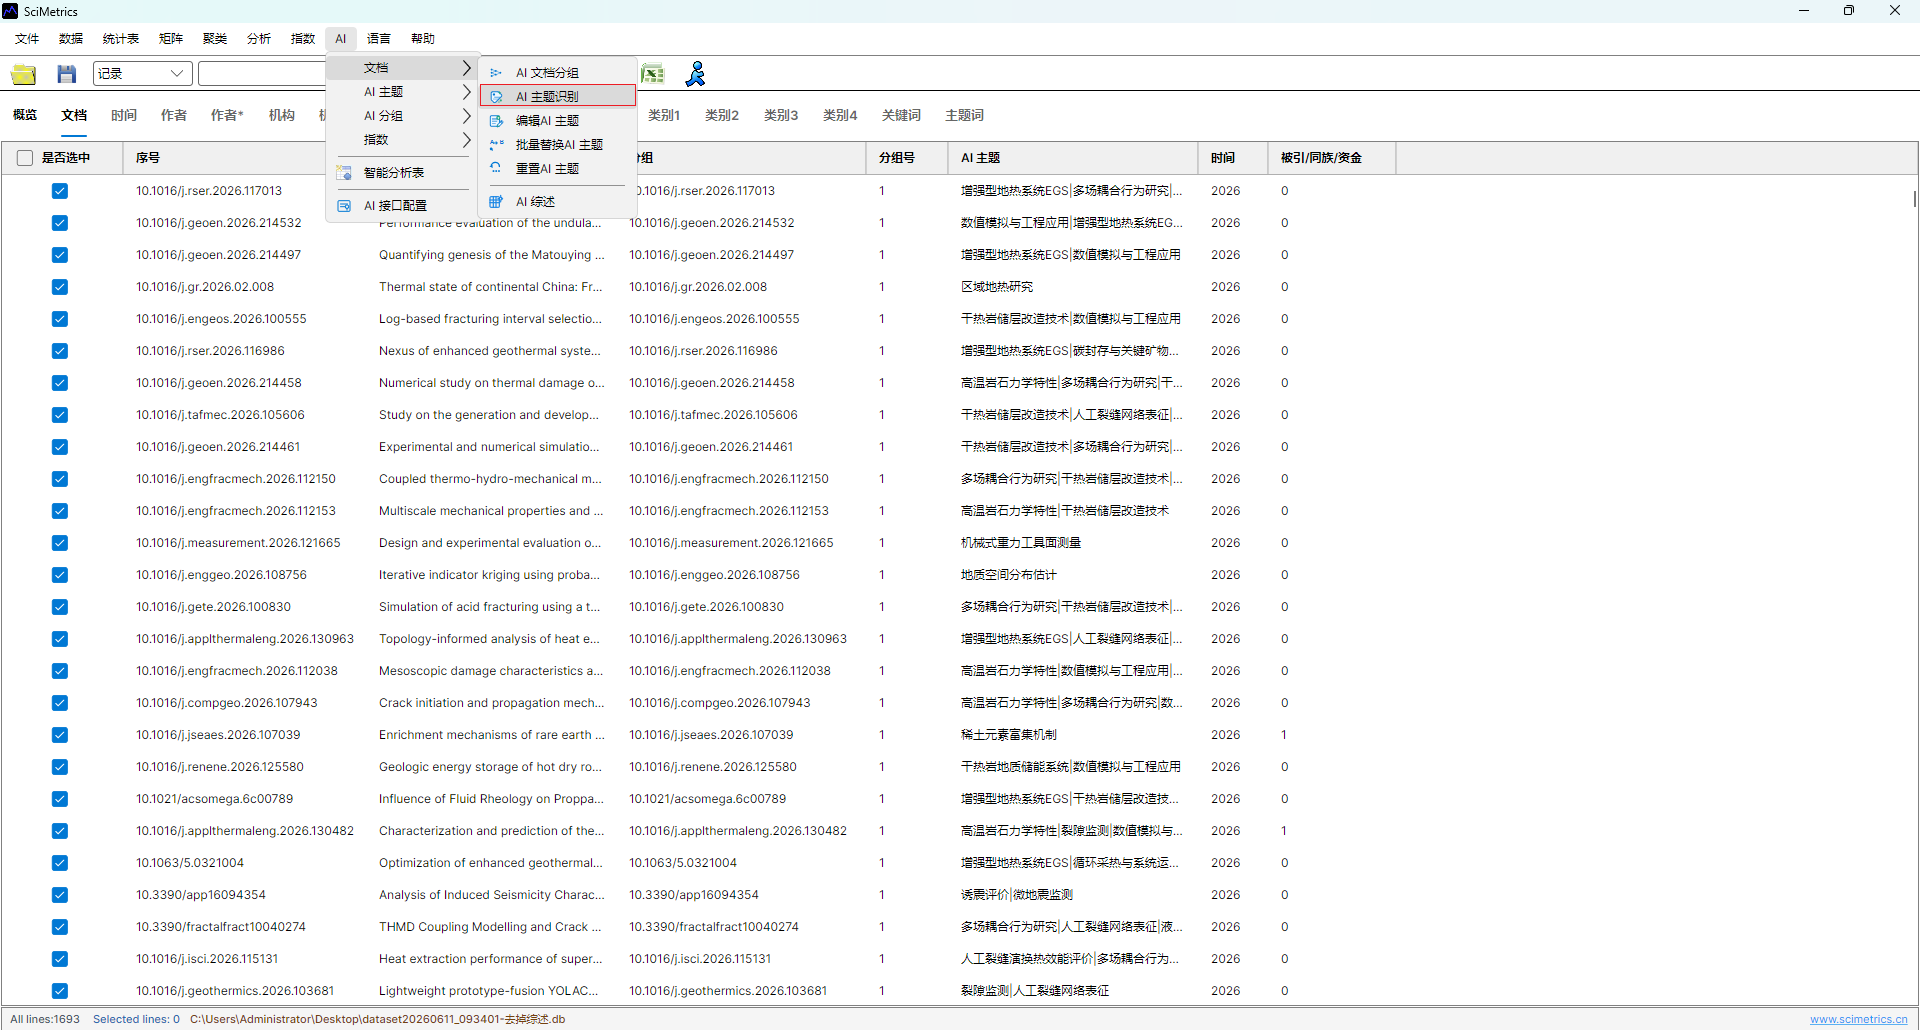
AI -> Document -> AI Topic Identification. - Review topic names and use
AI -> Document -> Edit AI Topicsif names need to be merged or corrected. - Open
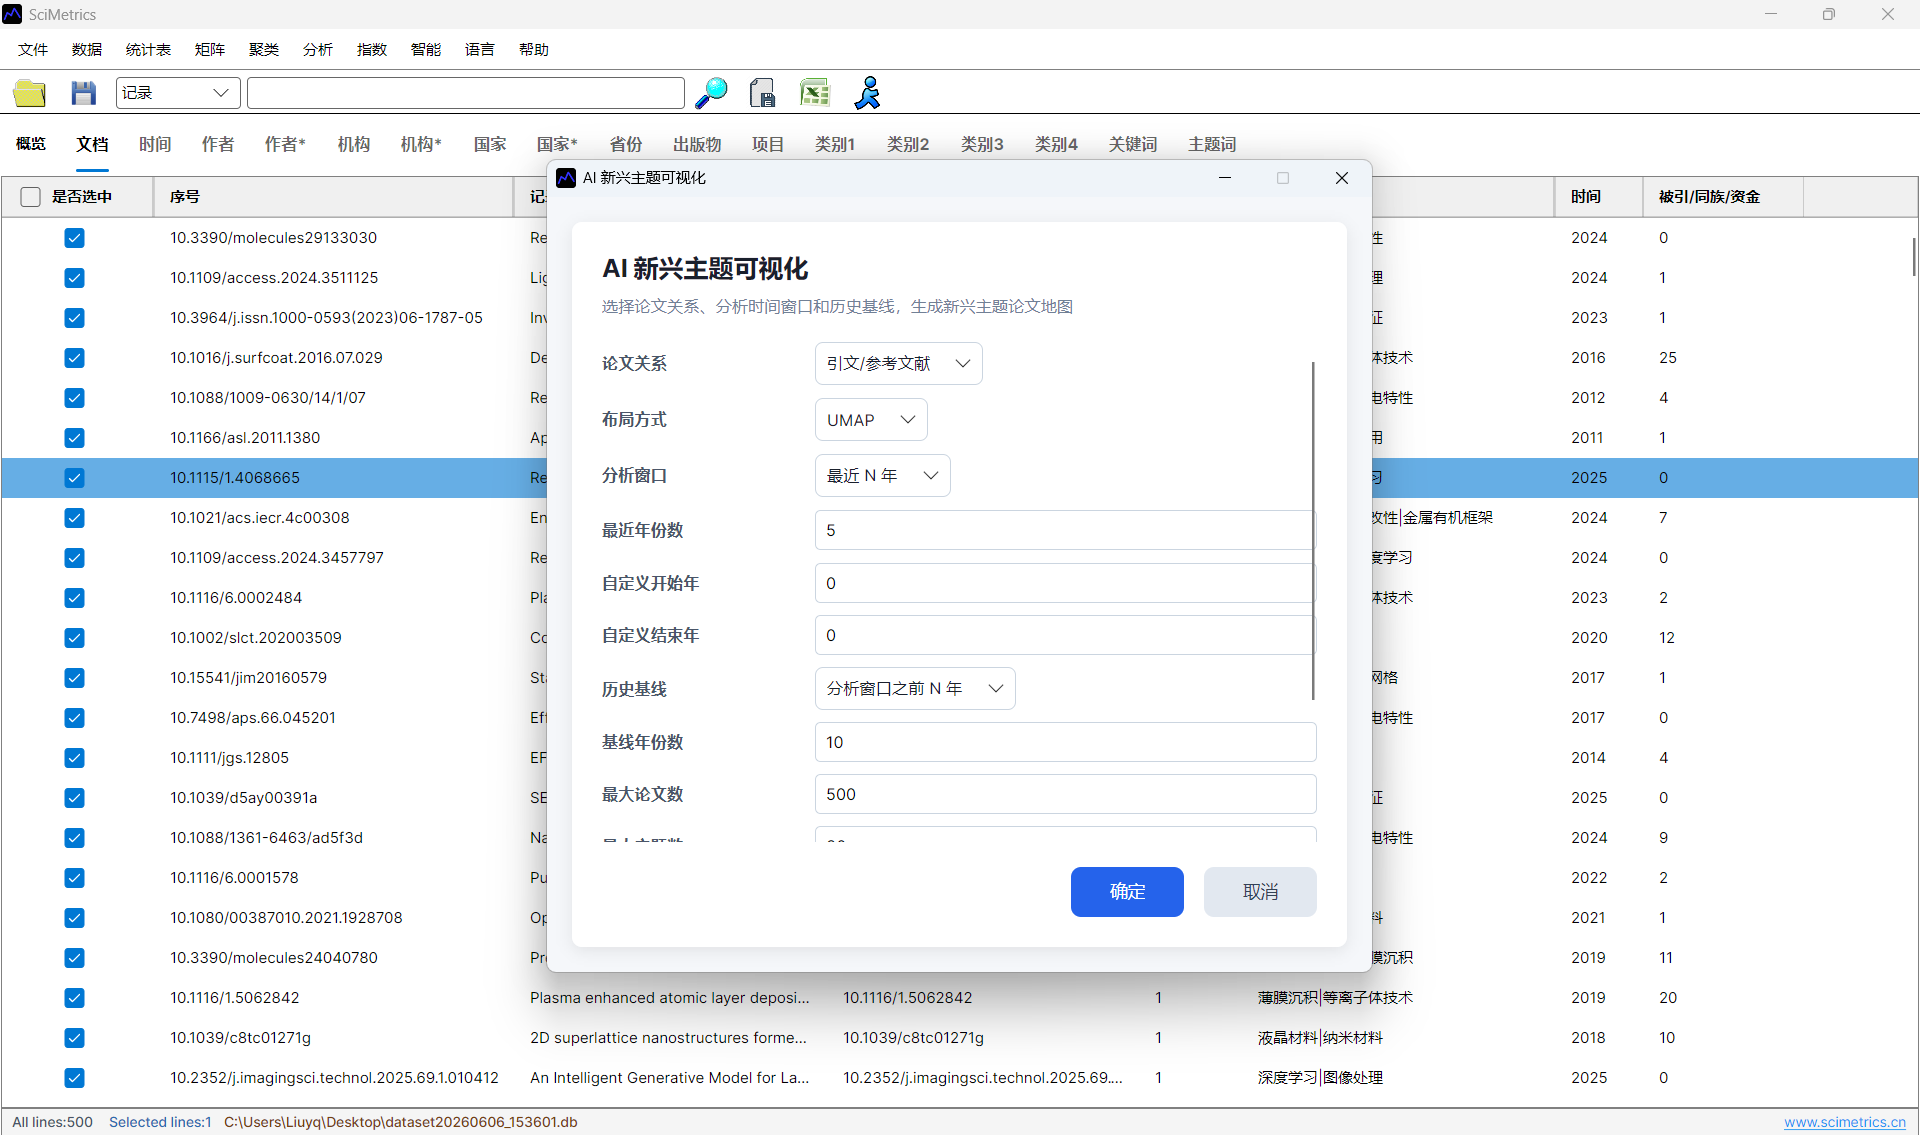
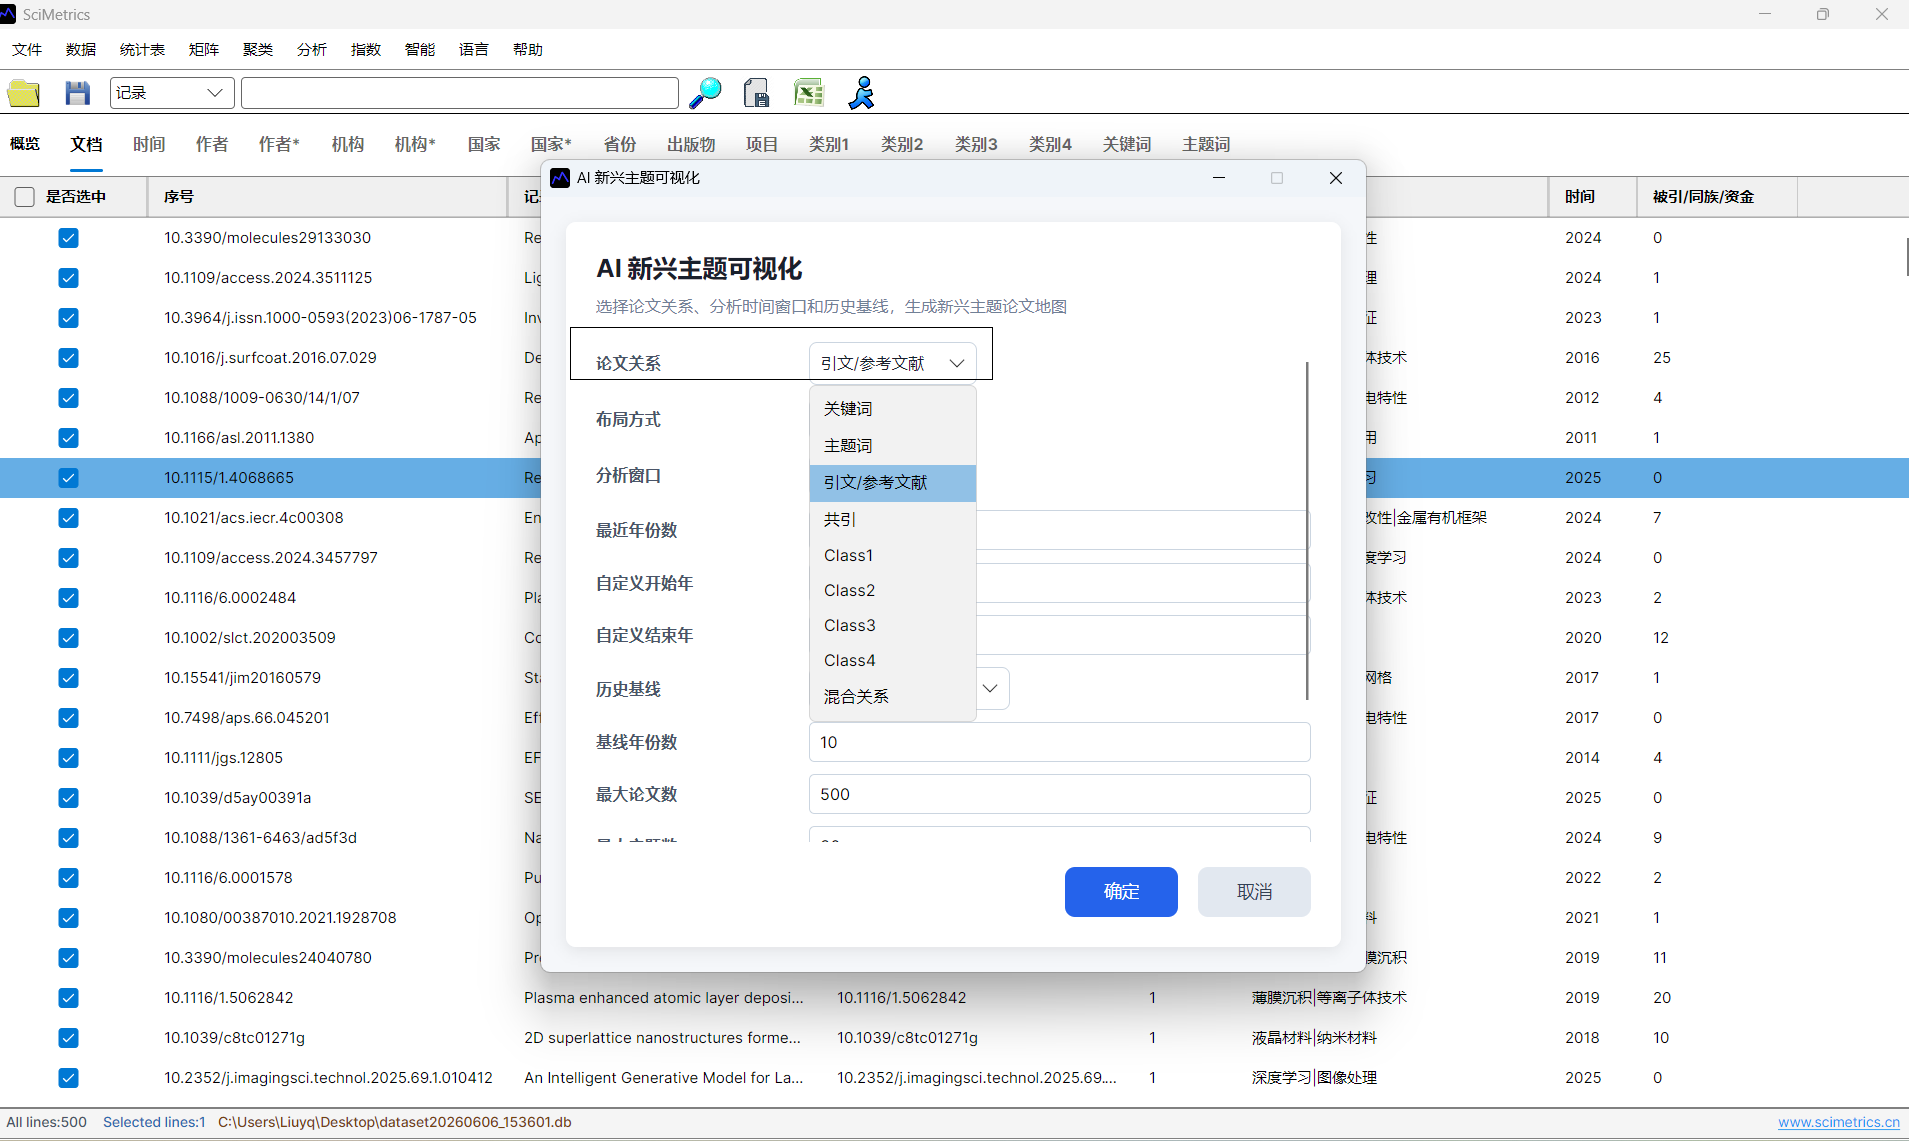
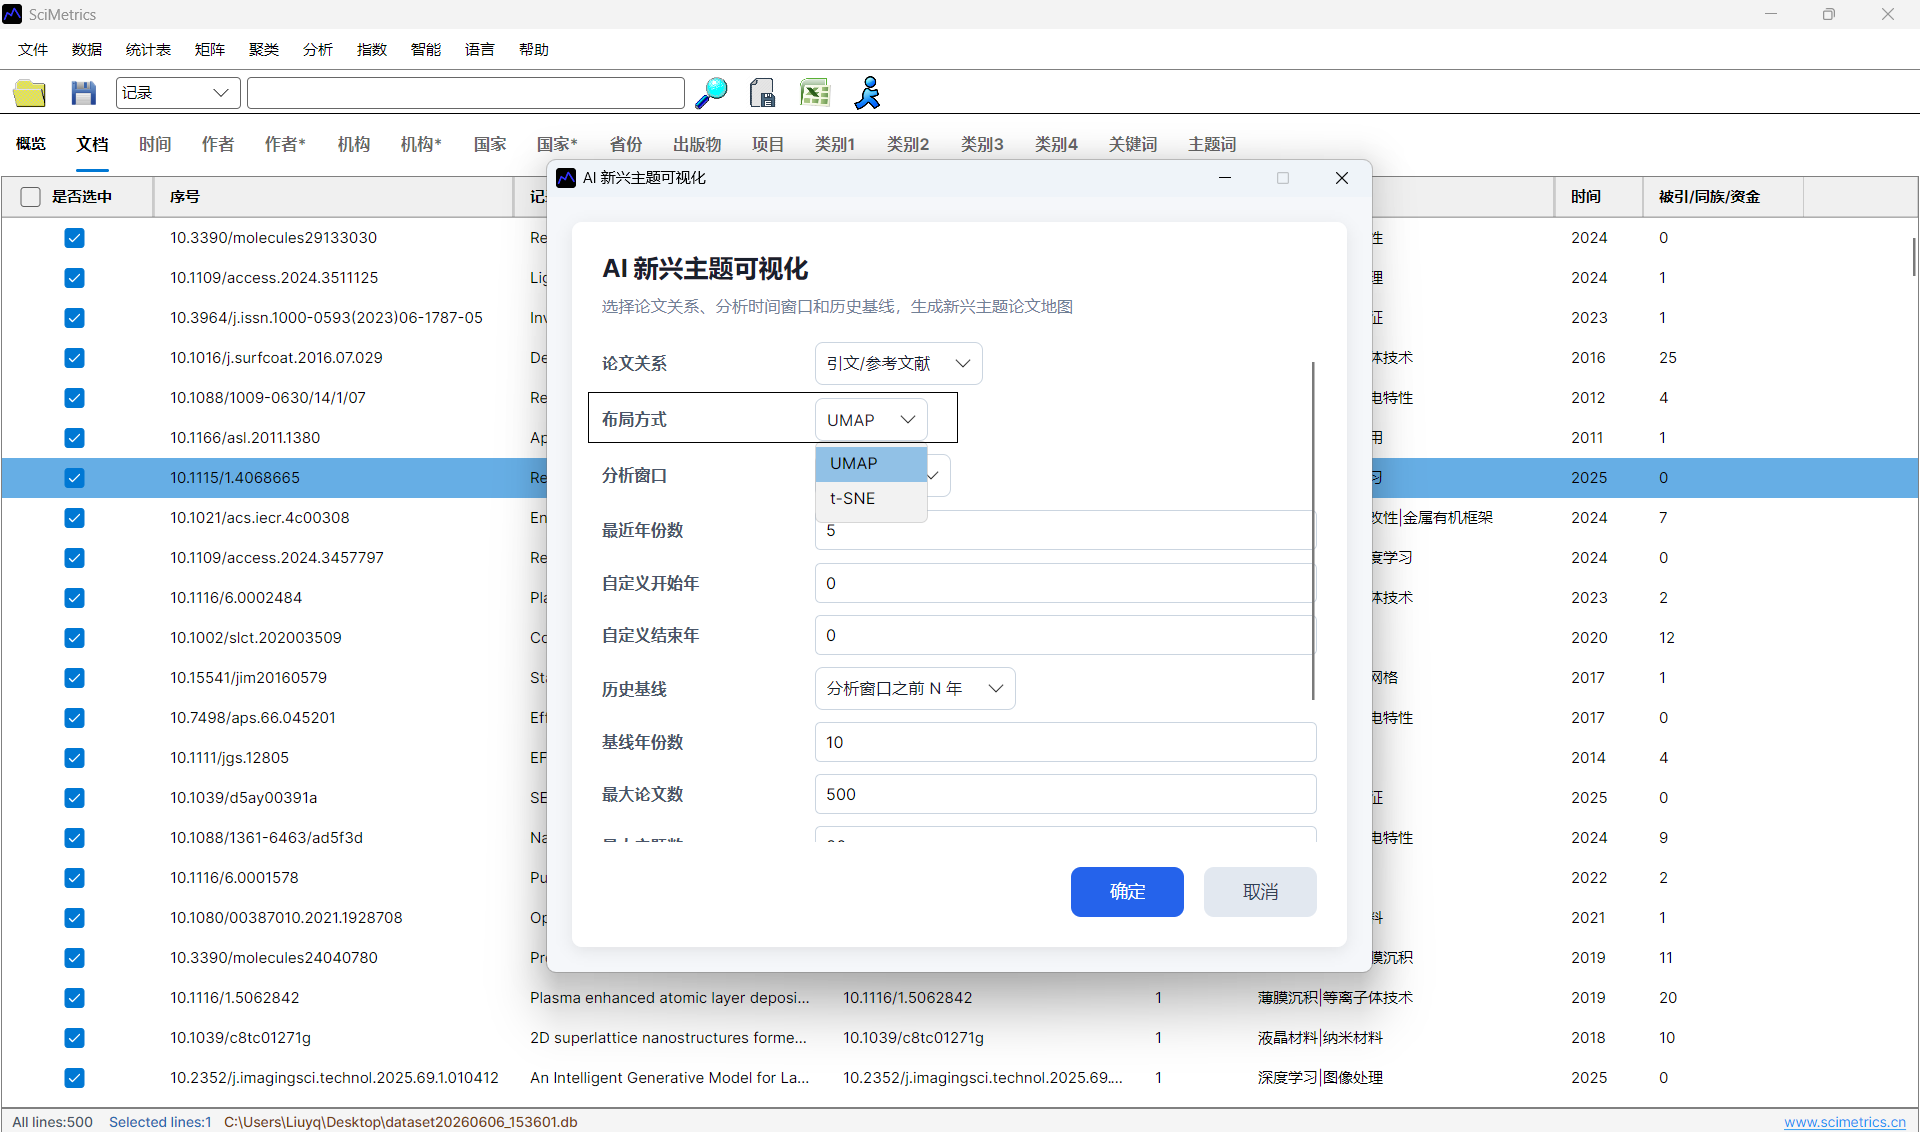
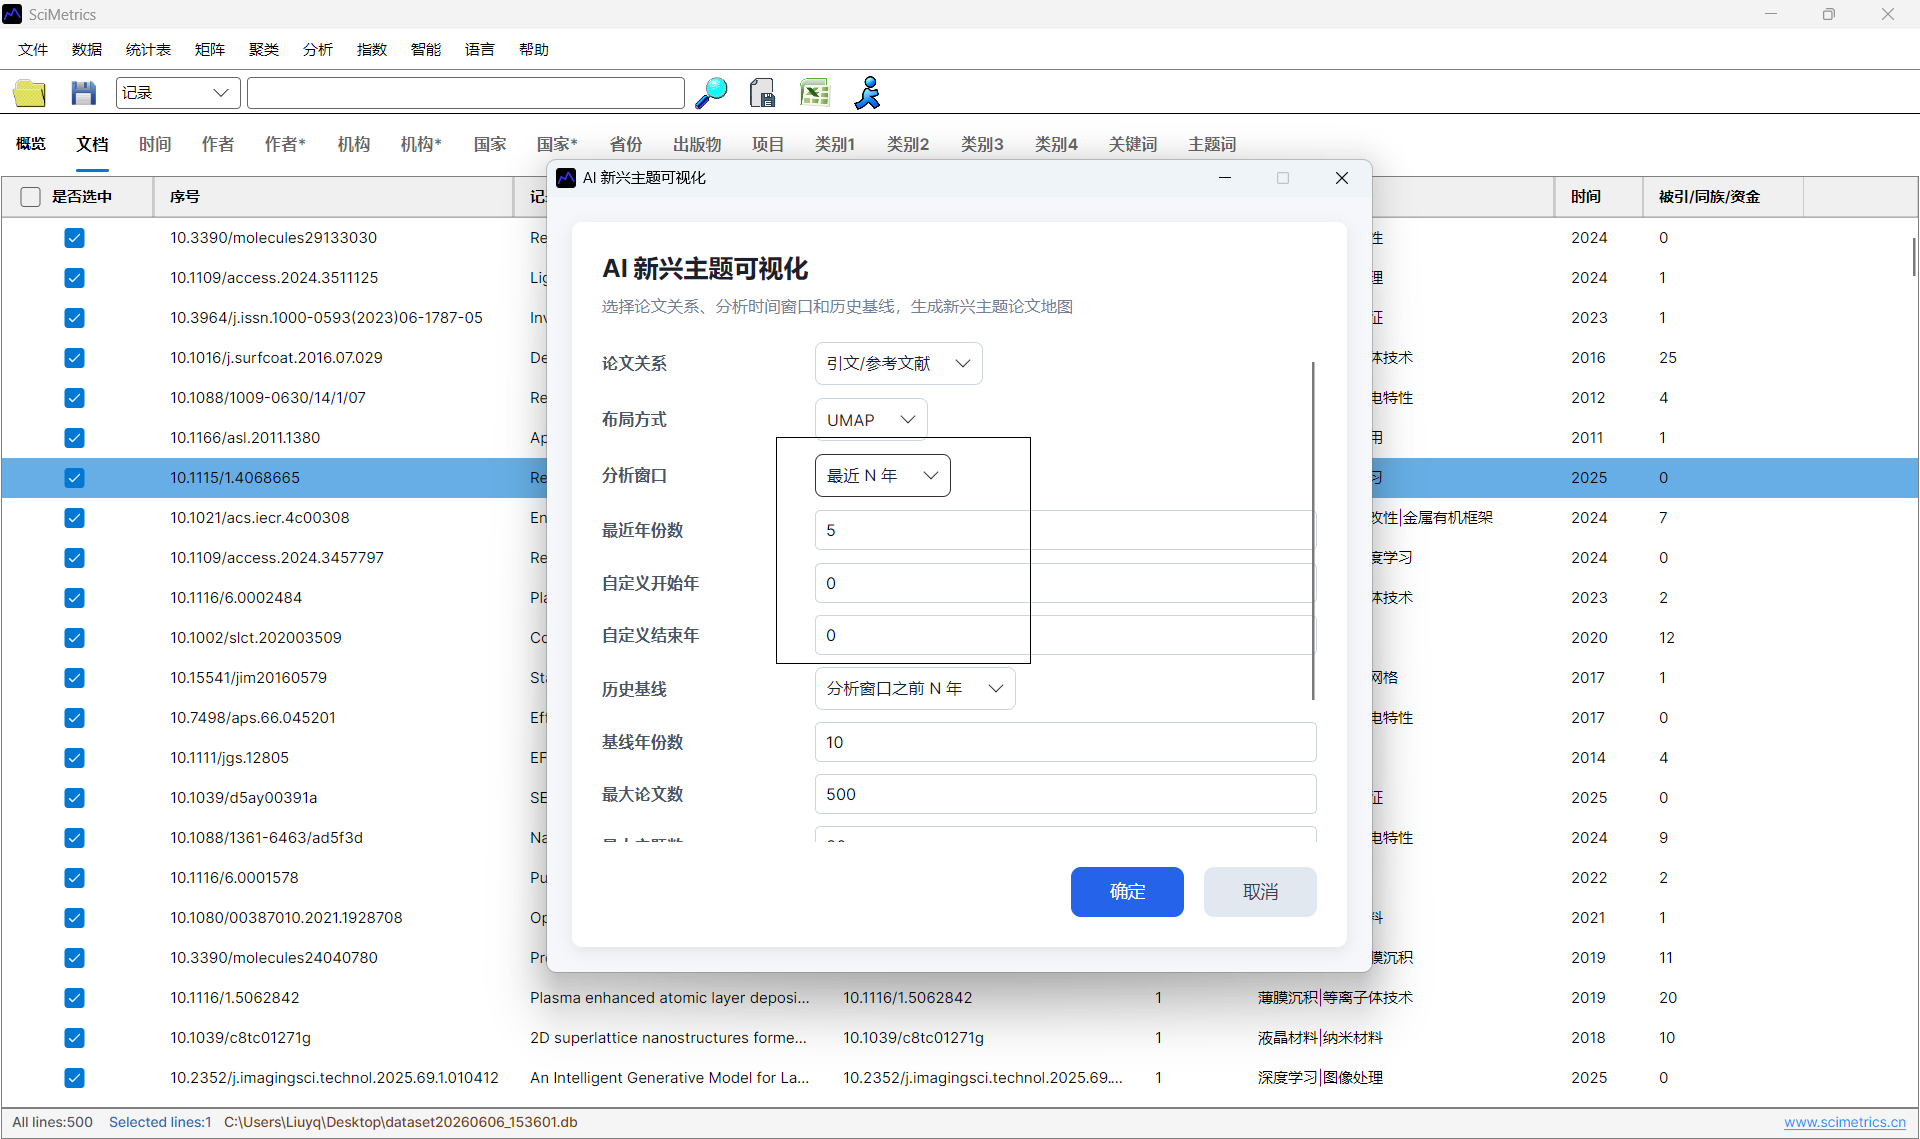
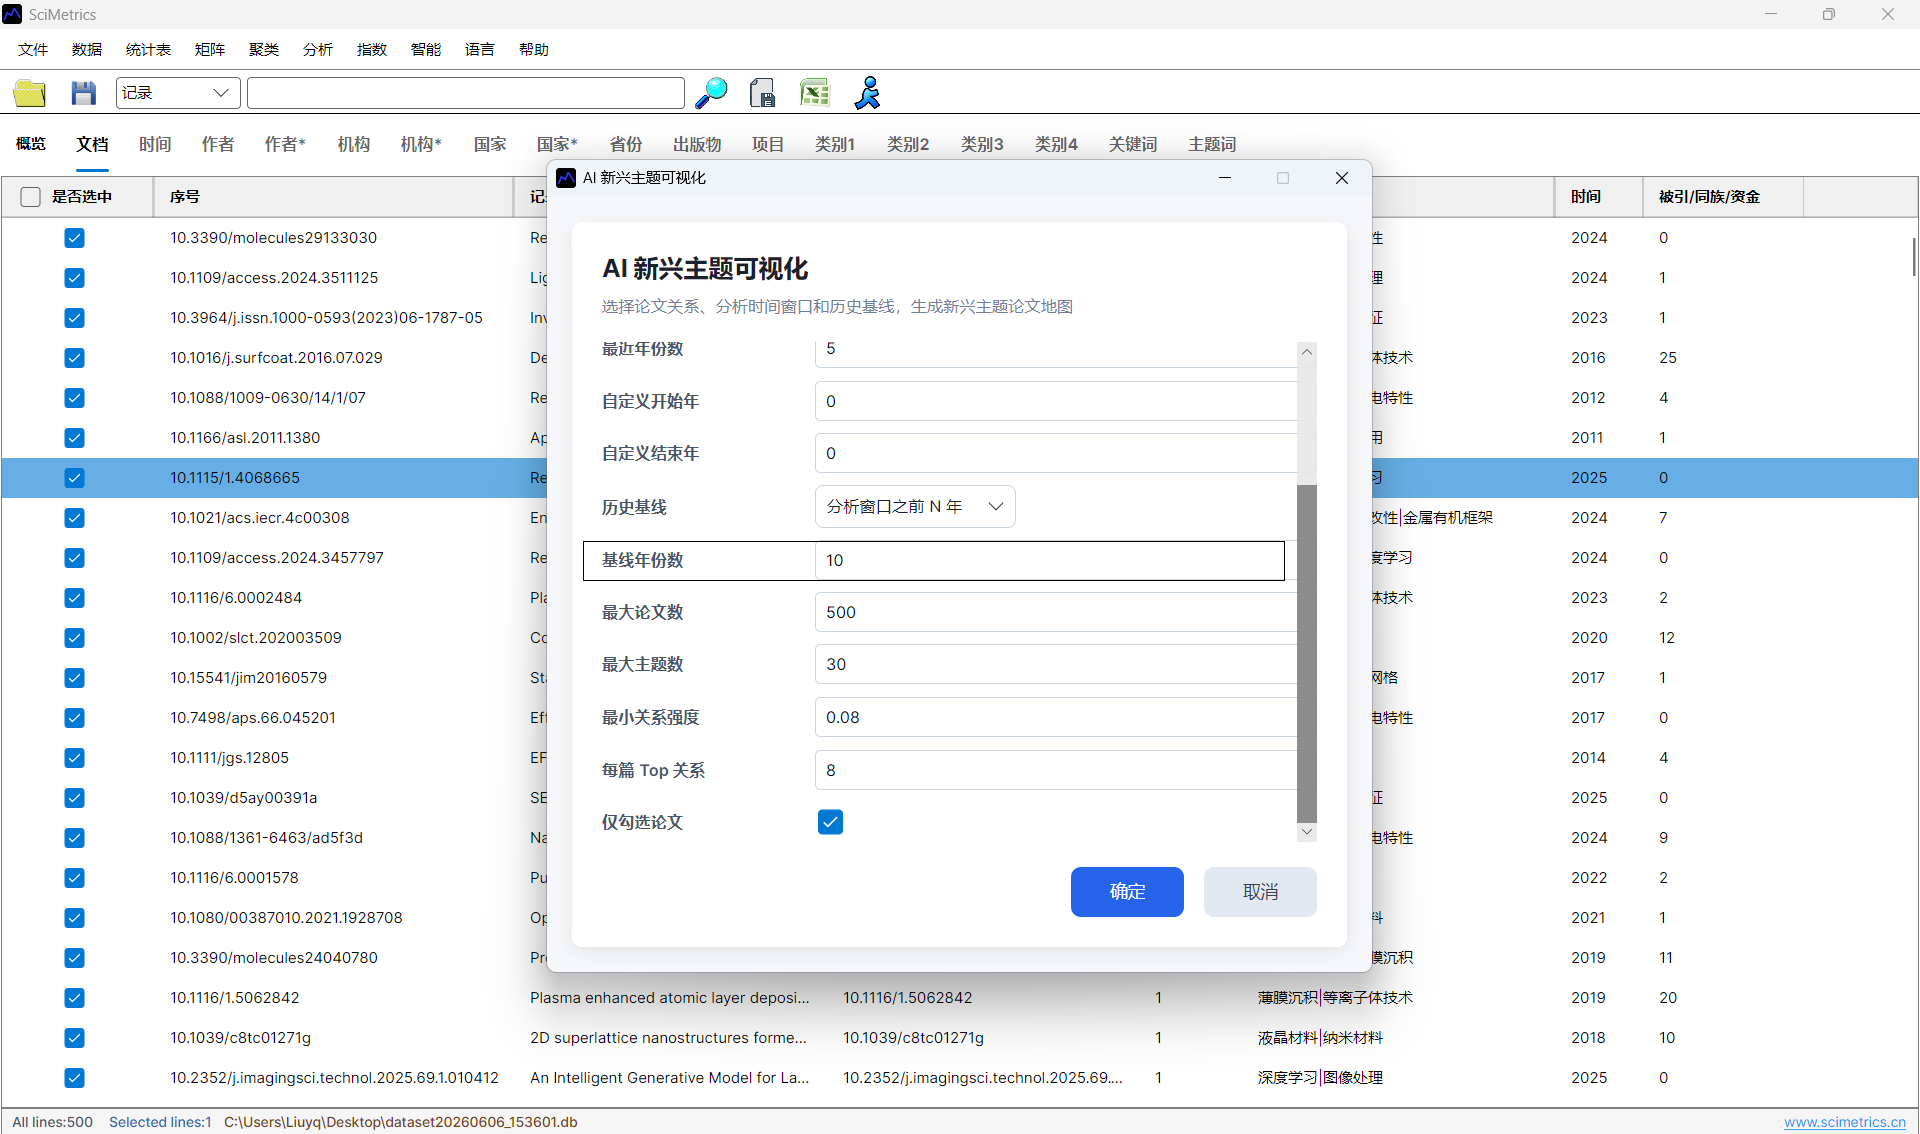
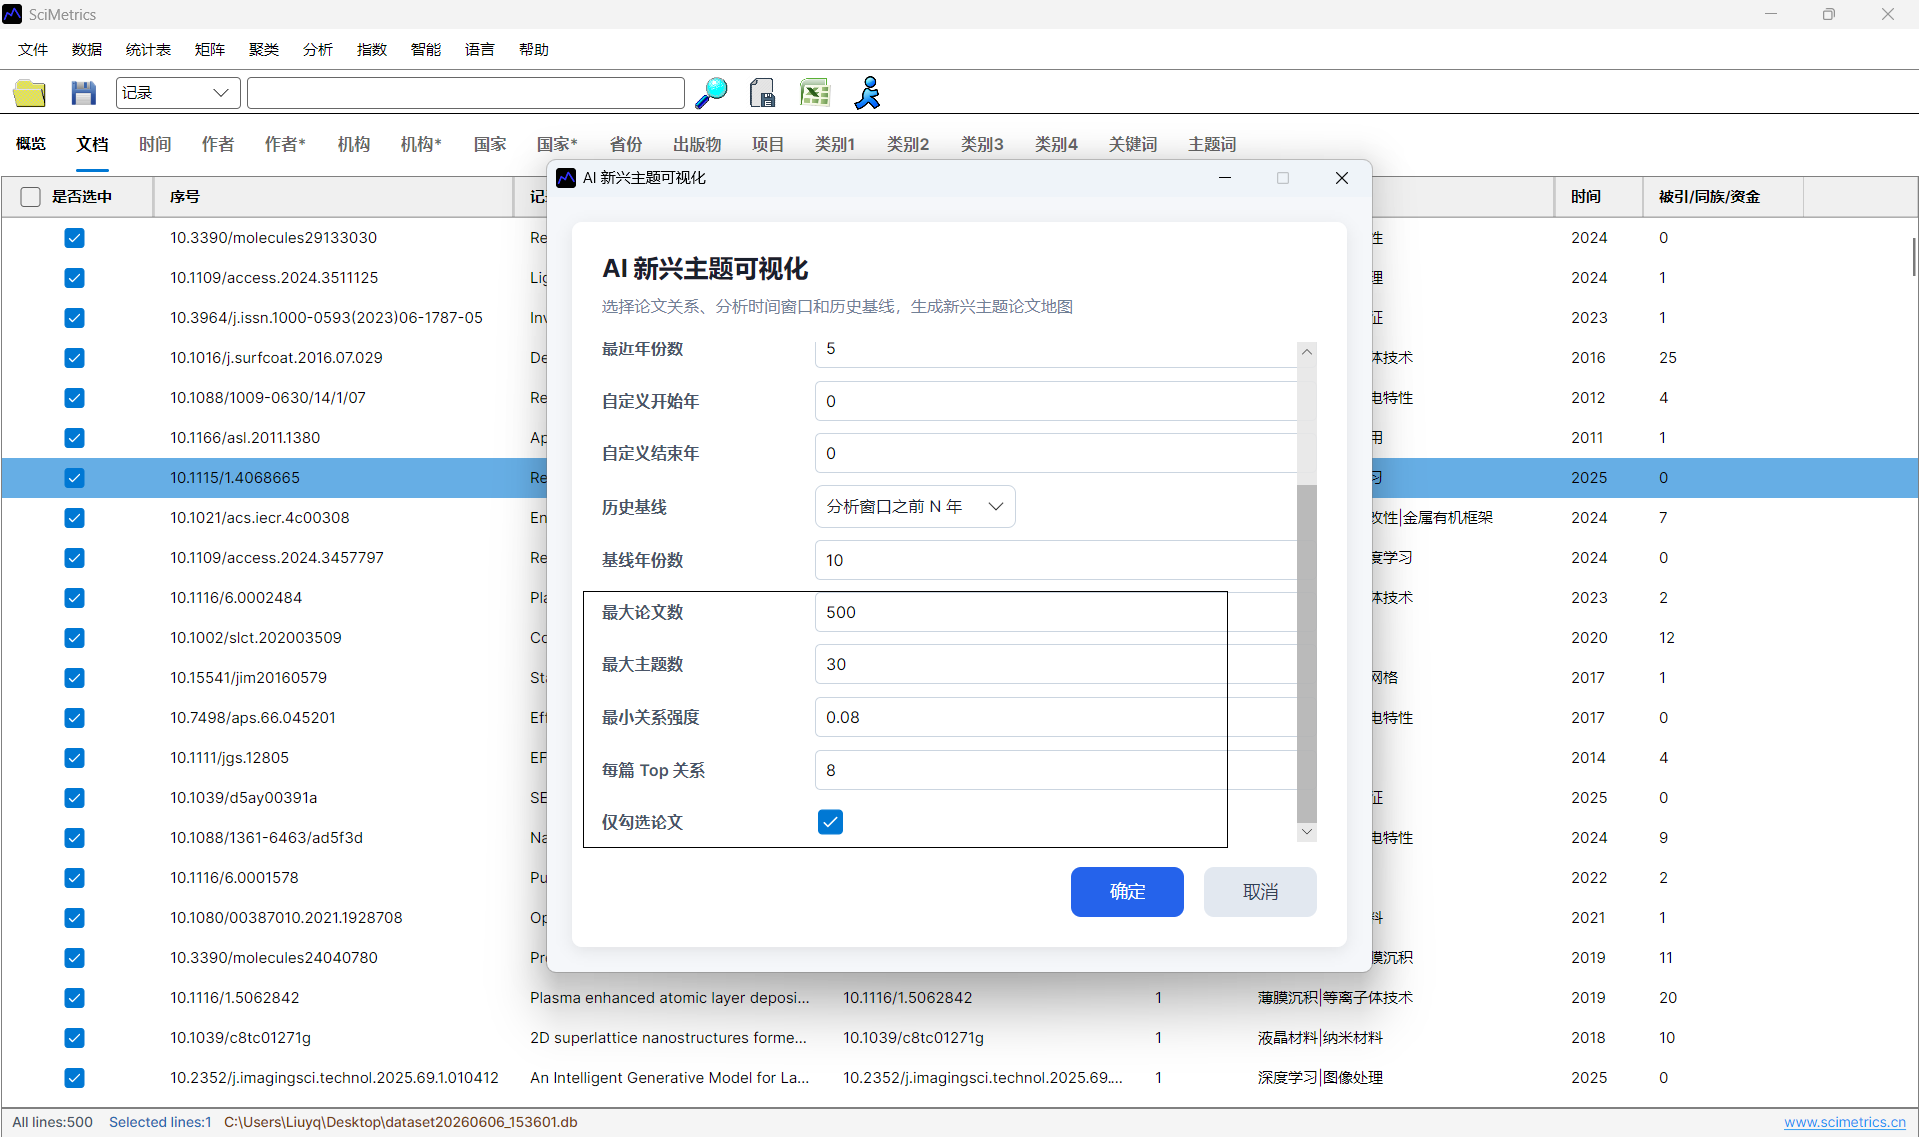
AI -> AI Topic -> AI Emerging Topic Visualization. - Choose the paper relation, layout method, analysis years, history baseline, maximum papers, and maximum topics.
- Generate the view and export the result if it will be used in a report.
Key Parameters
| Parameter | Guidance |
|---|---|
| Paper relation | Use references when citation links are complete; use keywords or topic terms when reference data is weak; use mixed relation for exploratory analysis. |
| Layout | UMAP is recommended for most datasets; t-SNE can be used to inspect local neighborhoods. |
| Analysis window | Use recent years when the goal is to find emerging topics. Fast-moving fields often use 3-5 years; stable fields can use 5-10 years. |
| History baseline | Use the years before the analysis window to estimate novelty against prior work. |
| Maximum papers and topics | Reduce the limits when the graph becomes crowded or when the result is prepared for presentation. |
Reading the View
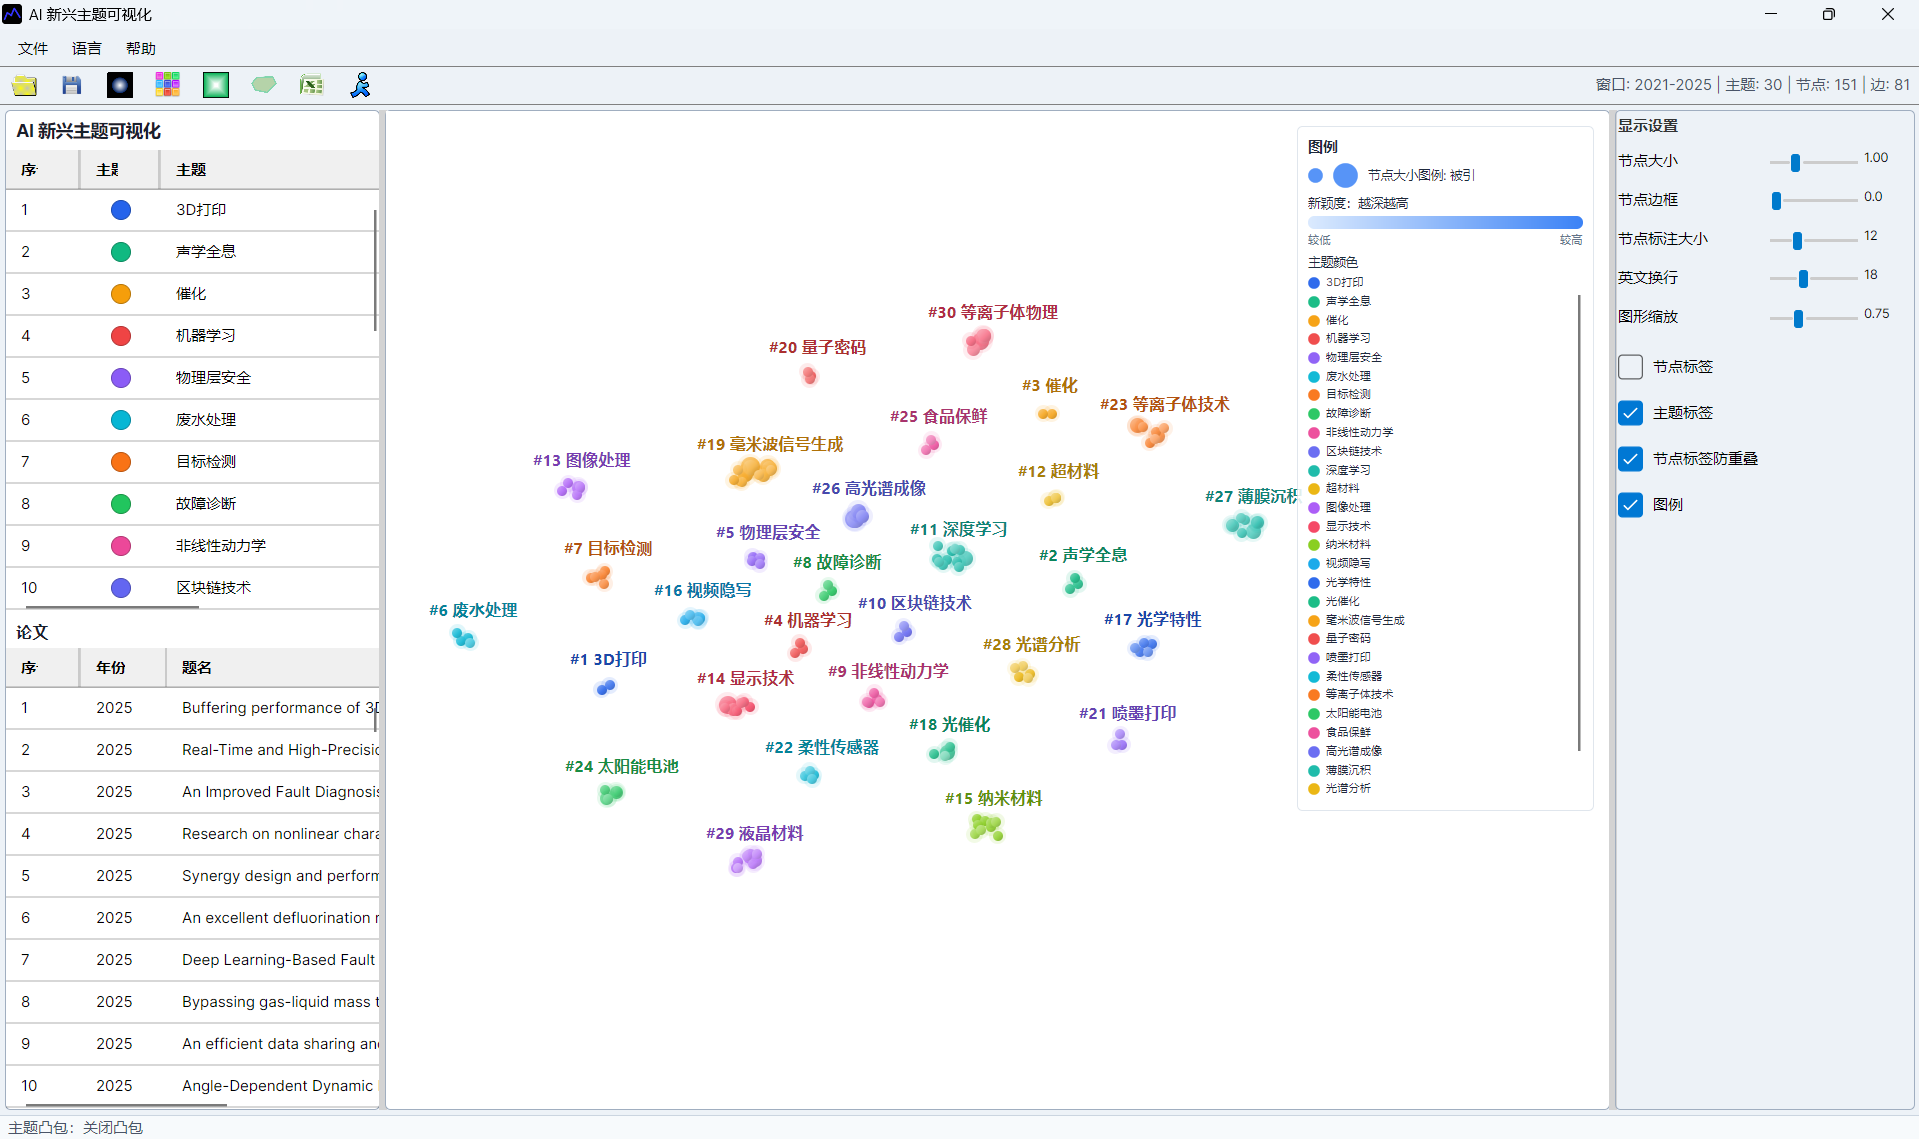
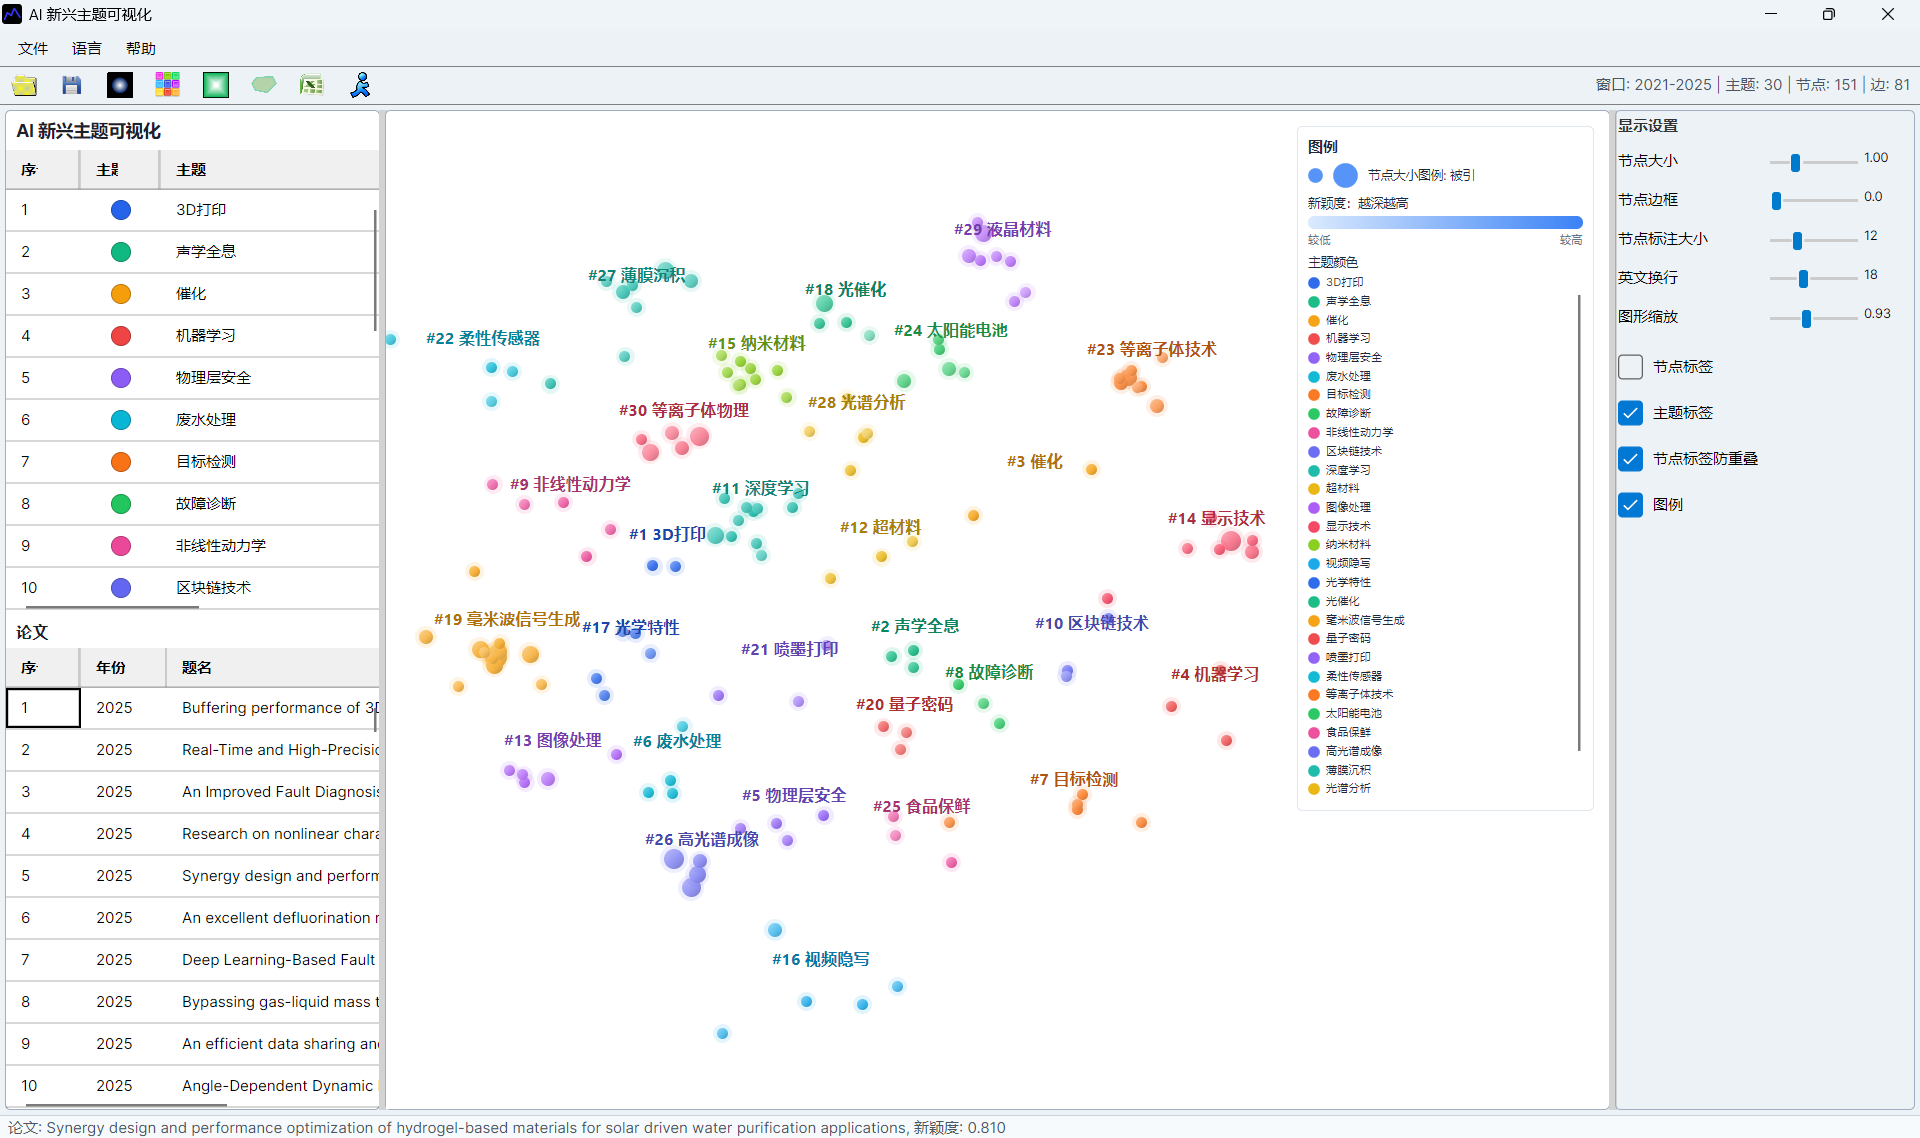
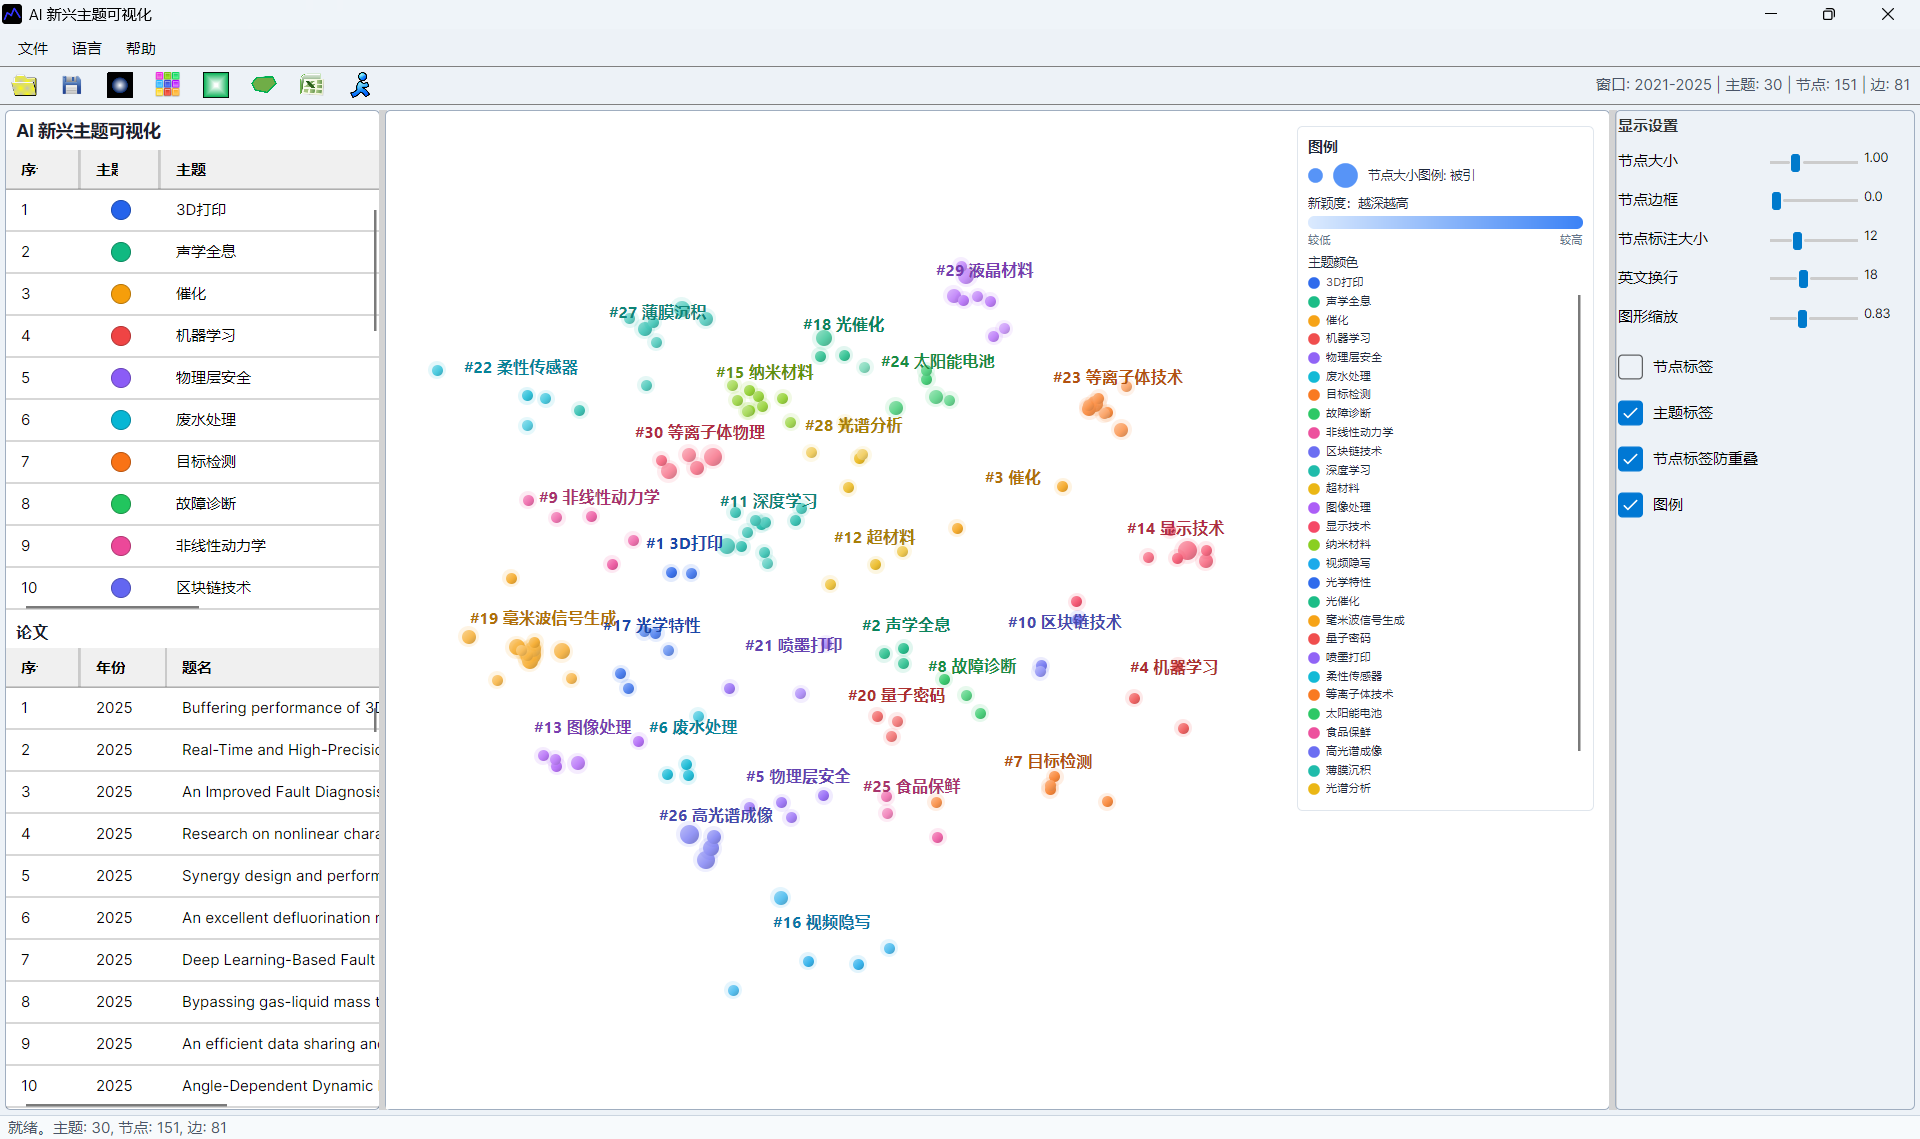
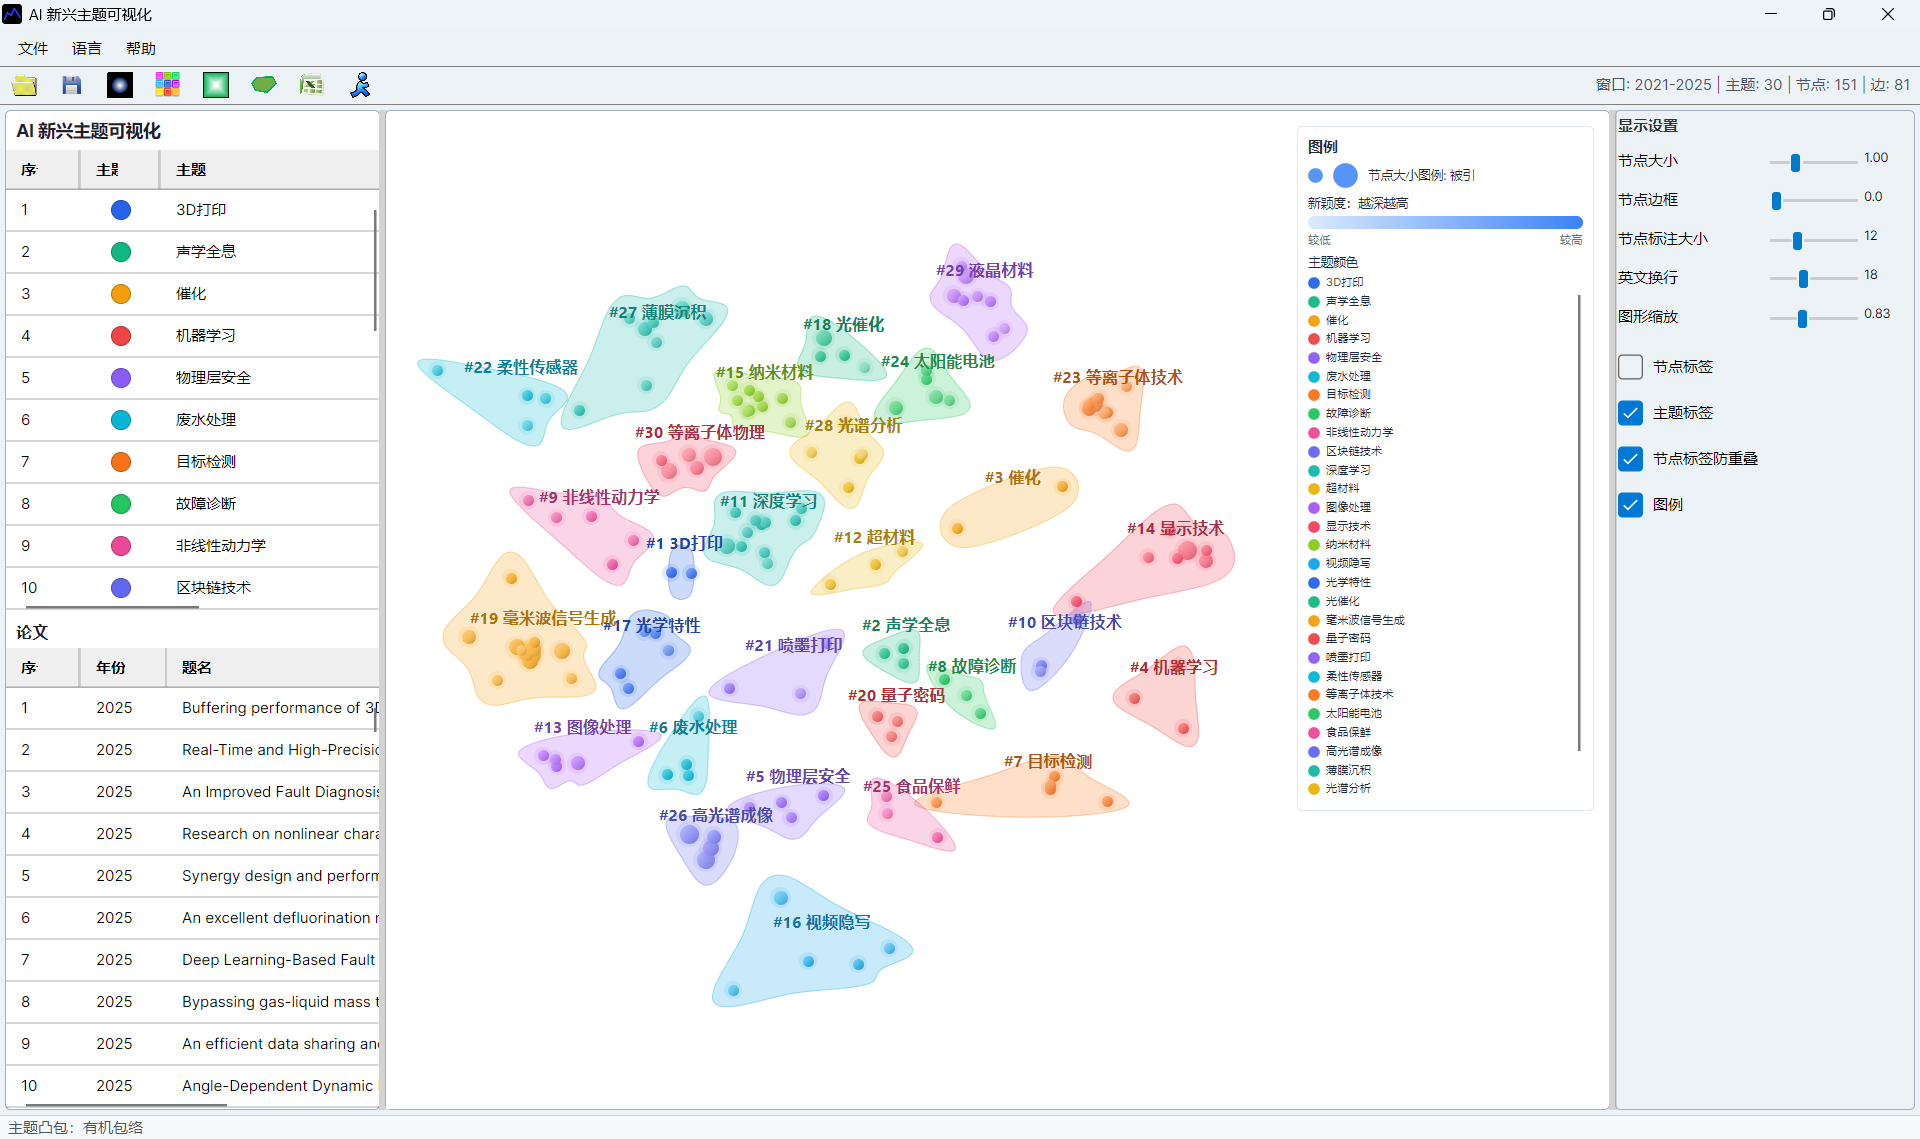
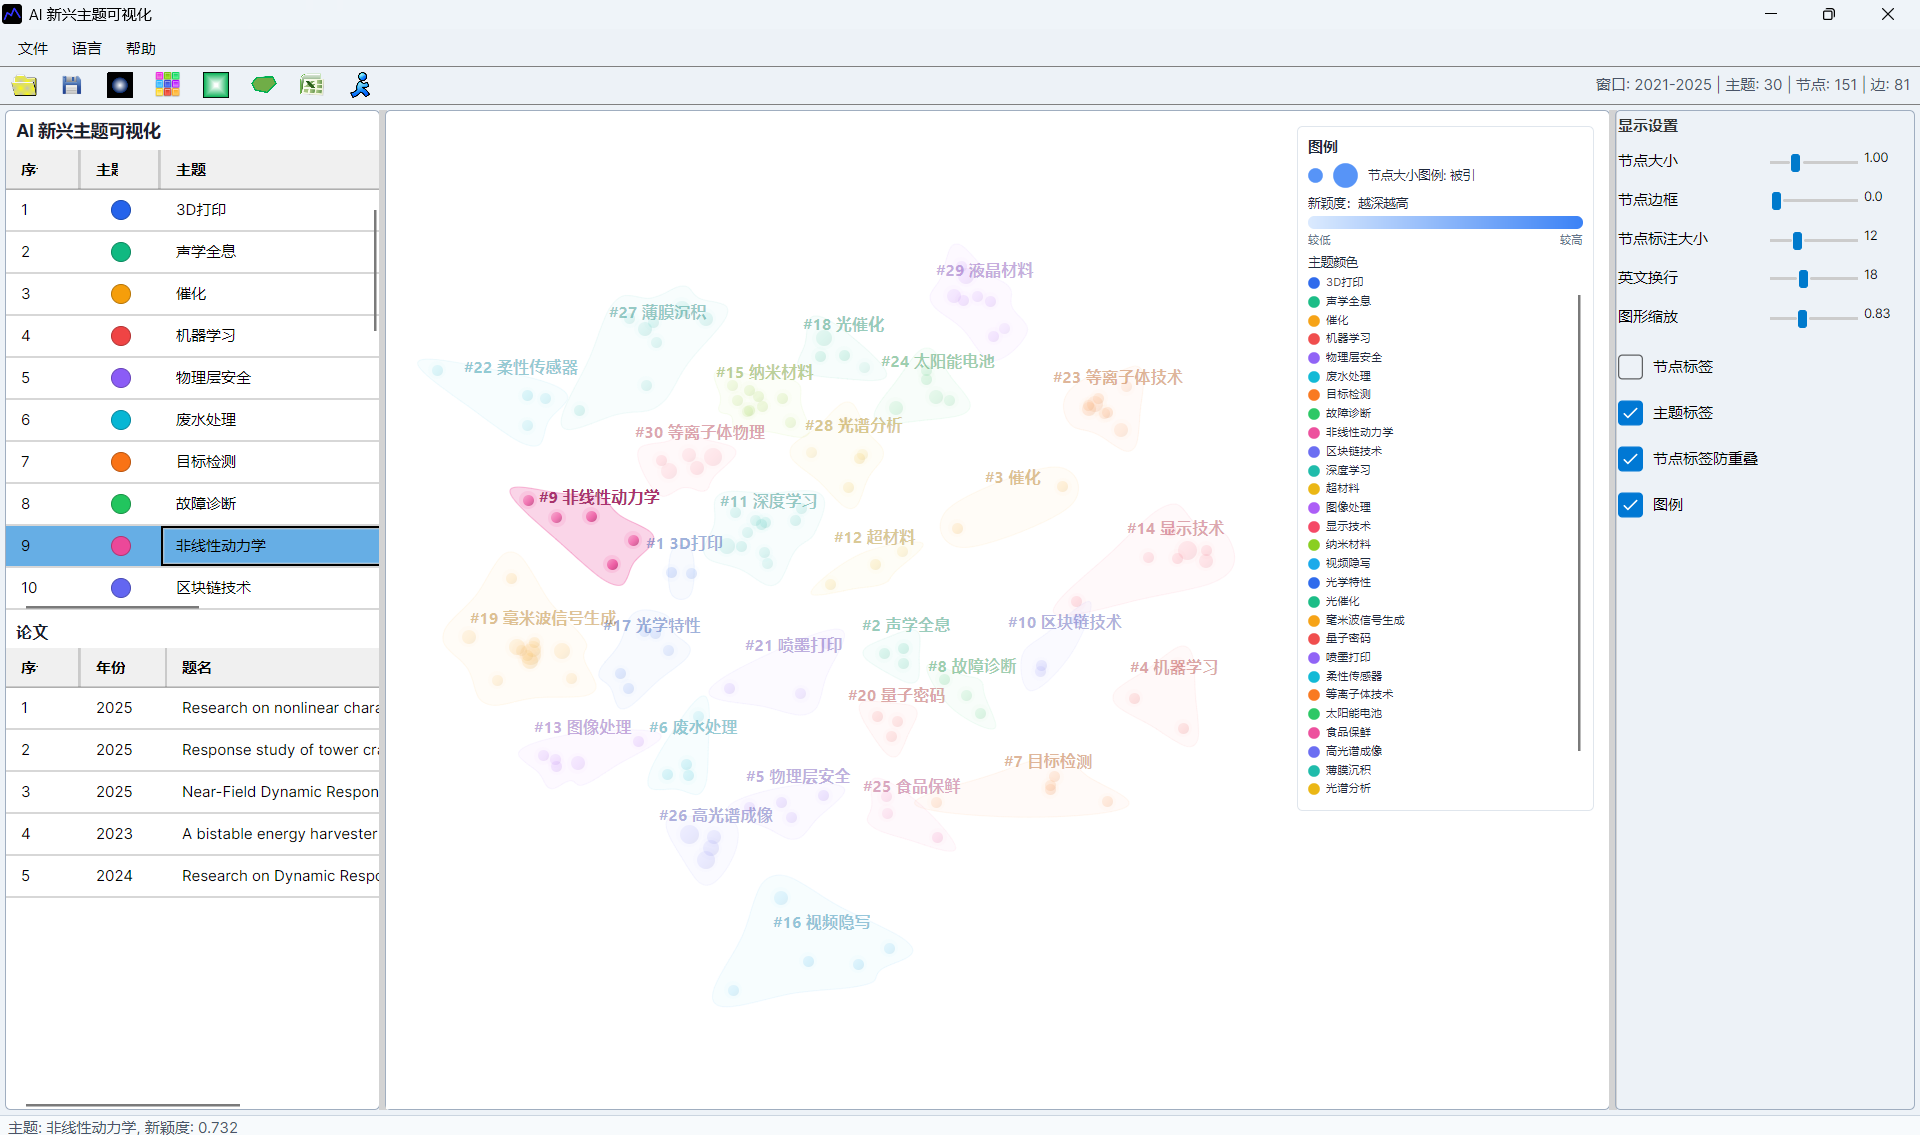
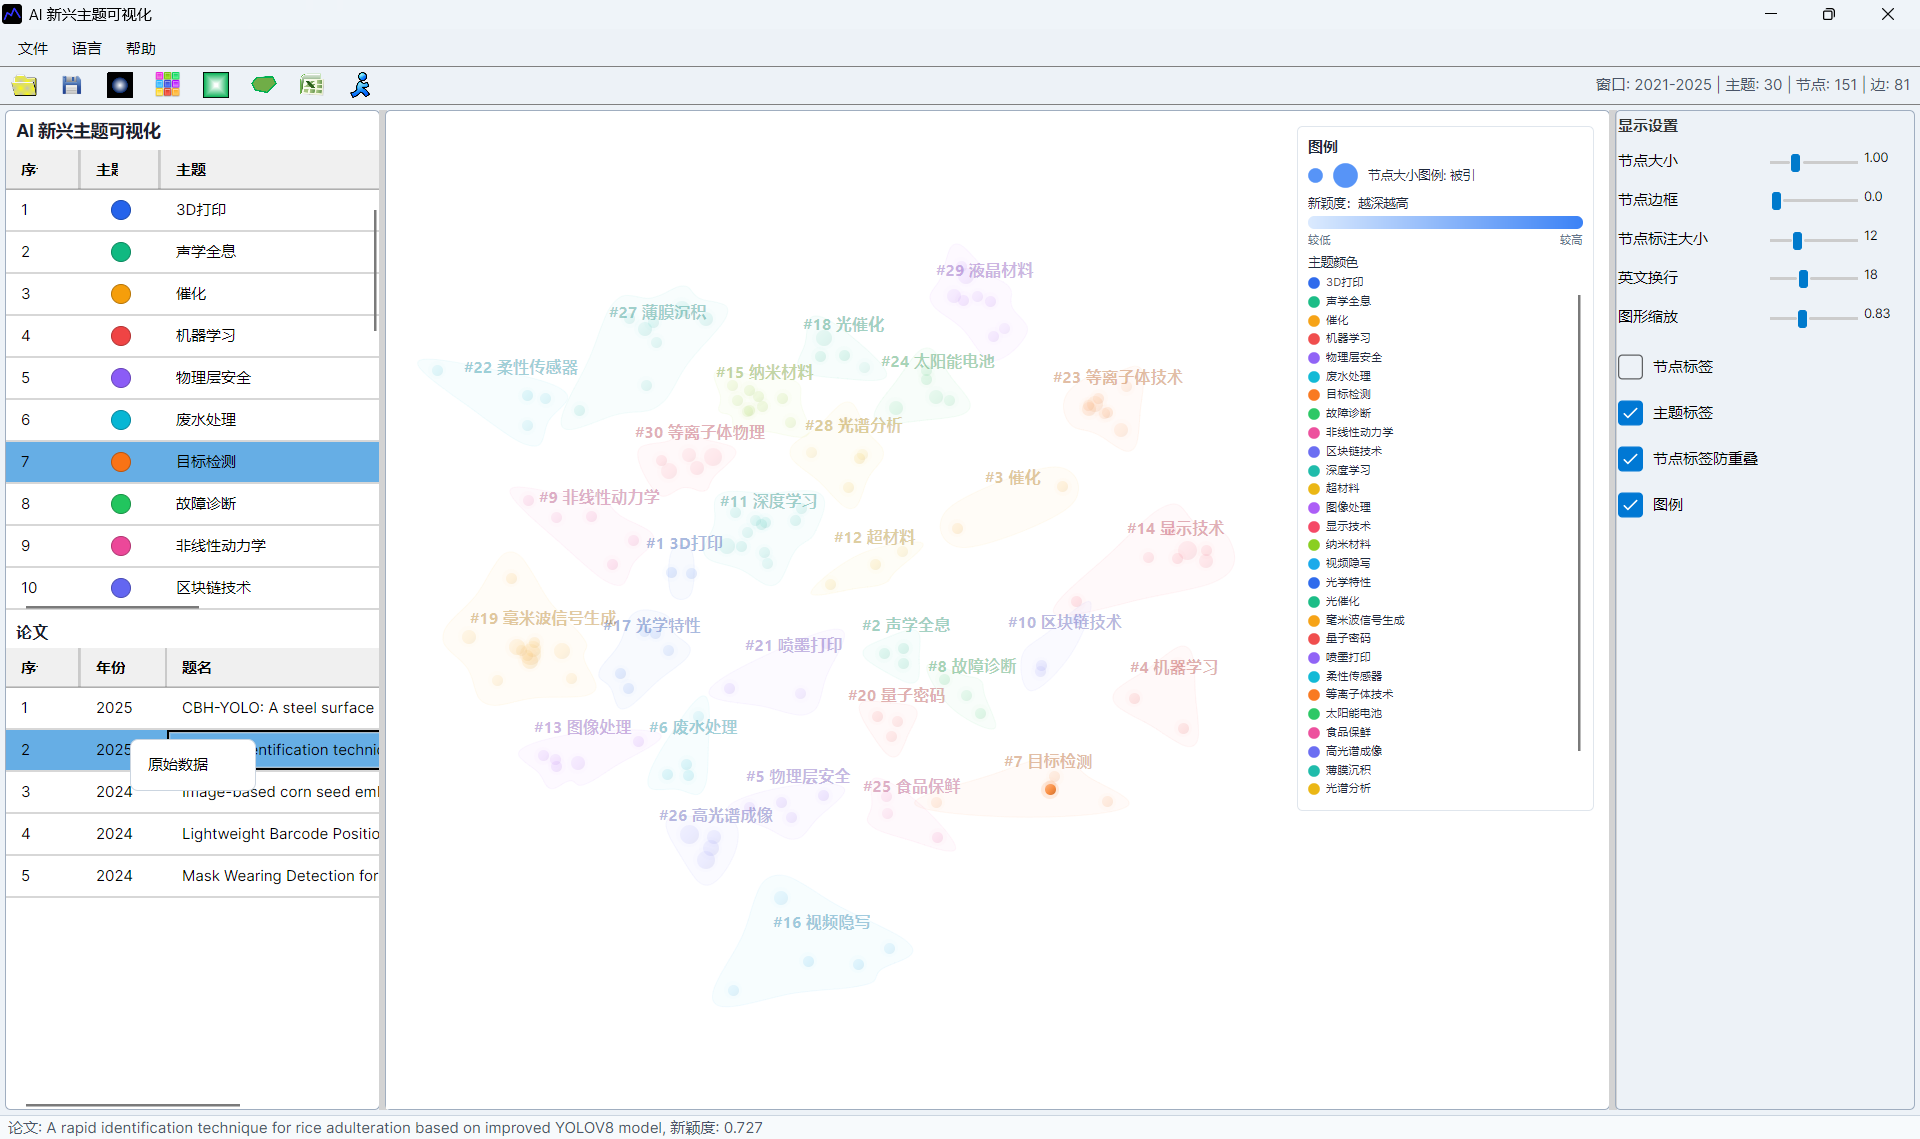
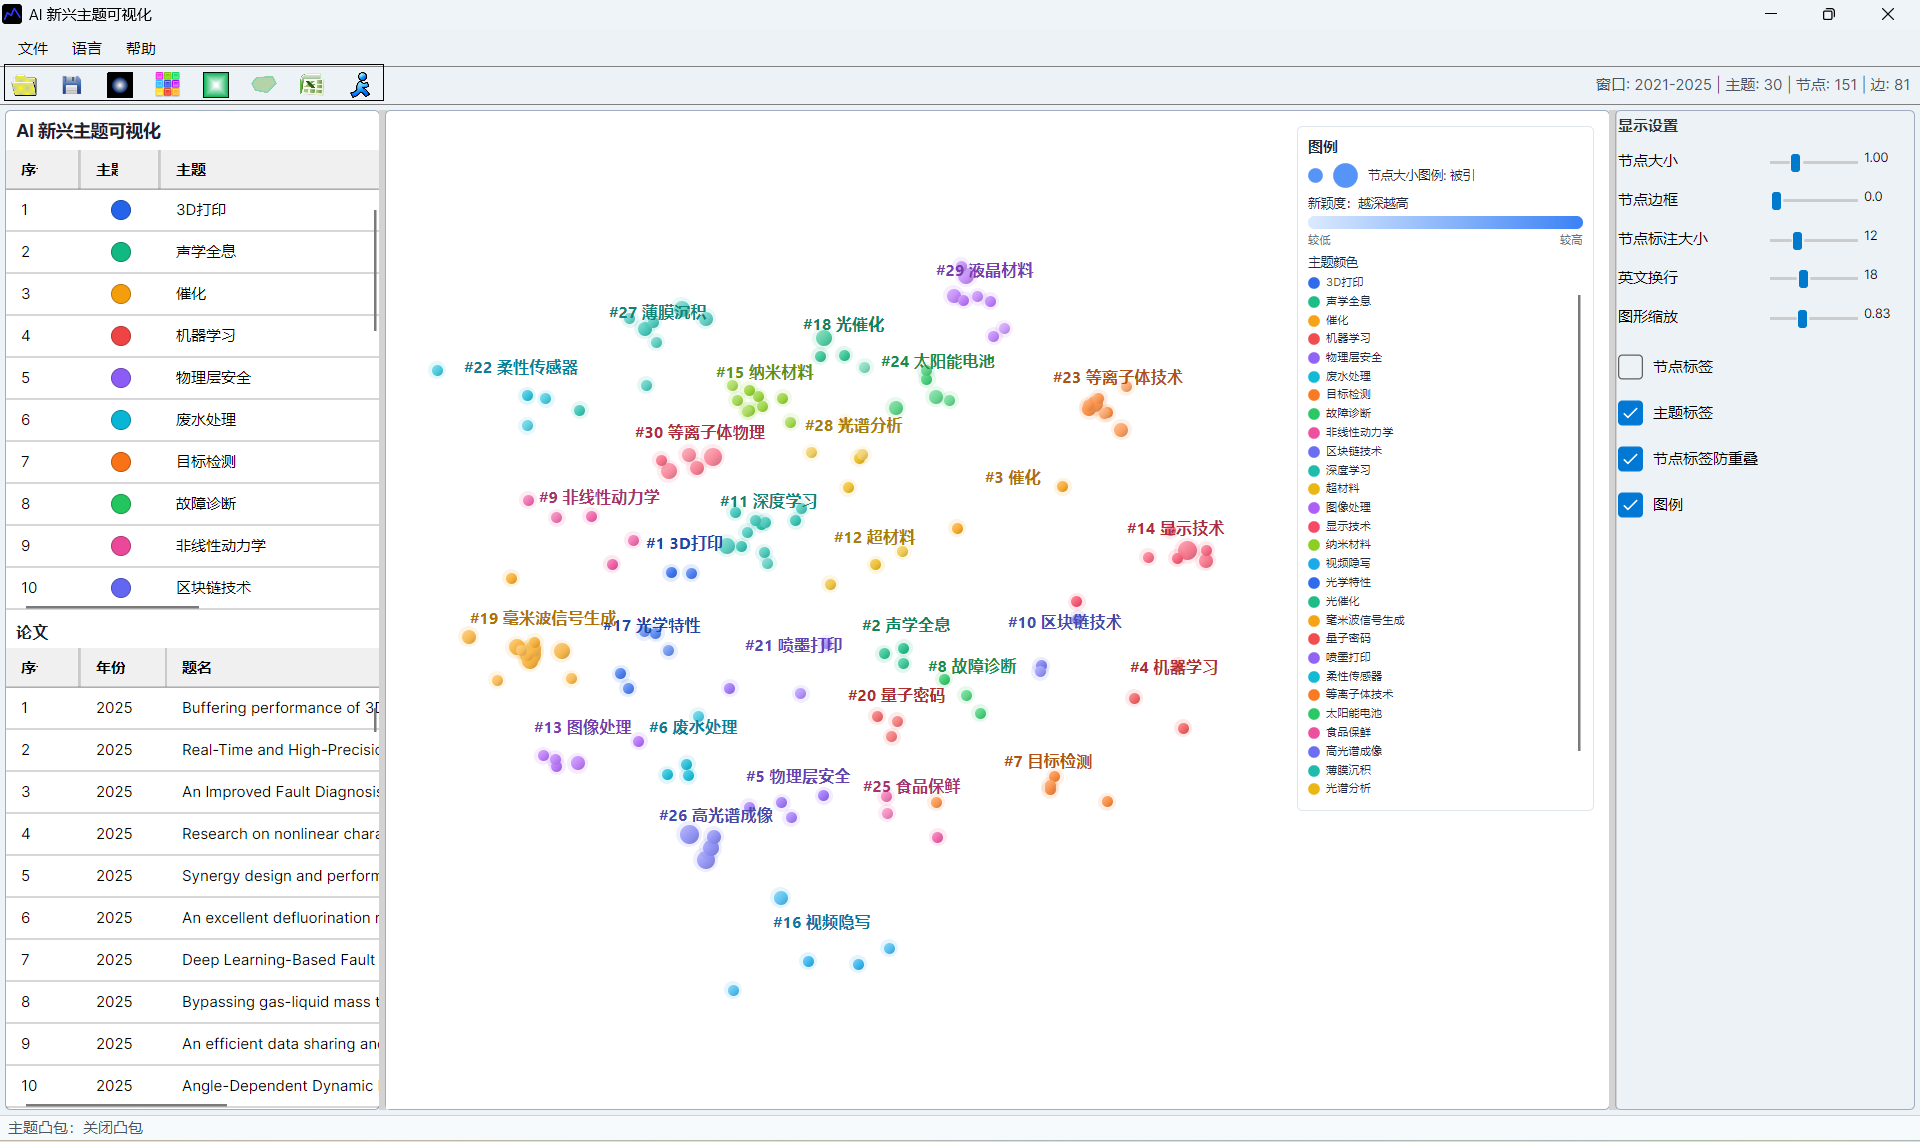
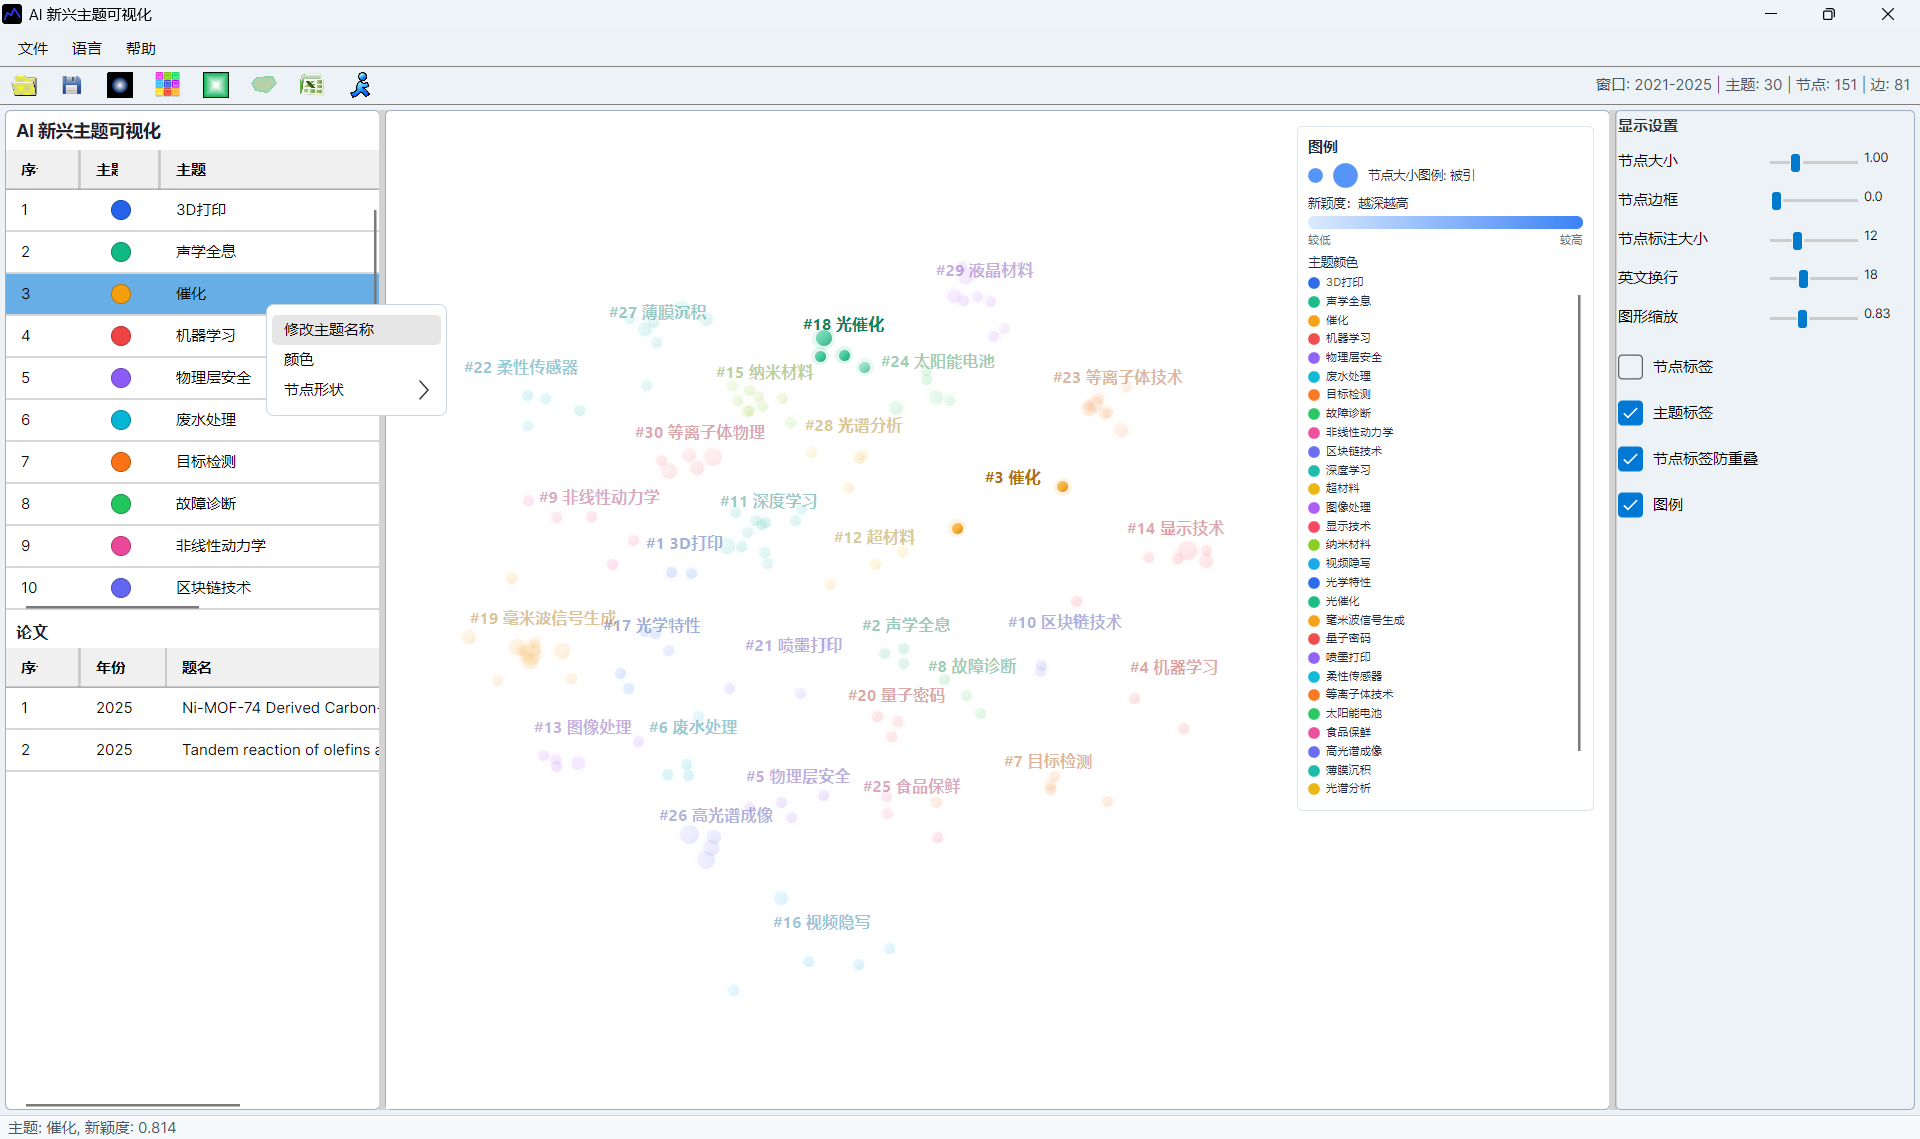
Each node is a paper. Node size usually represents citation impact, color intensity represents novelty, and topic labels mark the AI topic clusters. A compact cluster indicates papers that are close by relation evidence; a separated cluster may indicate a distinct research direction.
When interpreting results, combine the visual position with source papers. A visually novel cluster should be checked against titles, abstracts, years, and representative references before it is treated as a real frontier.
Topic Hulls and Two-Node Topics
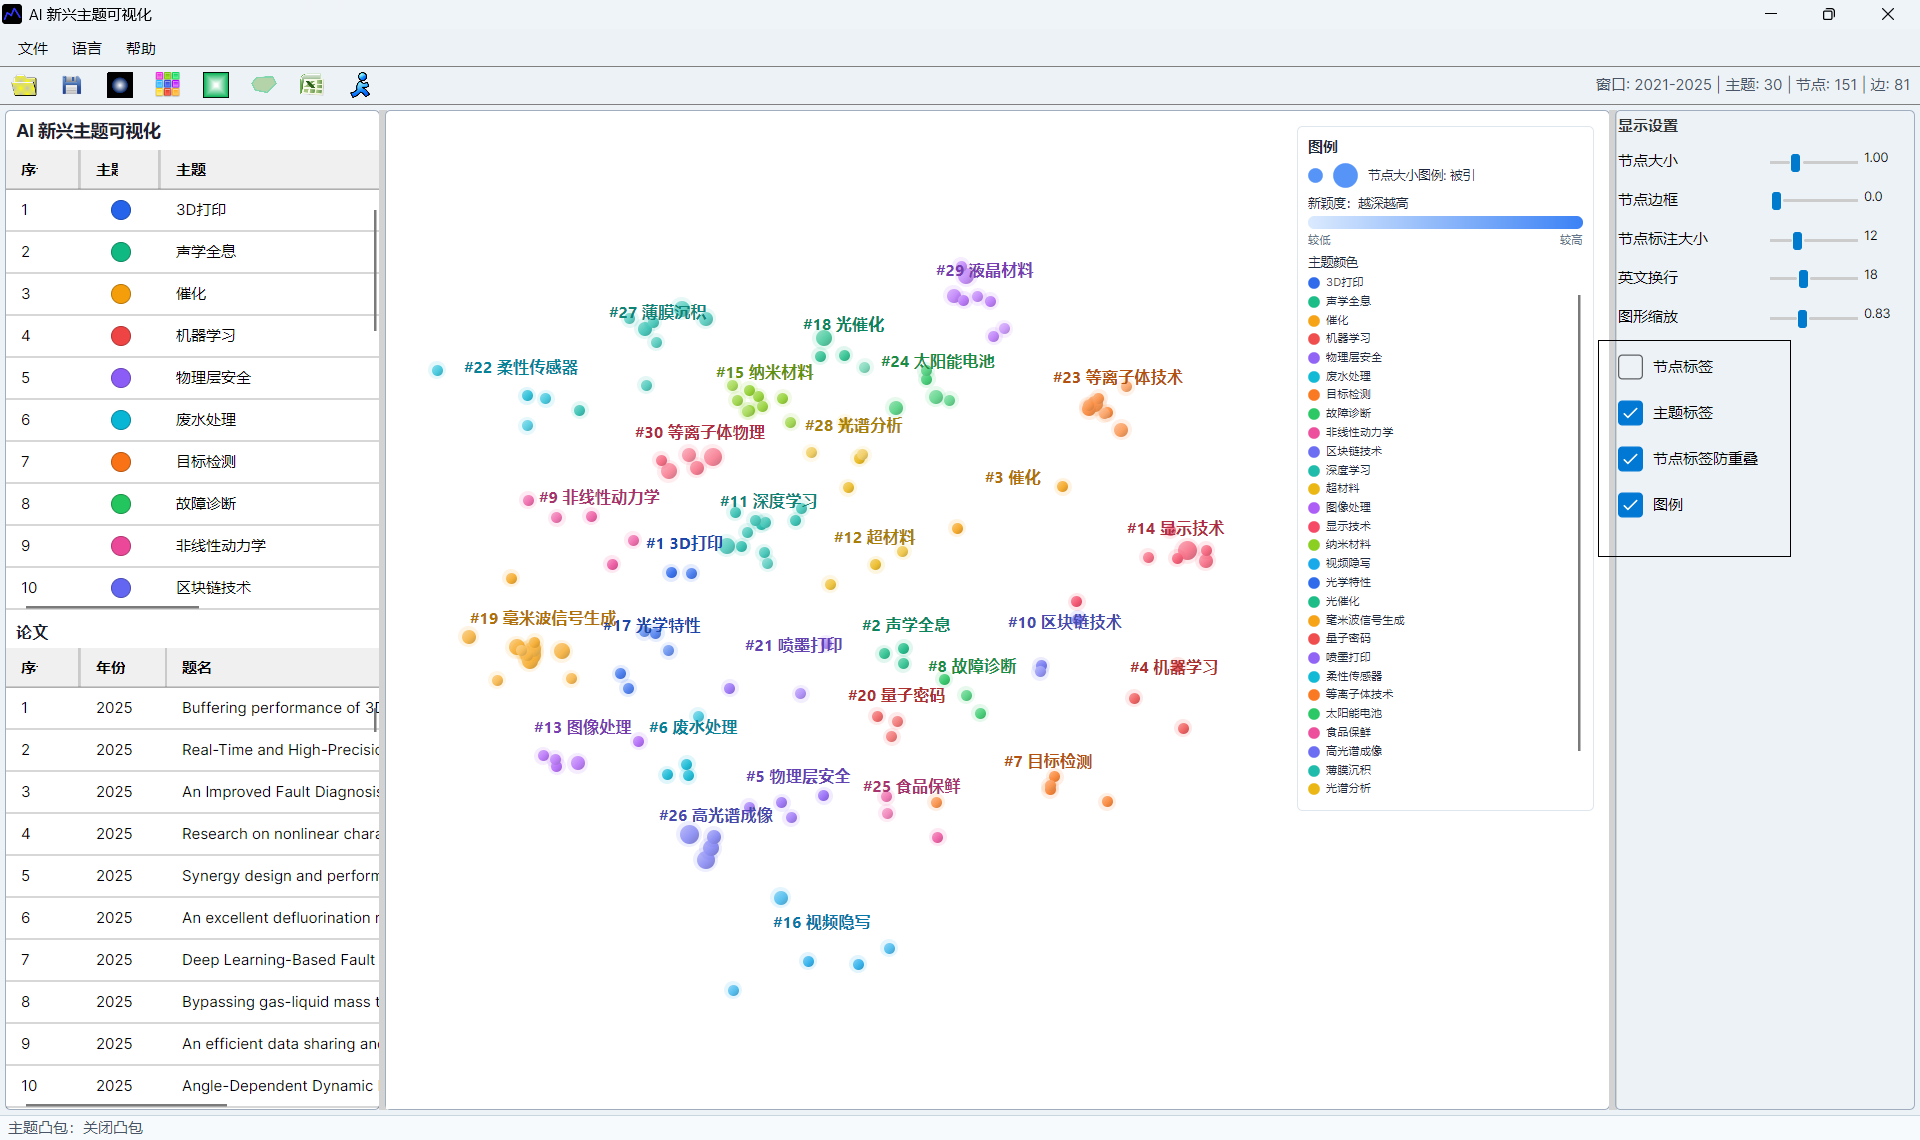
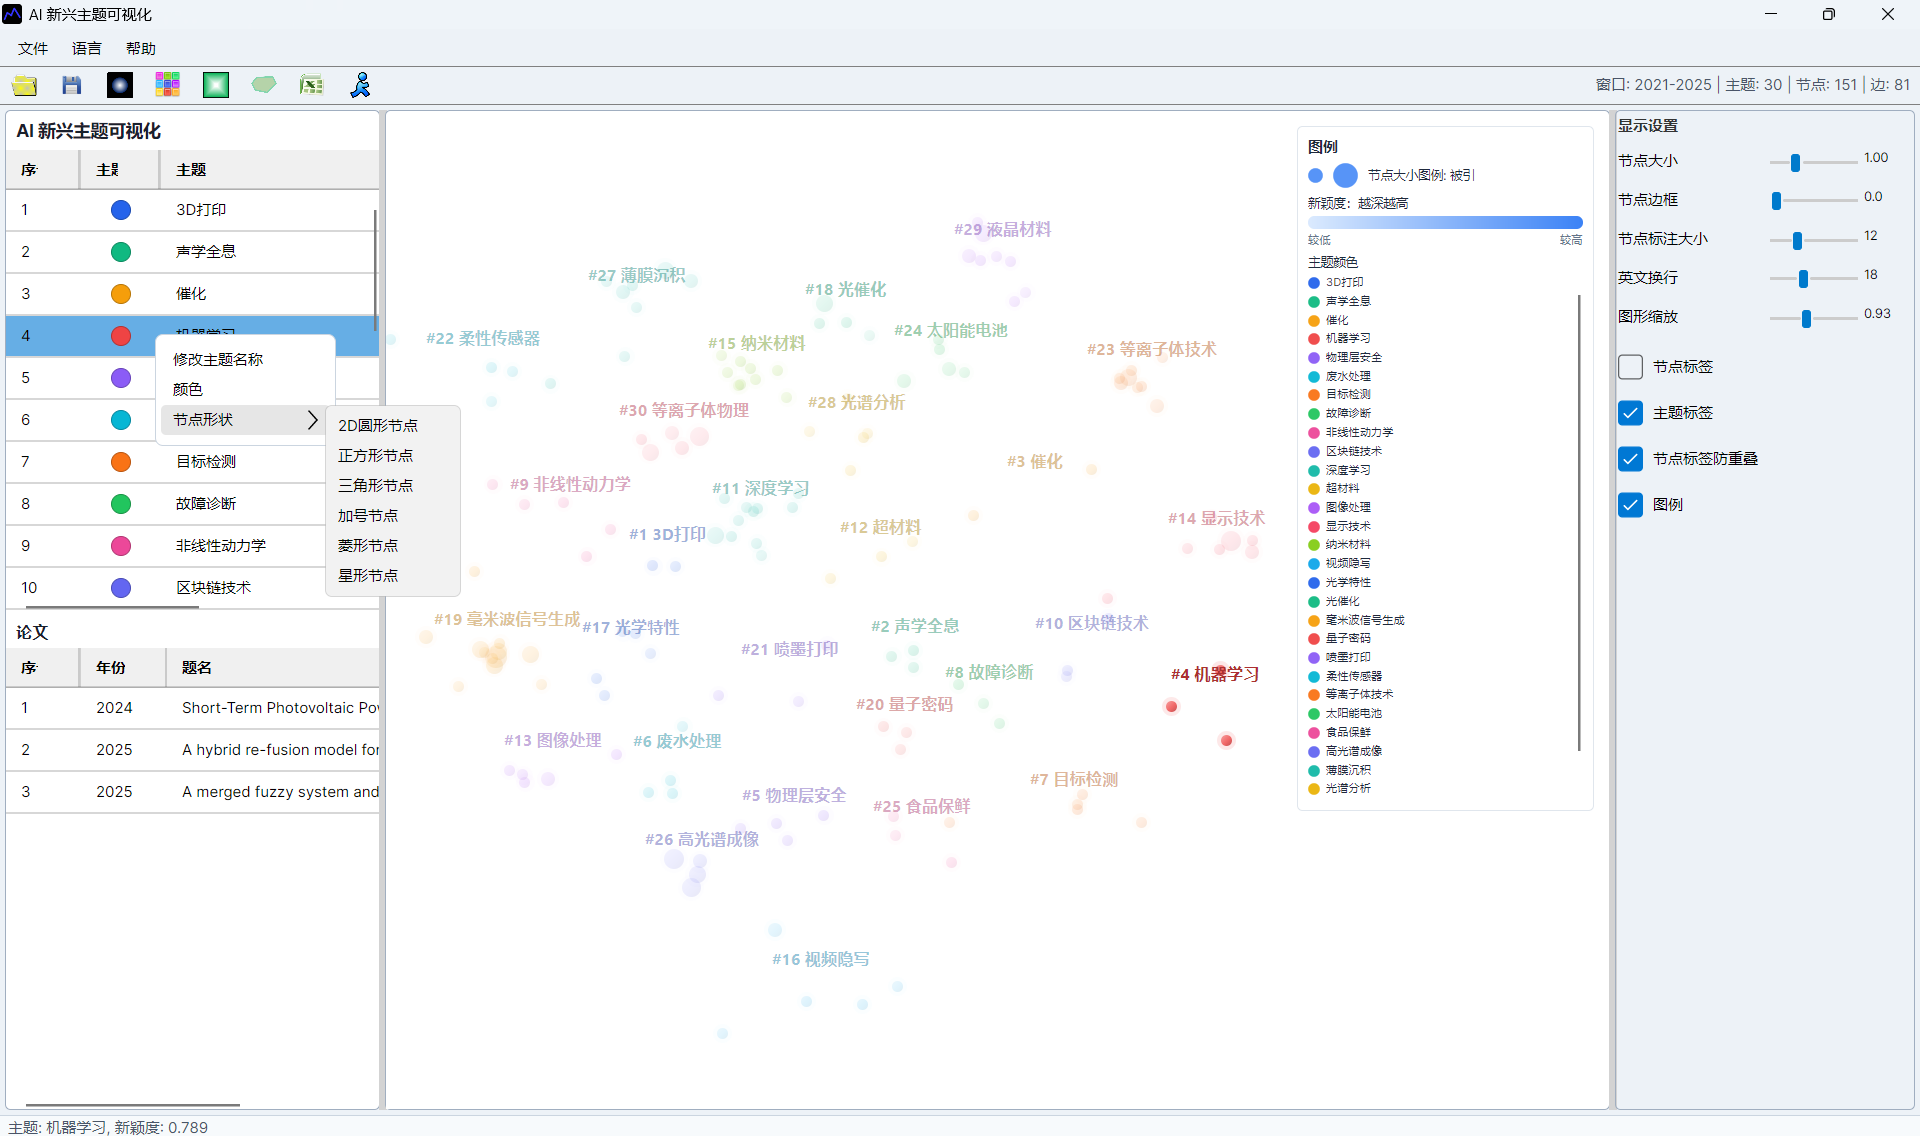
Topic-hull membership comes only from the AI topic labels already stored by SciMetrics. Node color and spatial distance never create new topics, and one topic is not split into spatial subtopics. Starting from Off, the toolbar button cycles through Natural Smooth, Organic, Convex, then Off, preserving both original effects.
The right-side Minimum Topic Hull Nodes setting defaults to 3 and accepts 2–5:
2: two same-topic nodes at different positions form a round-ended capsule; a single node still has no hull.3(default): a topic needs at least three nodes, so two-node topics are omitted.4–5: suppress small topic outlines when stronger membership evidence is preferred.
Organic hulls use boundary-constrained rounded curves, preventing tails and curve overshoot at sharp or uneven corners. Padding grows from the largest rendered node radius, node scaling, and zoom, so large nodes are not clipped by a fixed padding ceiling. Fill retains the topic color and the border uses a slightly darker shade. On-screen rendering and SVG export use the same boundary points and styles.
MCP and Automation API Control
Users who do not know APIs can ask WorkBuddy or Codex directly:
Use the scim MCP on the currently open AI Emerging Topic distribution.
Set topic hulls to Organic and minimum topic hull nodes to 2. Do not regroup or split topics.
Export the distribution page to D:\Research\Output\ai-emerging-hulls.svg and verify that the file exists.
The model should call visual.set_ai_topic_visual_options. In cycle order, topicHullMode accepts none, natural, organic, or convex, corresponding to Off, Natural Smooth, Organic, and Convex. topicHullMinNodeCount accepts 2–5:
{
  "command": "visual.set_ai_topic_visual_options",
  "args": {
    "view": "distribution",
    "topicHullMode": "organic",
    "topicHullMinNodeCount": 2
  }
}
Then call visual.export_ai_topic_visual_window to export SVG with the current settings. The exported hull group carries data-grouping-source="SciM.AITopic", and every hull path carries data-topic for machine verification. Direct local Automation API clients can POST the same JSON to http://127.0.0.1:37618/api/automation/command. These are Desktop visualization commands, so the target AI topic window must already be open.
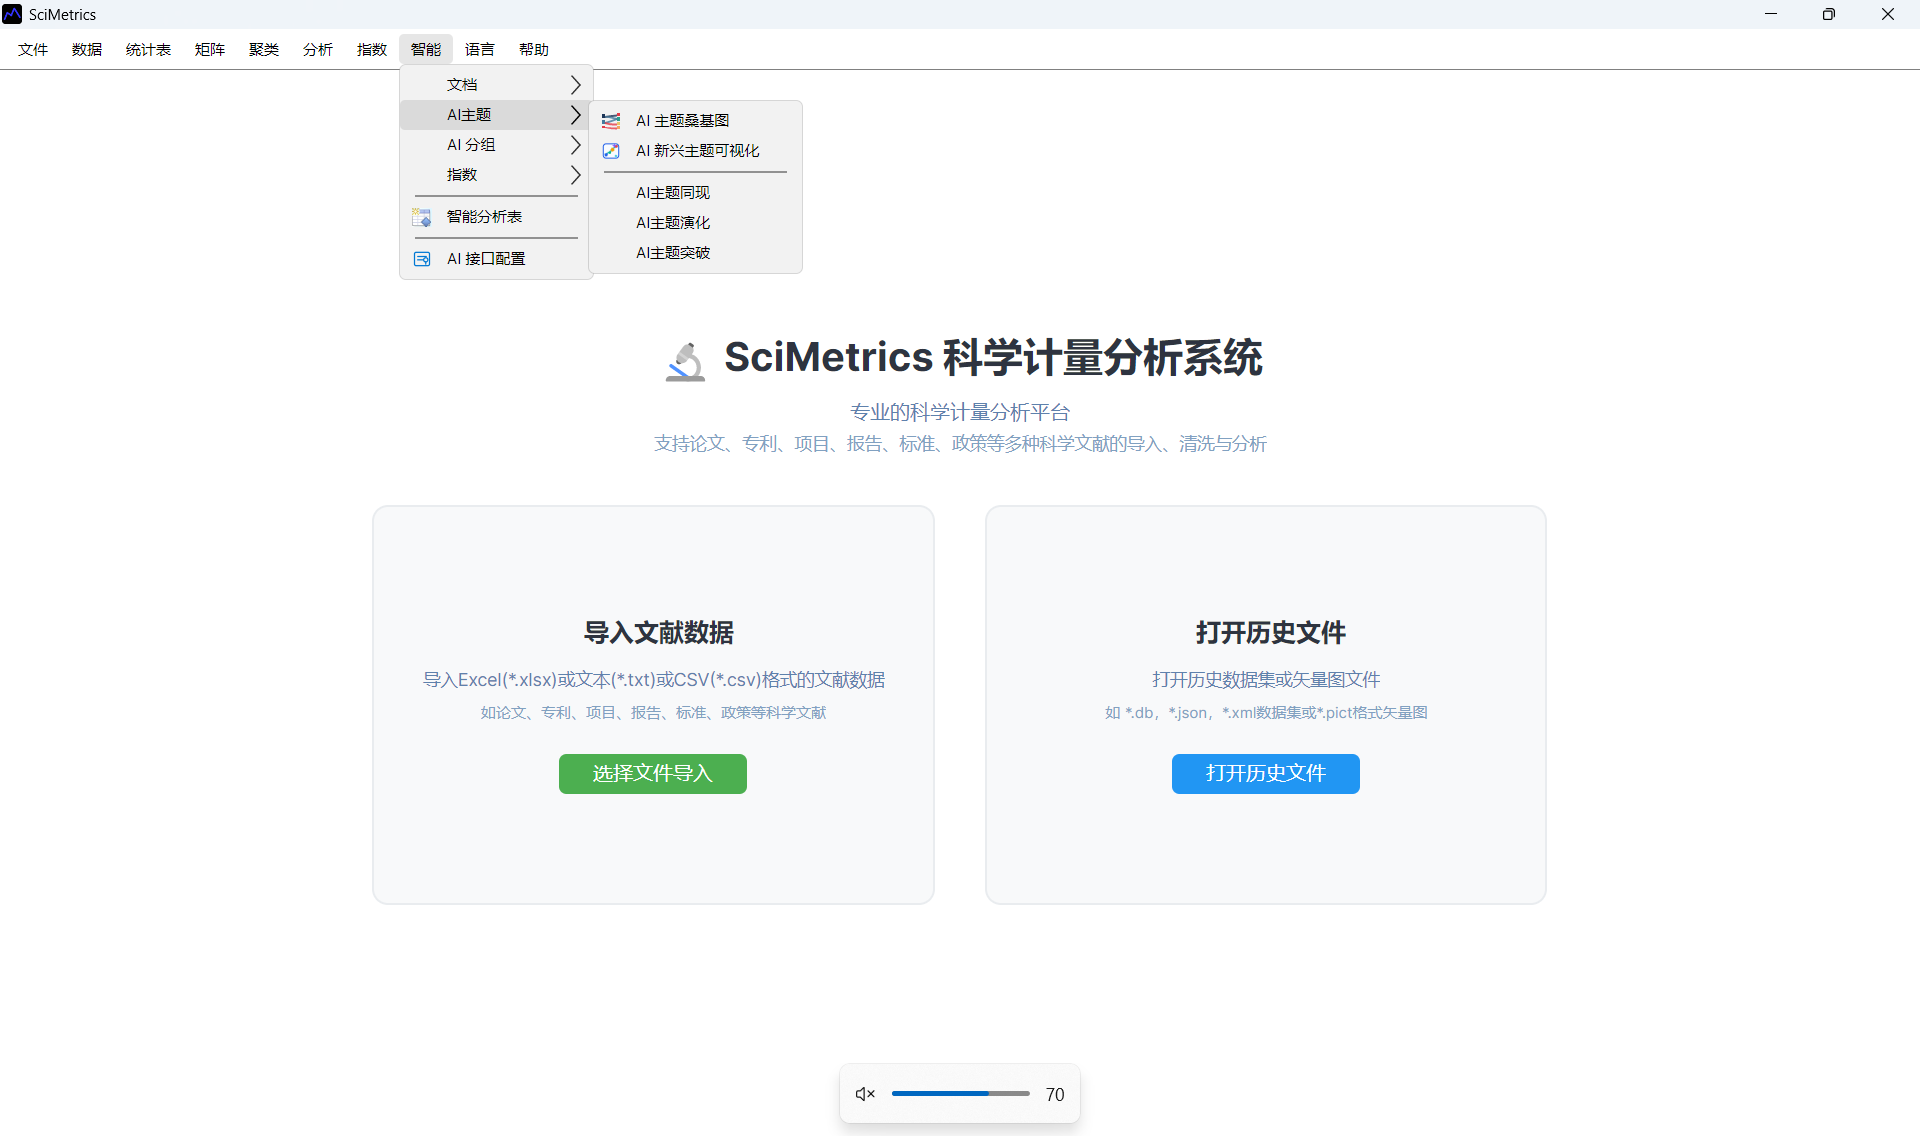
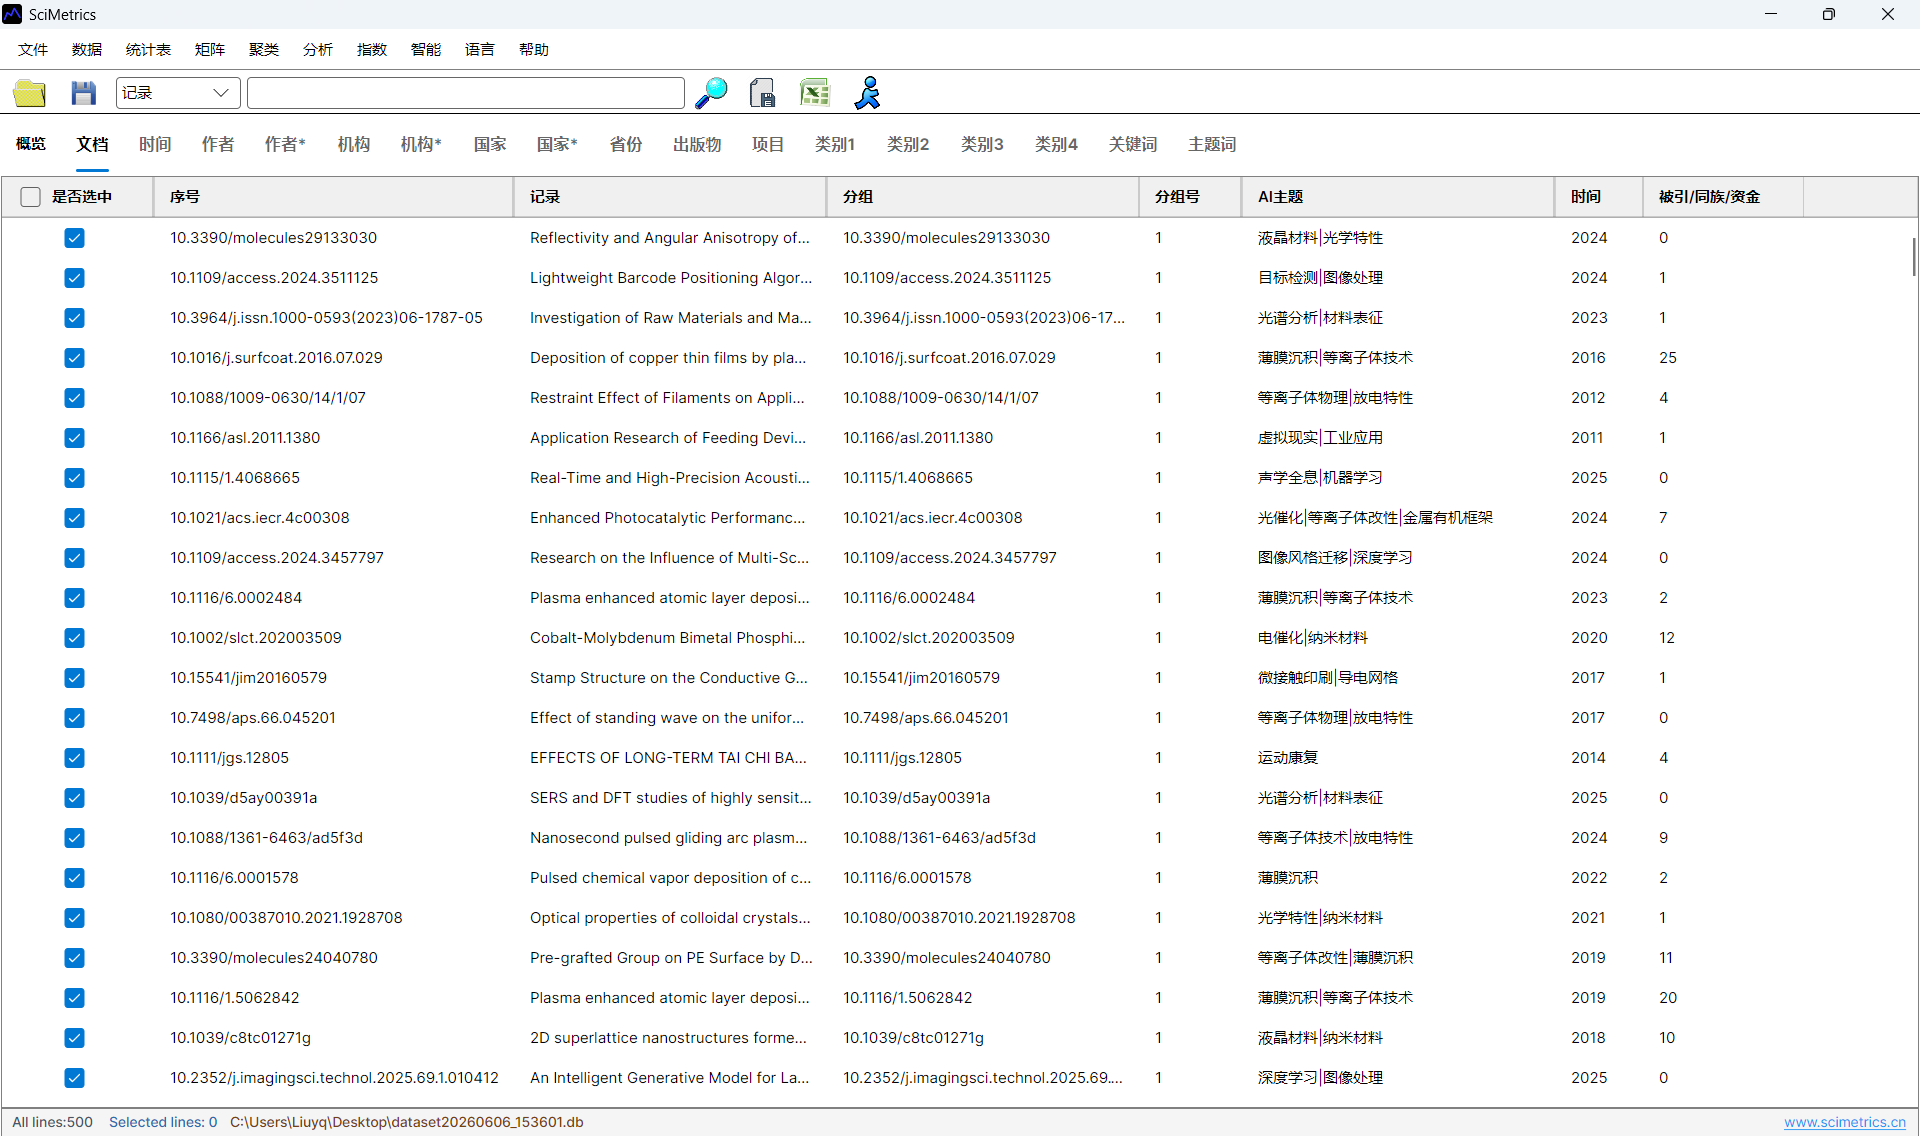
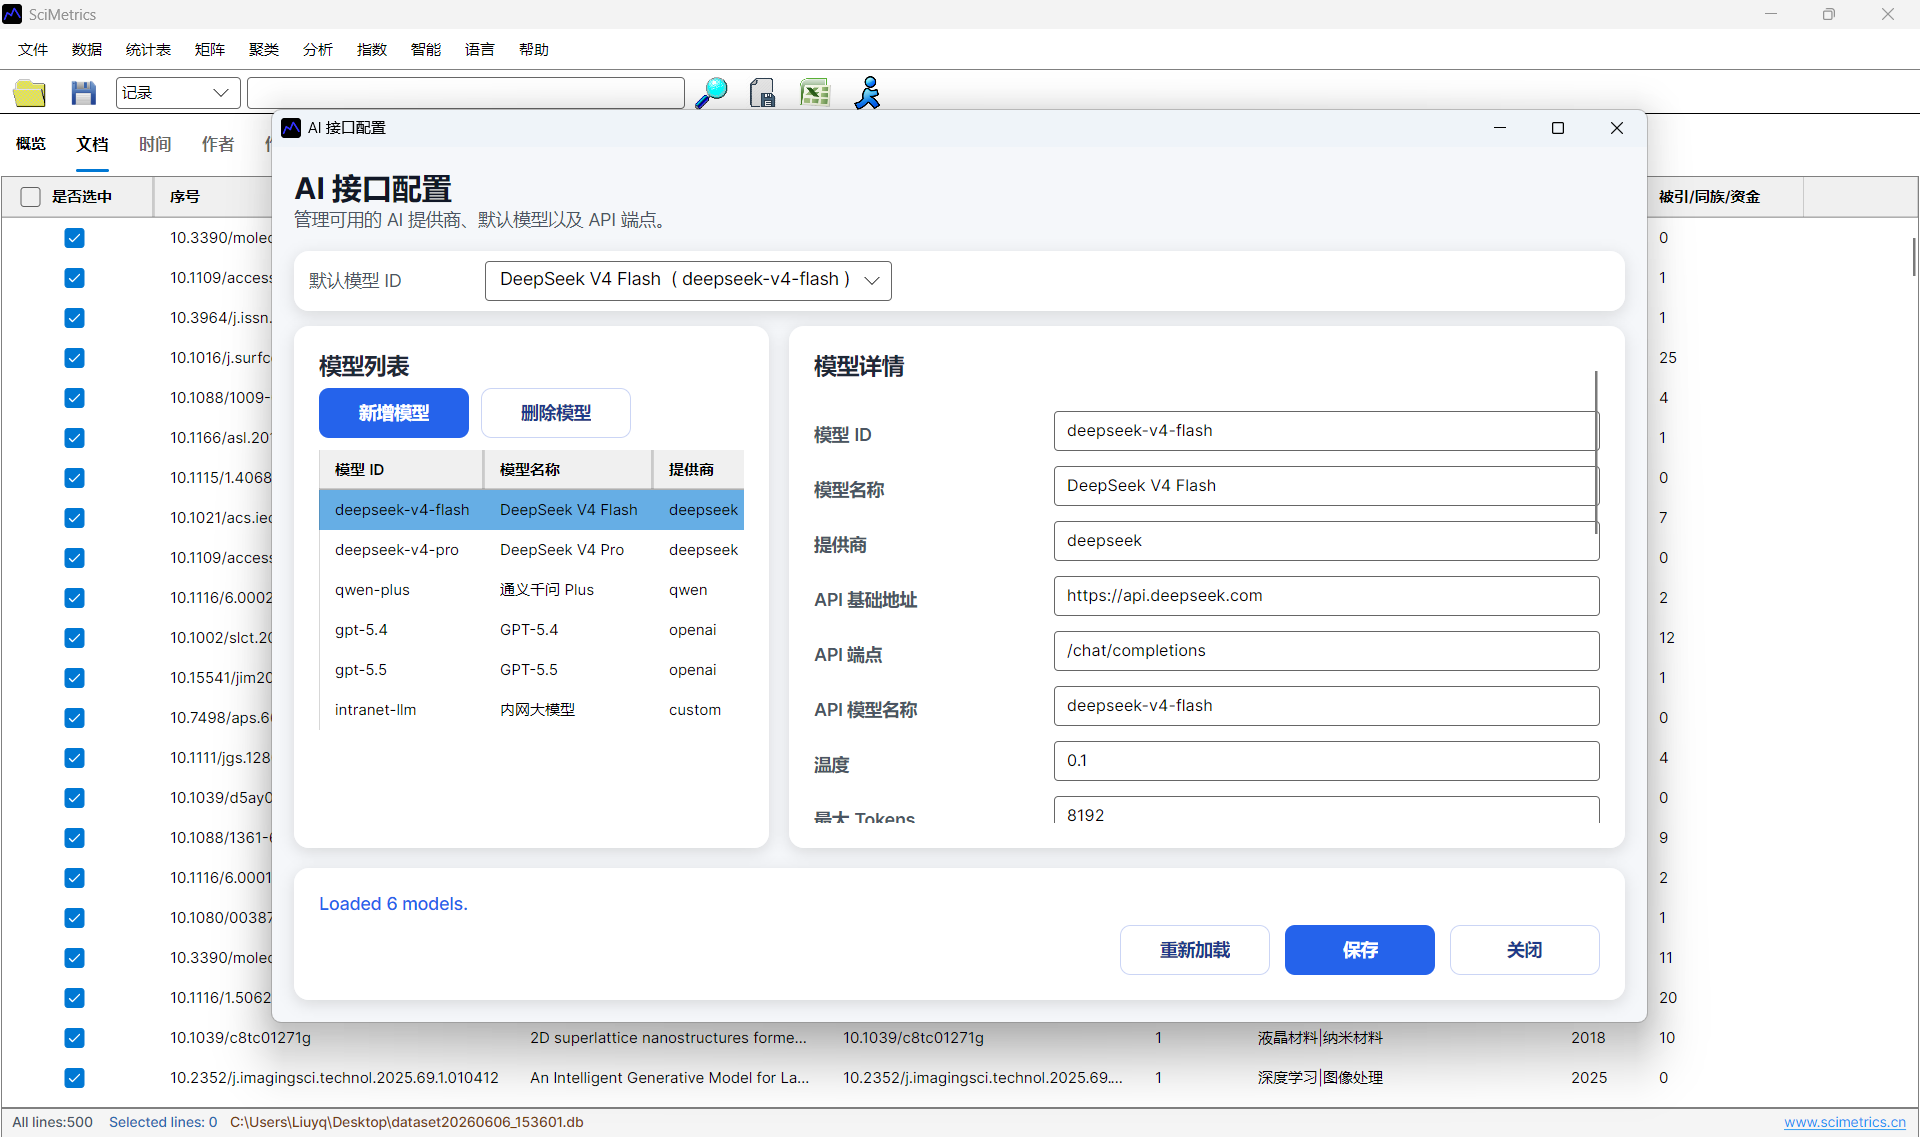
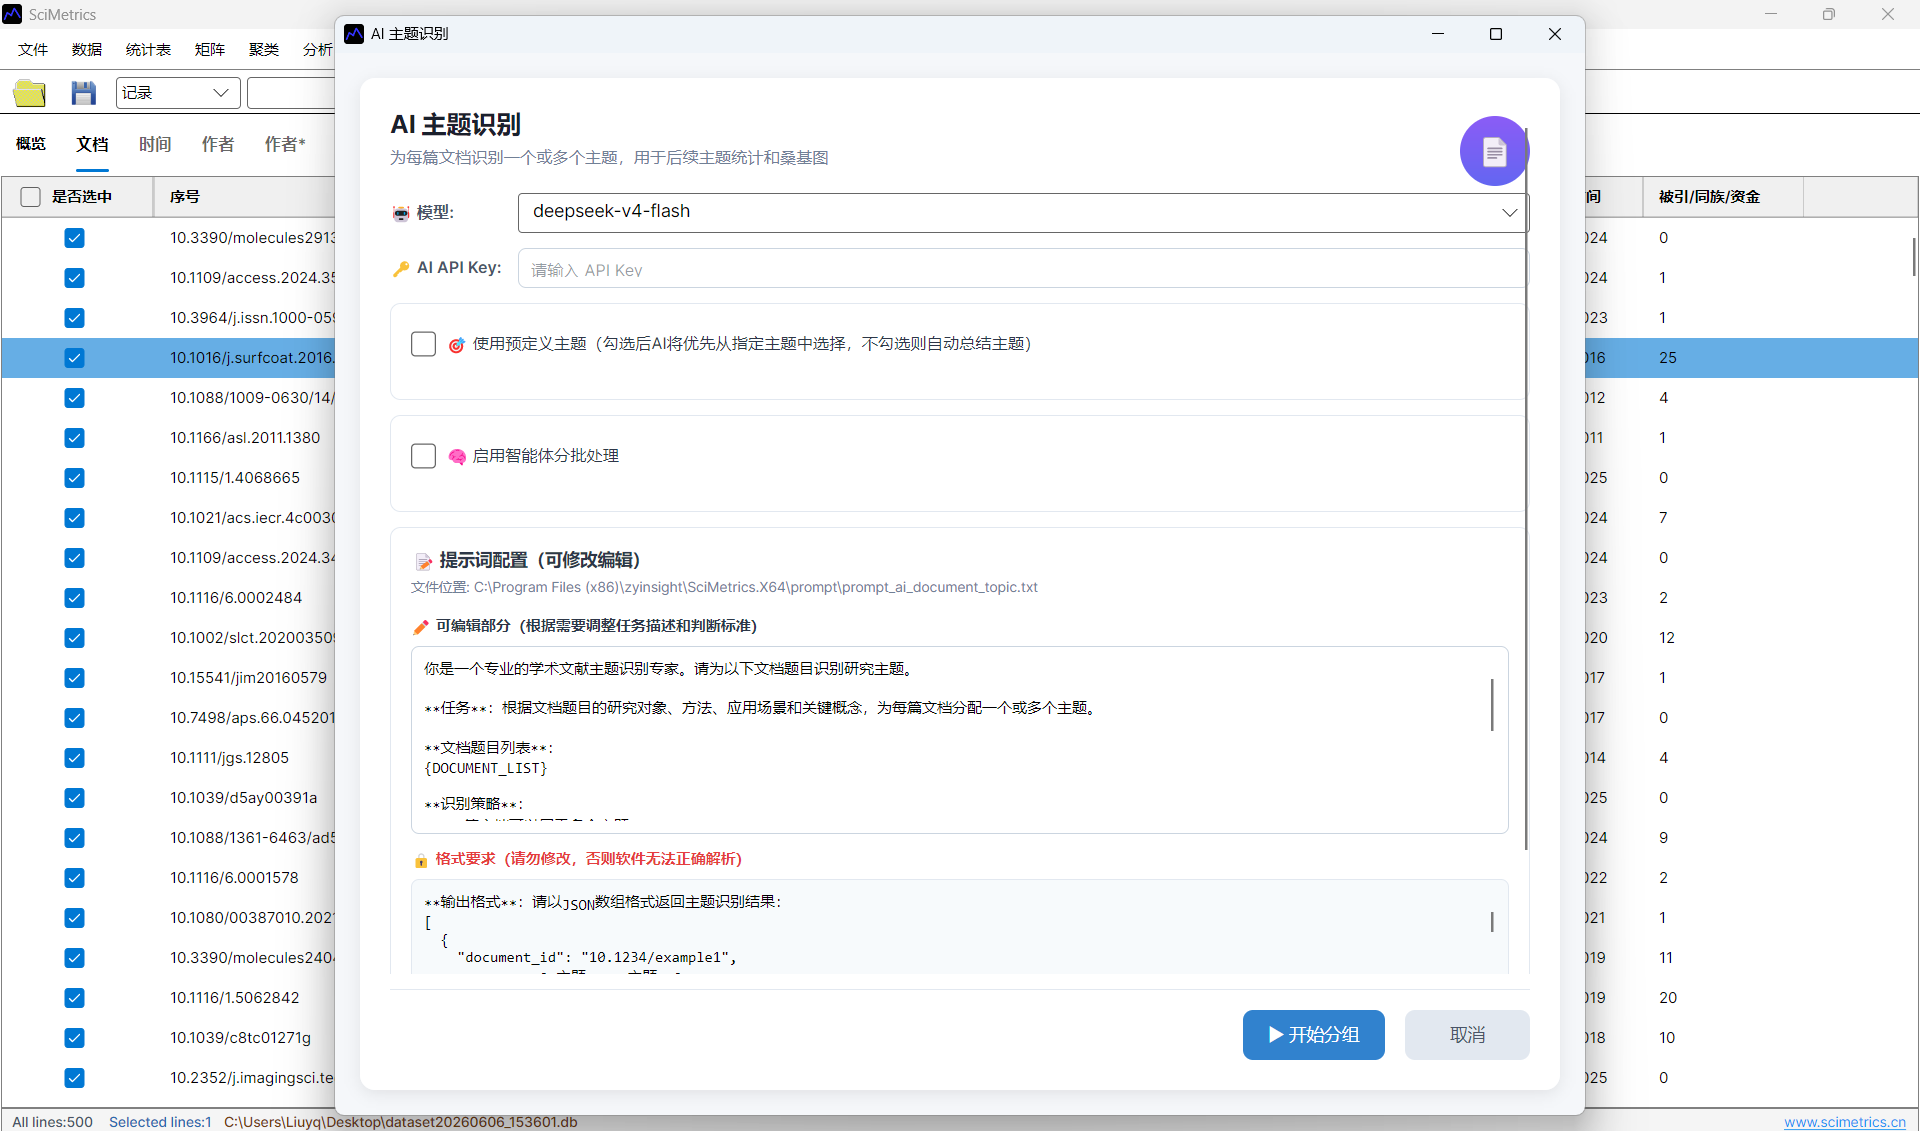
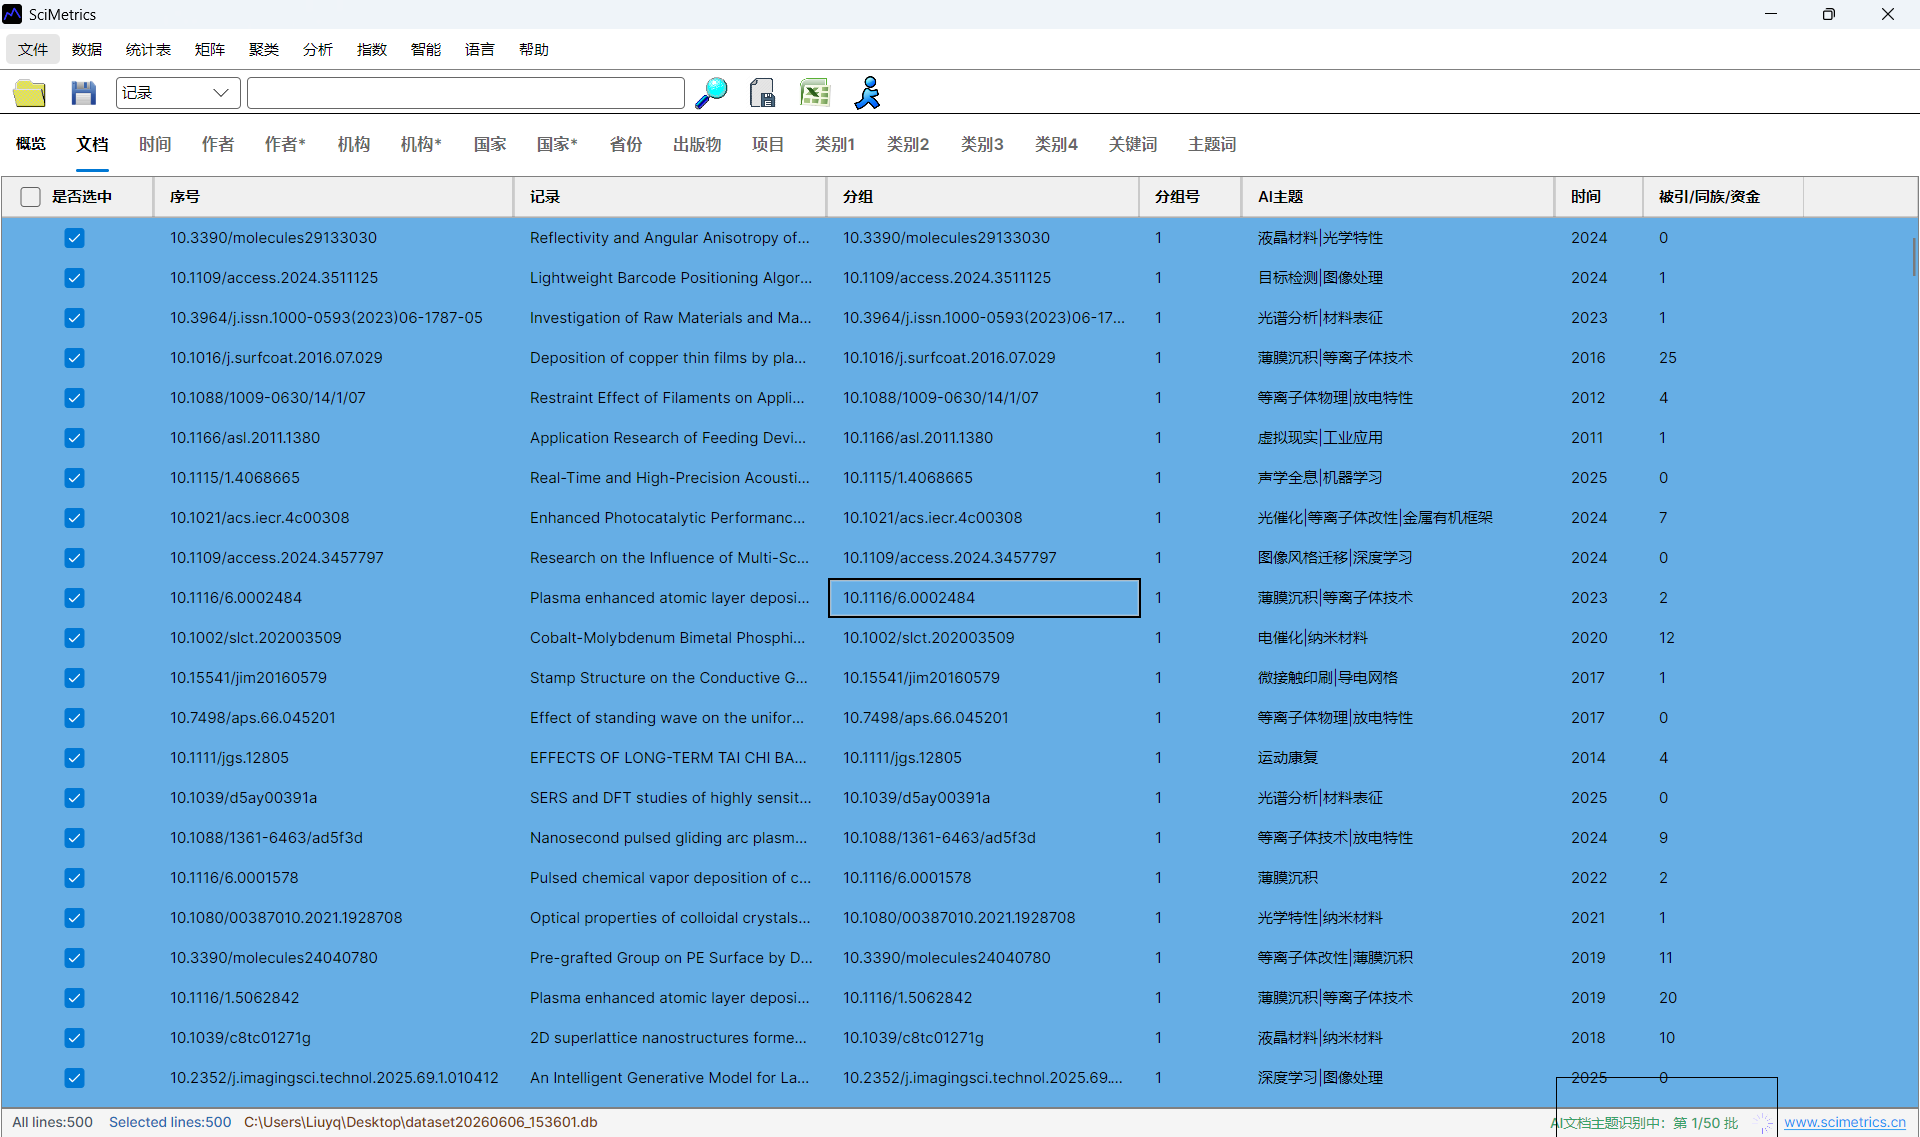
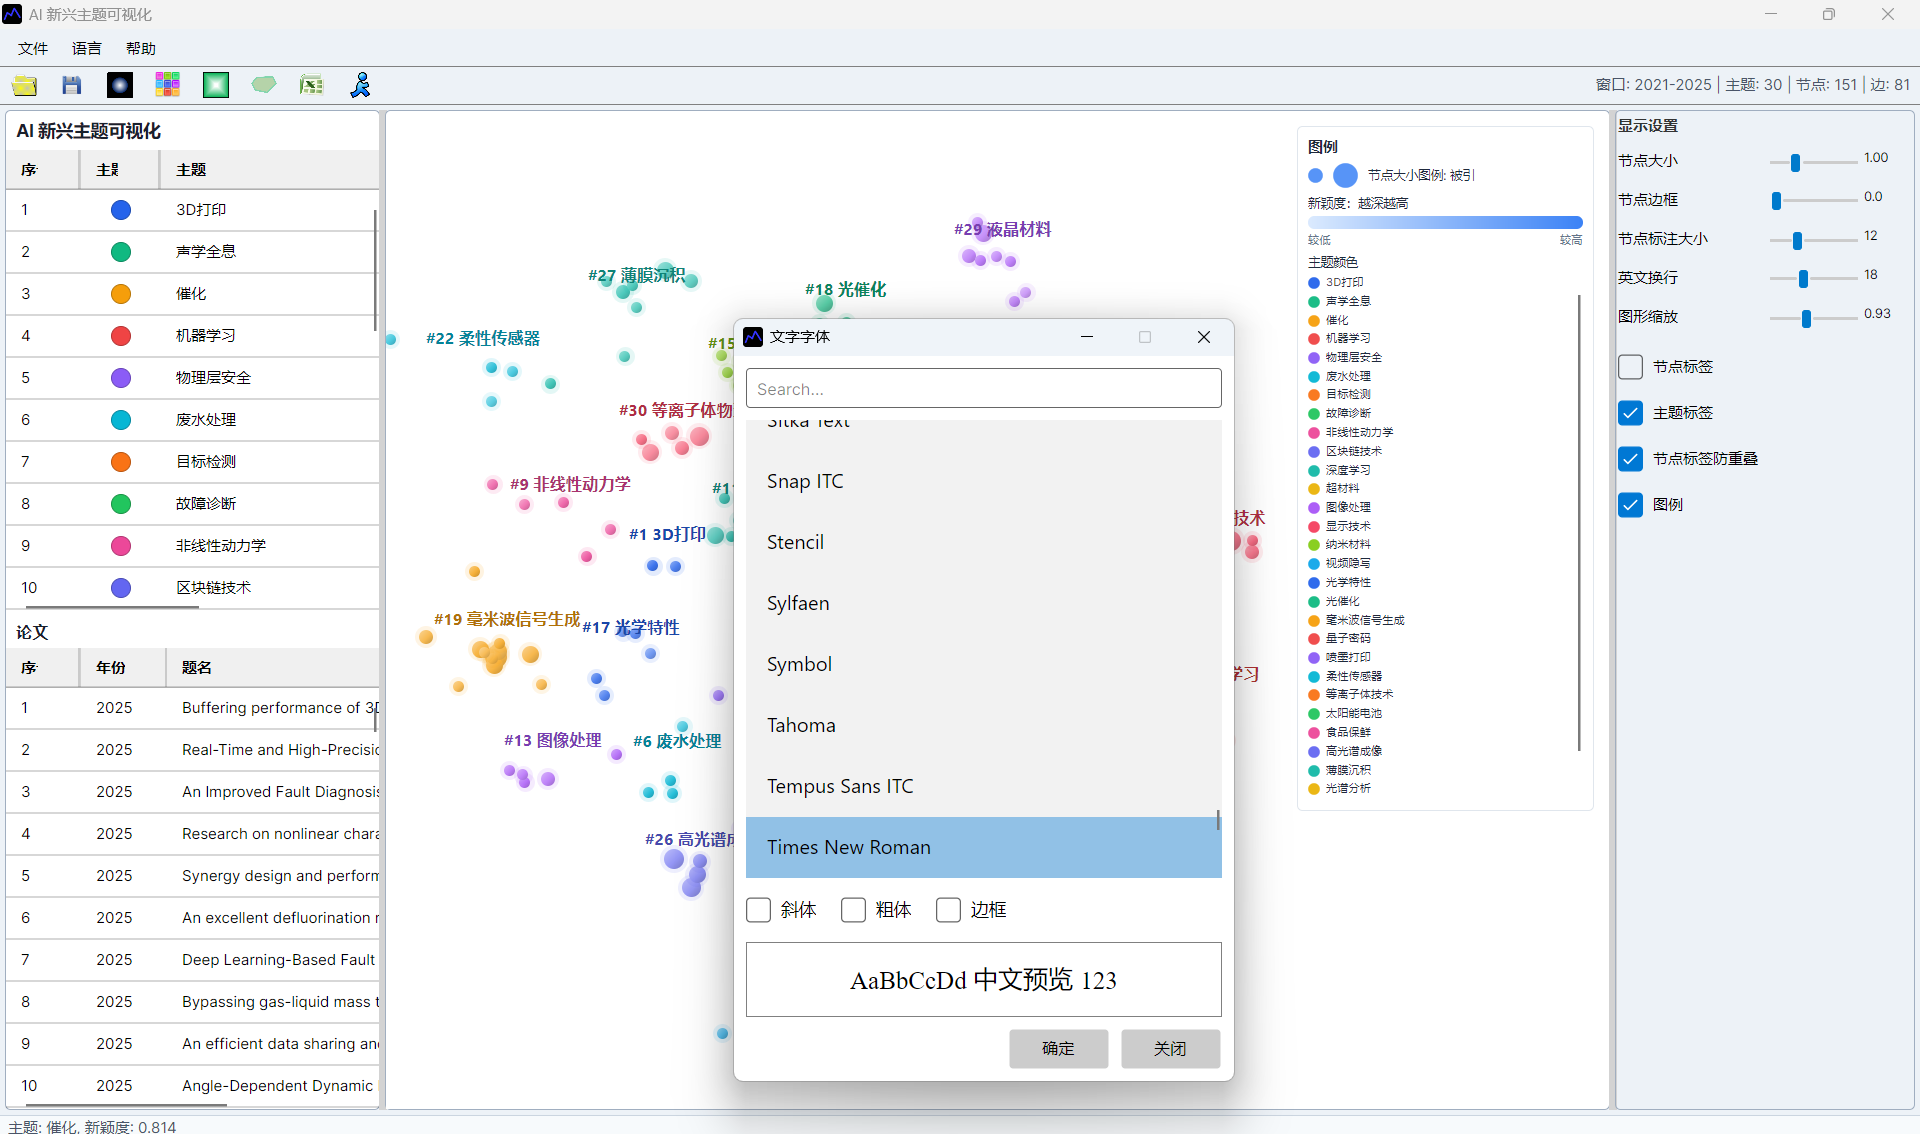
Interface Screenshots
The screenshots below are retained to verify menu entries, parameter settings, result views, and export locations.
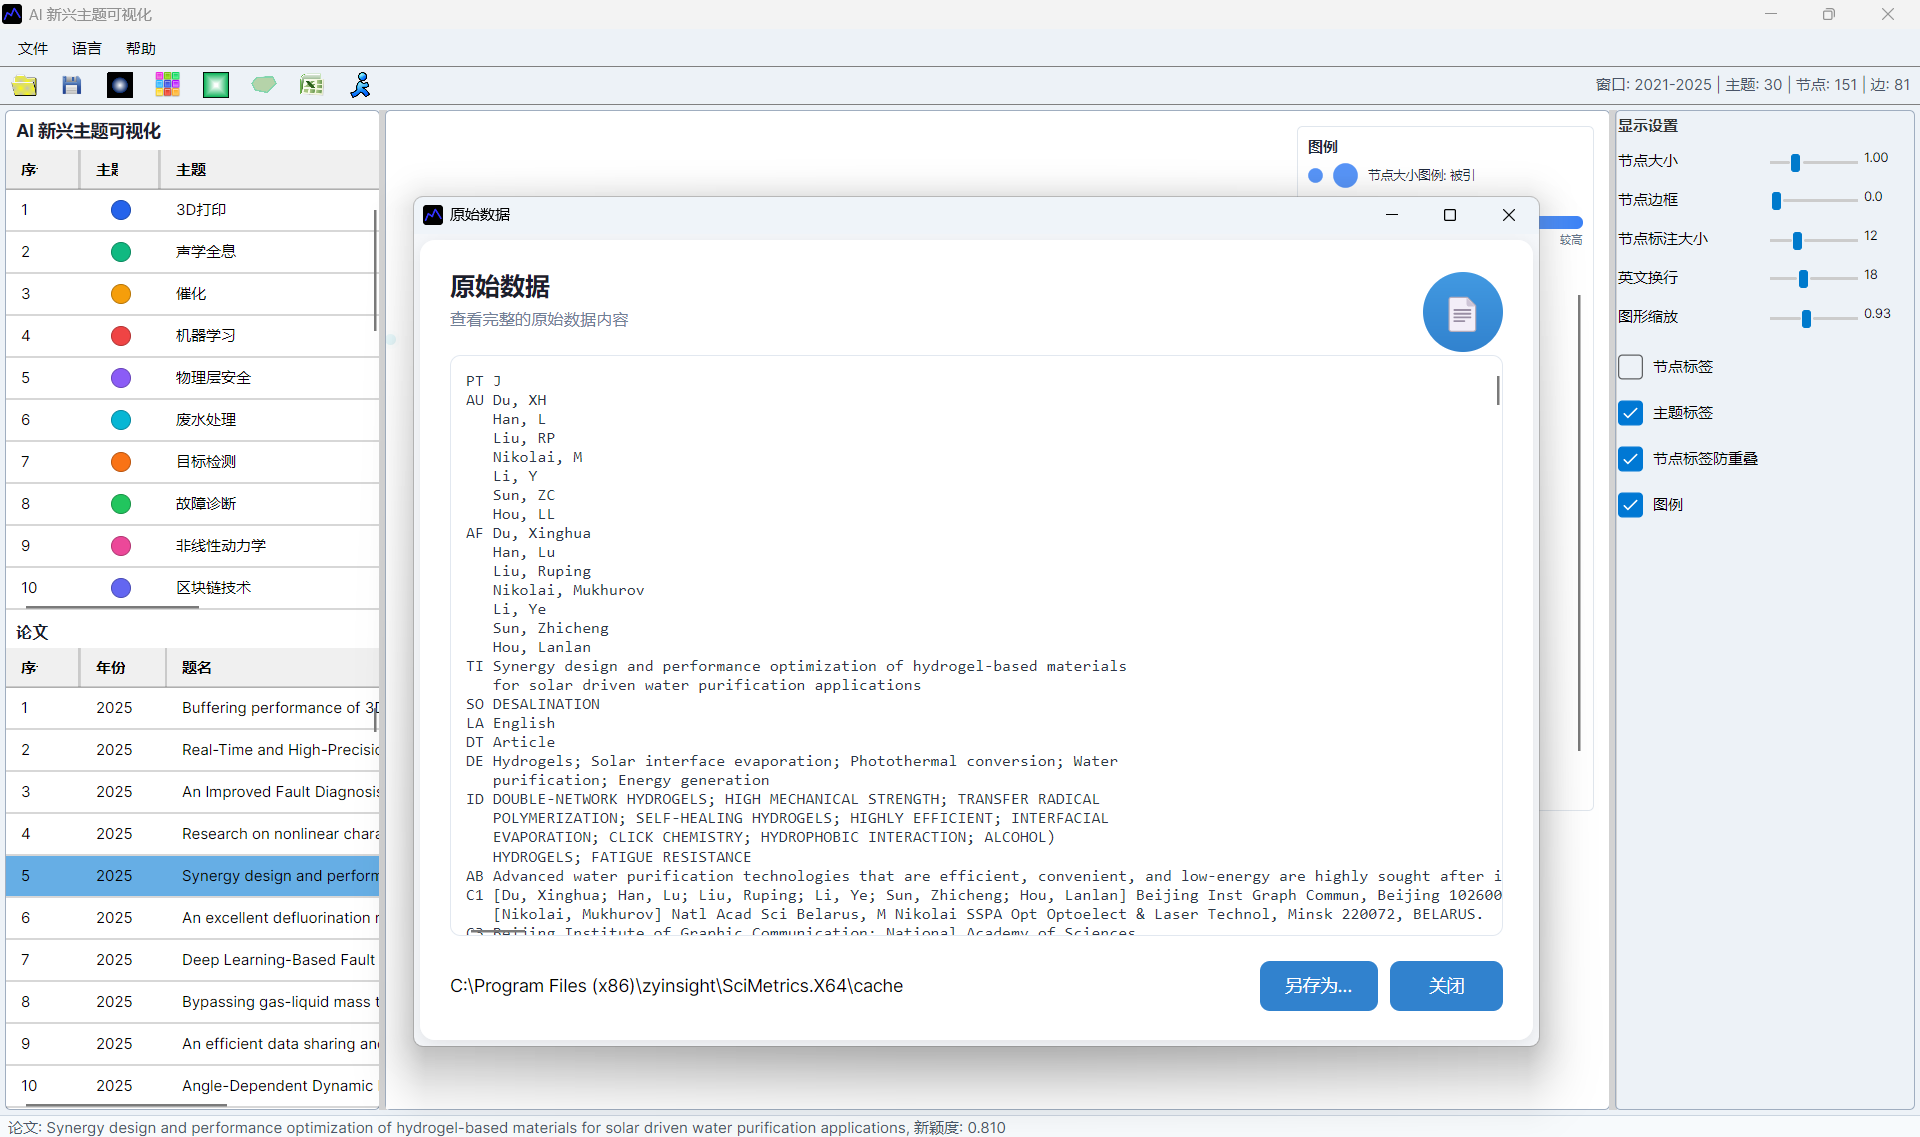
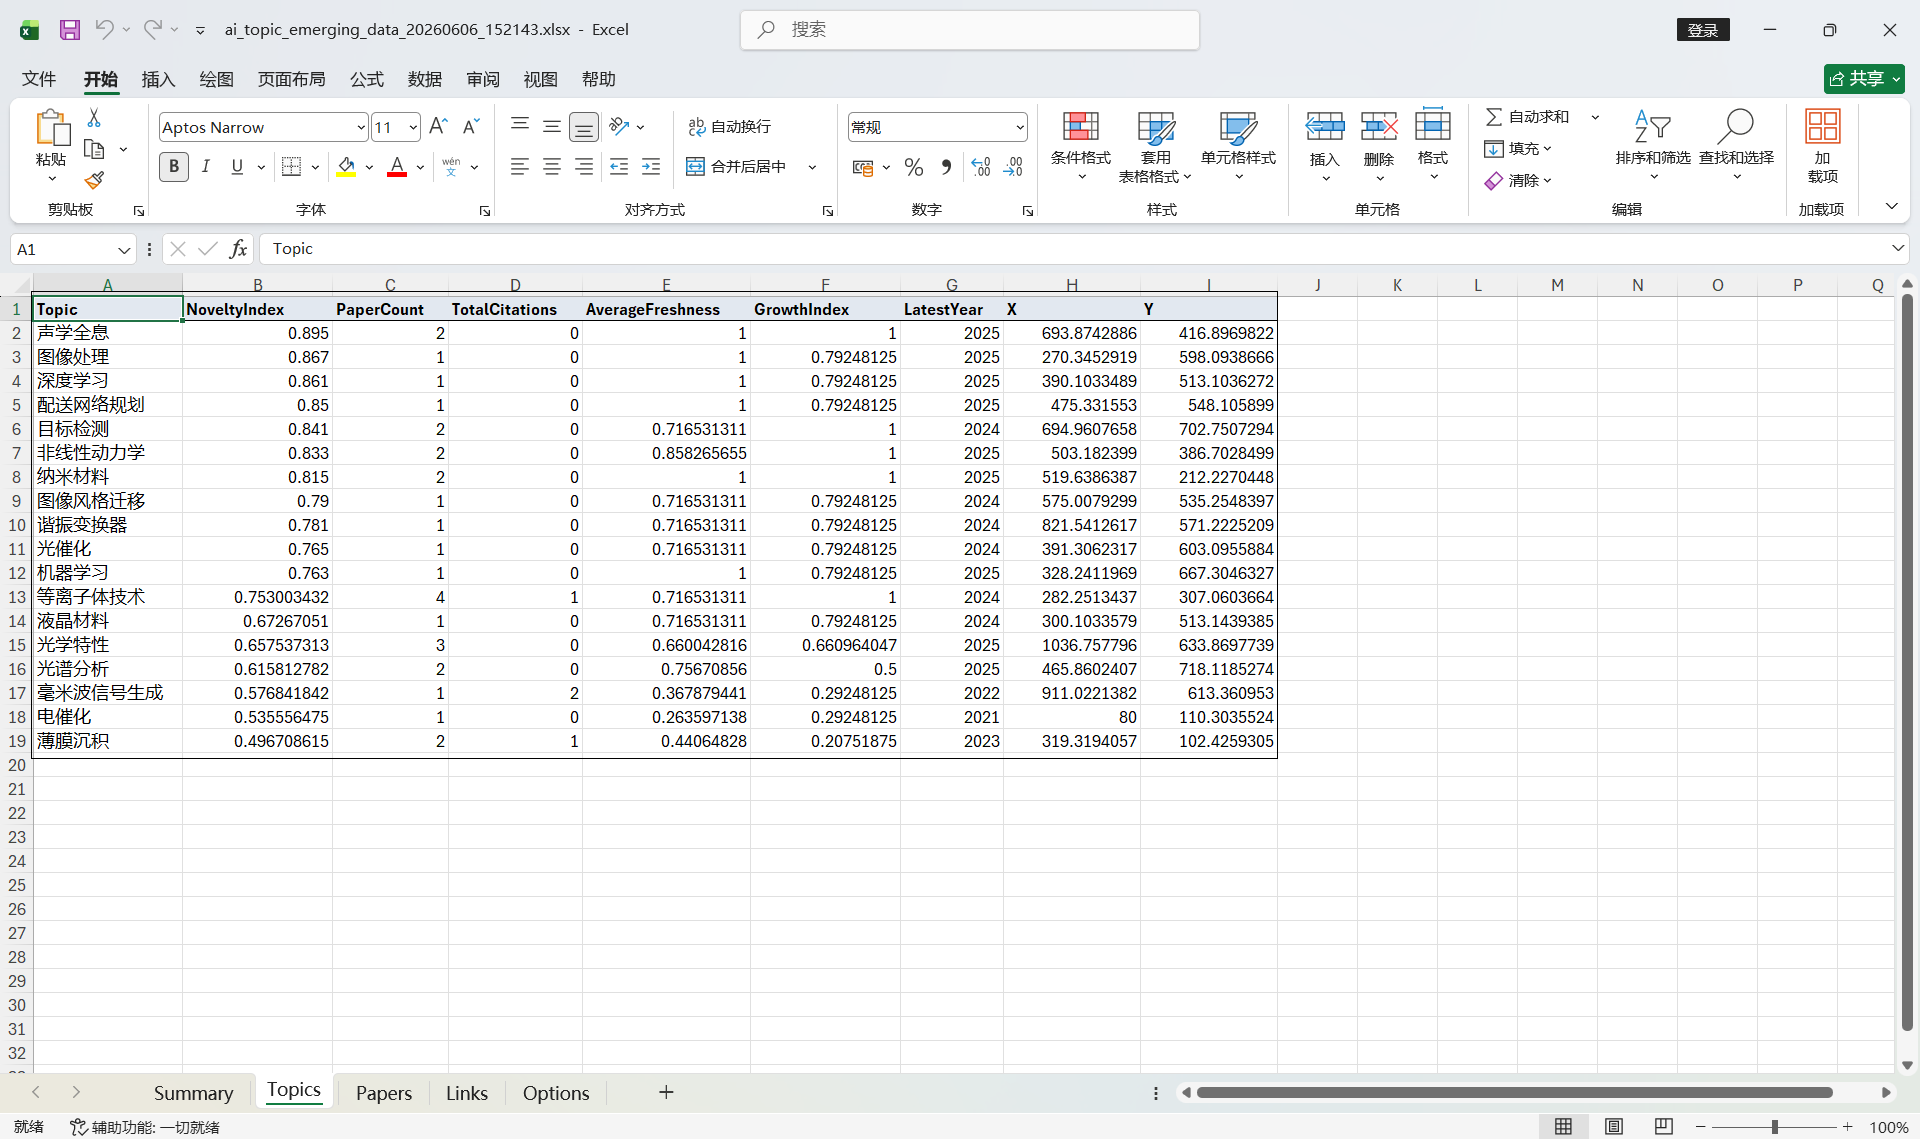
AI Topic Development Potential
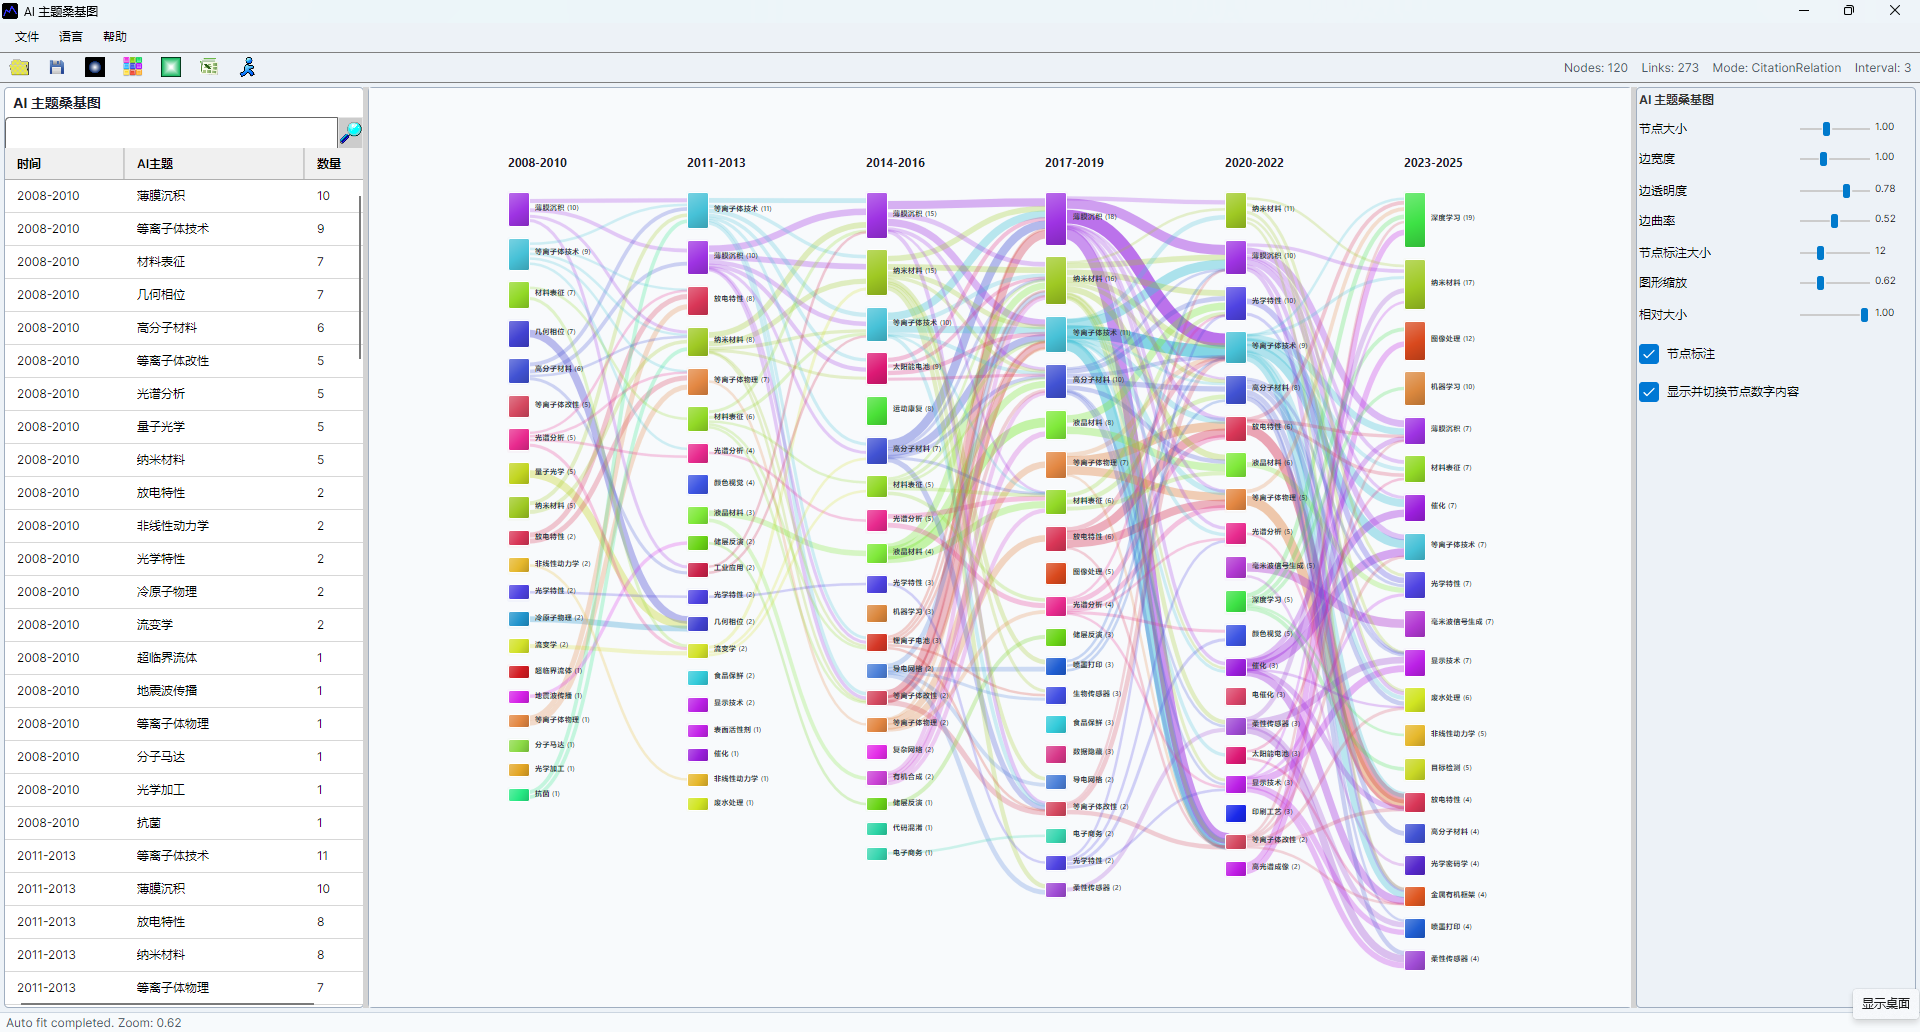
Calculate topic growth potential and inspect topic evolution with Sankey visualization.
AI Topic Development Potential
AI topic development potential helps users find topics with growth momentum, recent activity, citation impact, new author entry, institutional entry, interdisciplinary fusion, and stable time-window performance. It is designed for opportunity discovery and direction planning.
Data Requirements
- Literature records with publication years and citation counts.
- AI topic labels that have been generated and reviewed.
- Author, institution, and classification data when entry and fusion indicators are needed.
Export The Index
- Confirm that the current dataset contains AI topic labels.
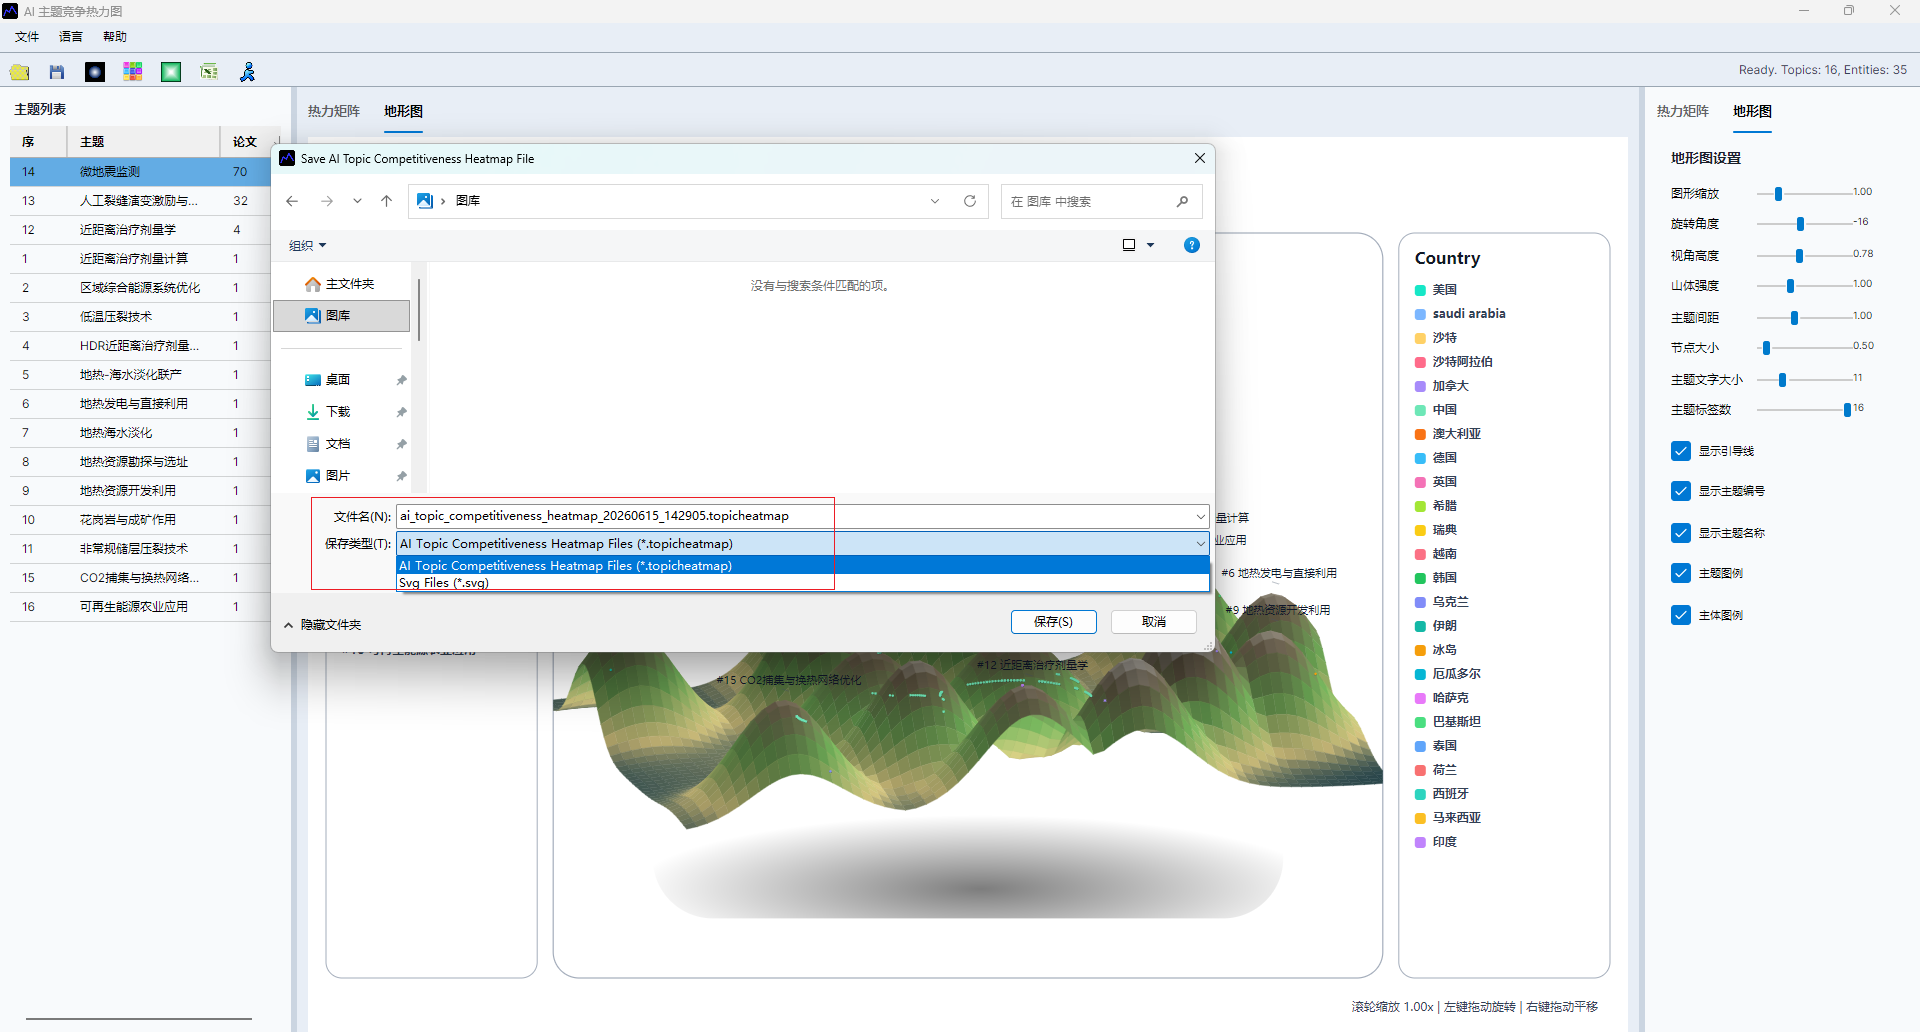
- Open
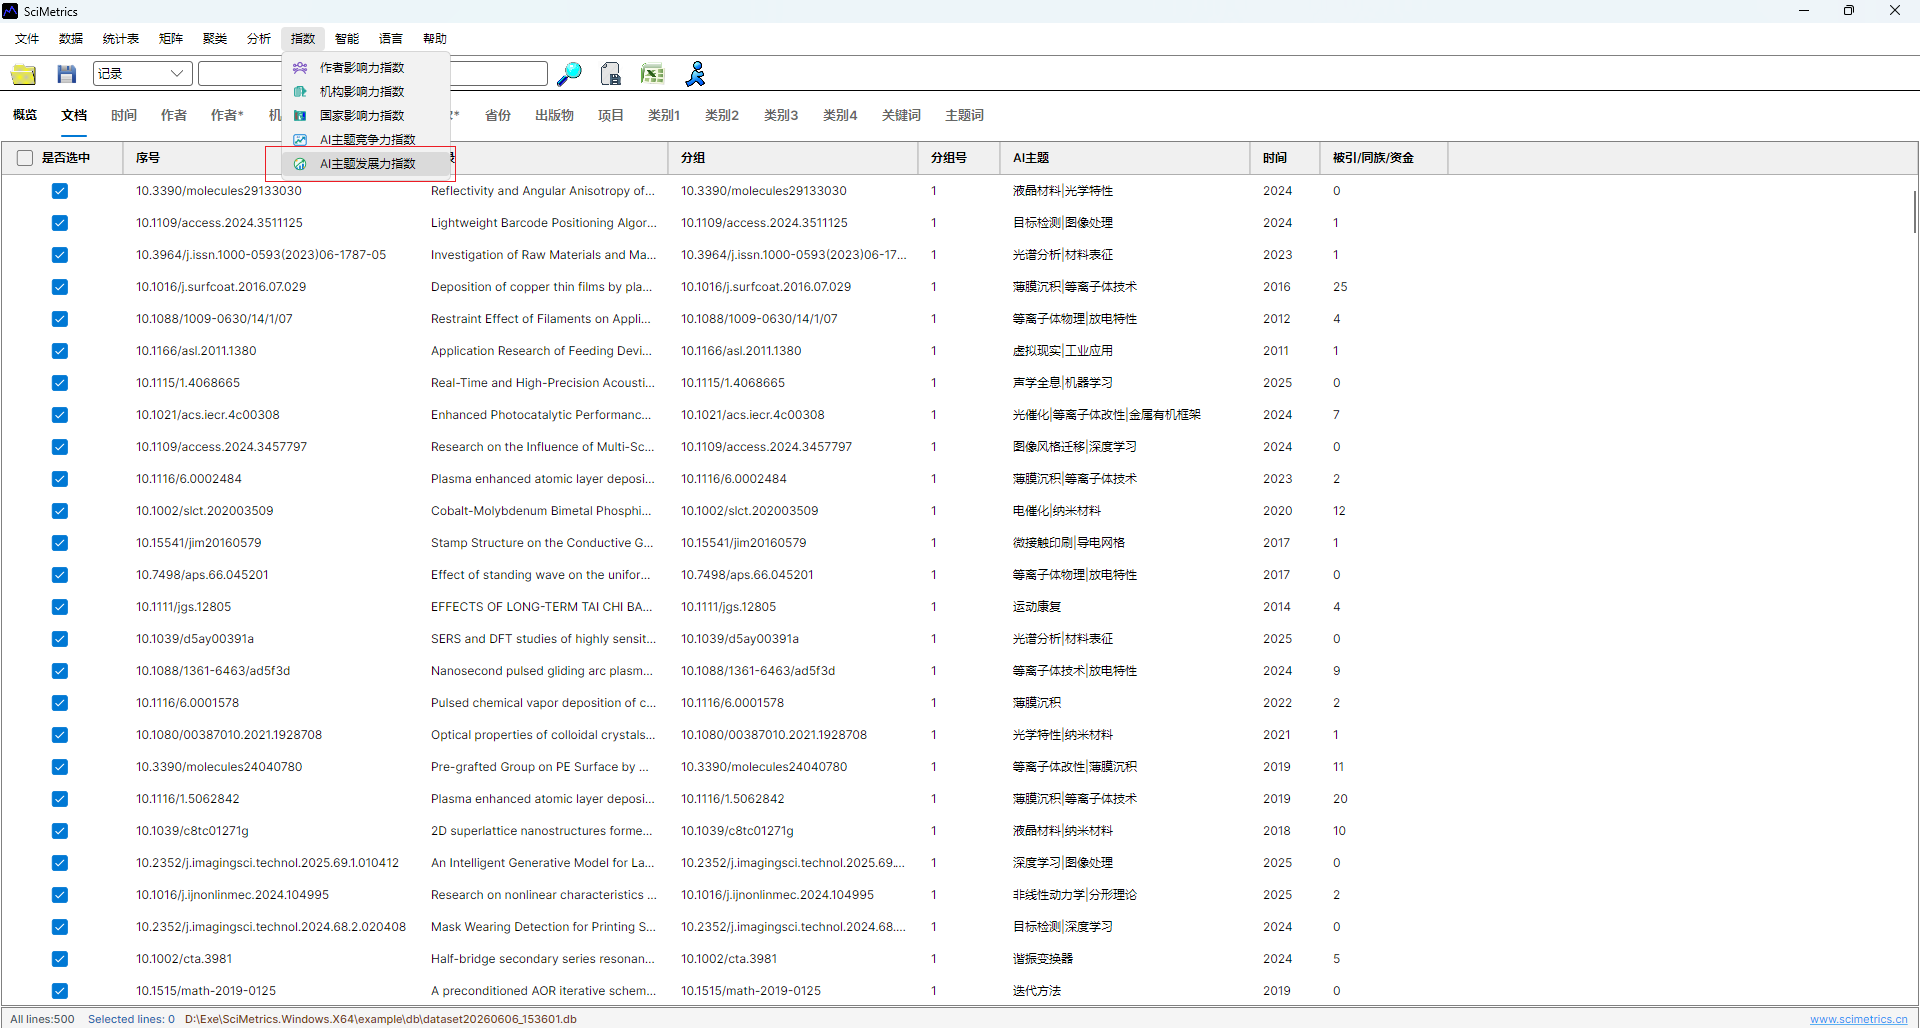
Index -> AI Topic Index -> AI Topic Growth Index. - Select an Excel output path.
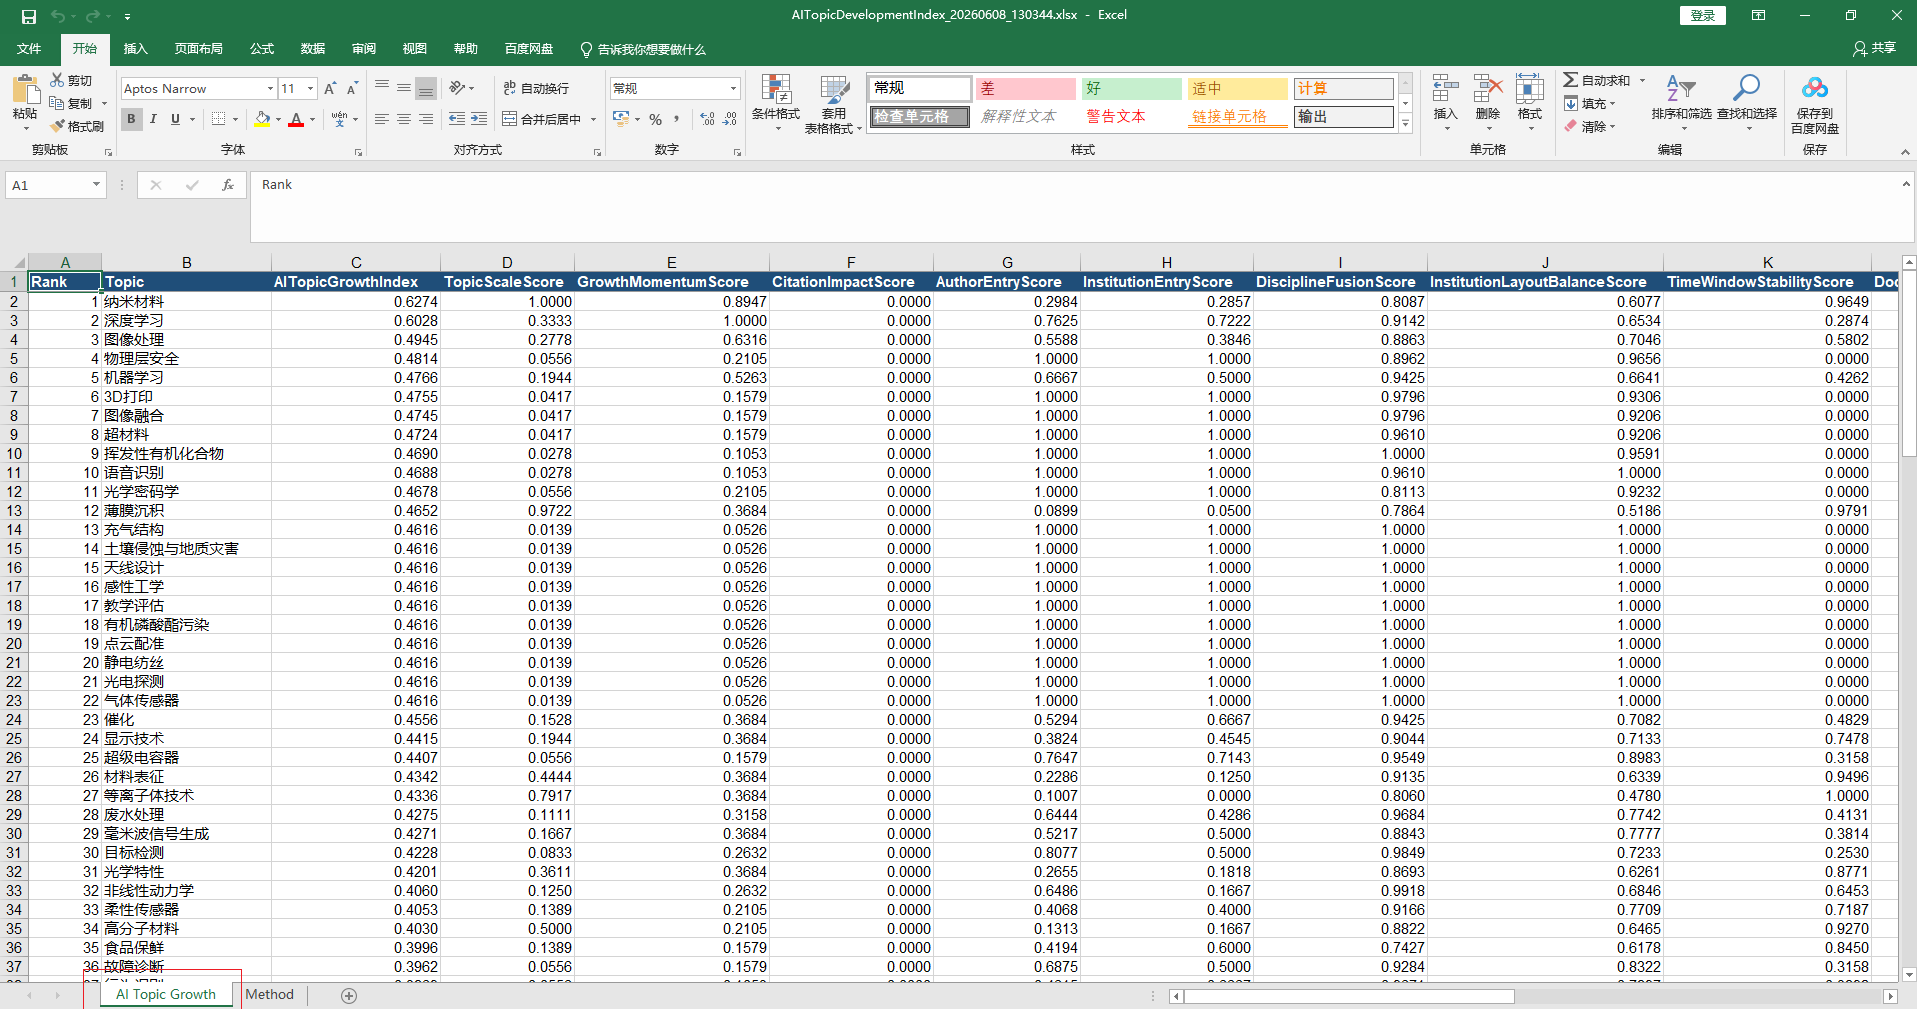
- Export the index table and method sheet.
The exported table normally includes the composite growth index, ranking, topic scale, growth momentum, citation impact, author entry, institution entry, discipline fusion, institutional layout balance, time-window stability, document count, and recent document count.
Generate Topic Evolution
- Open
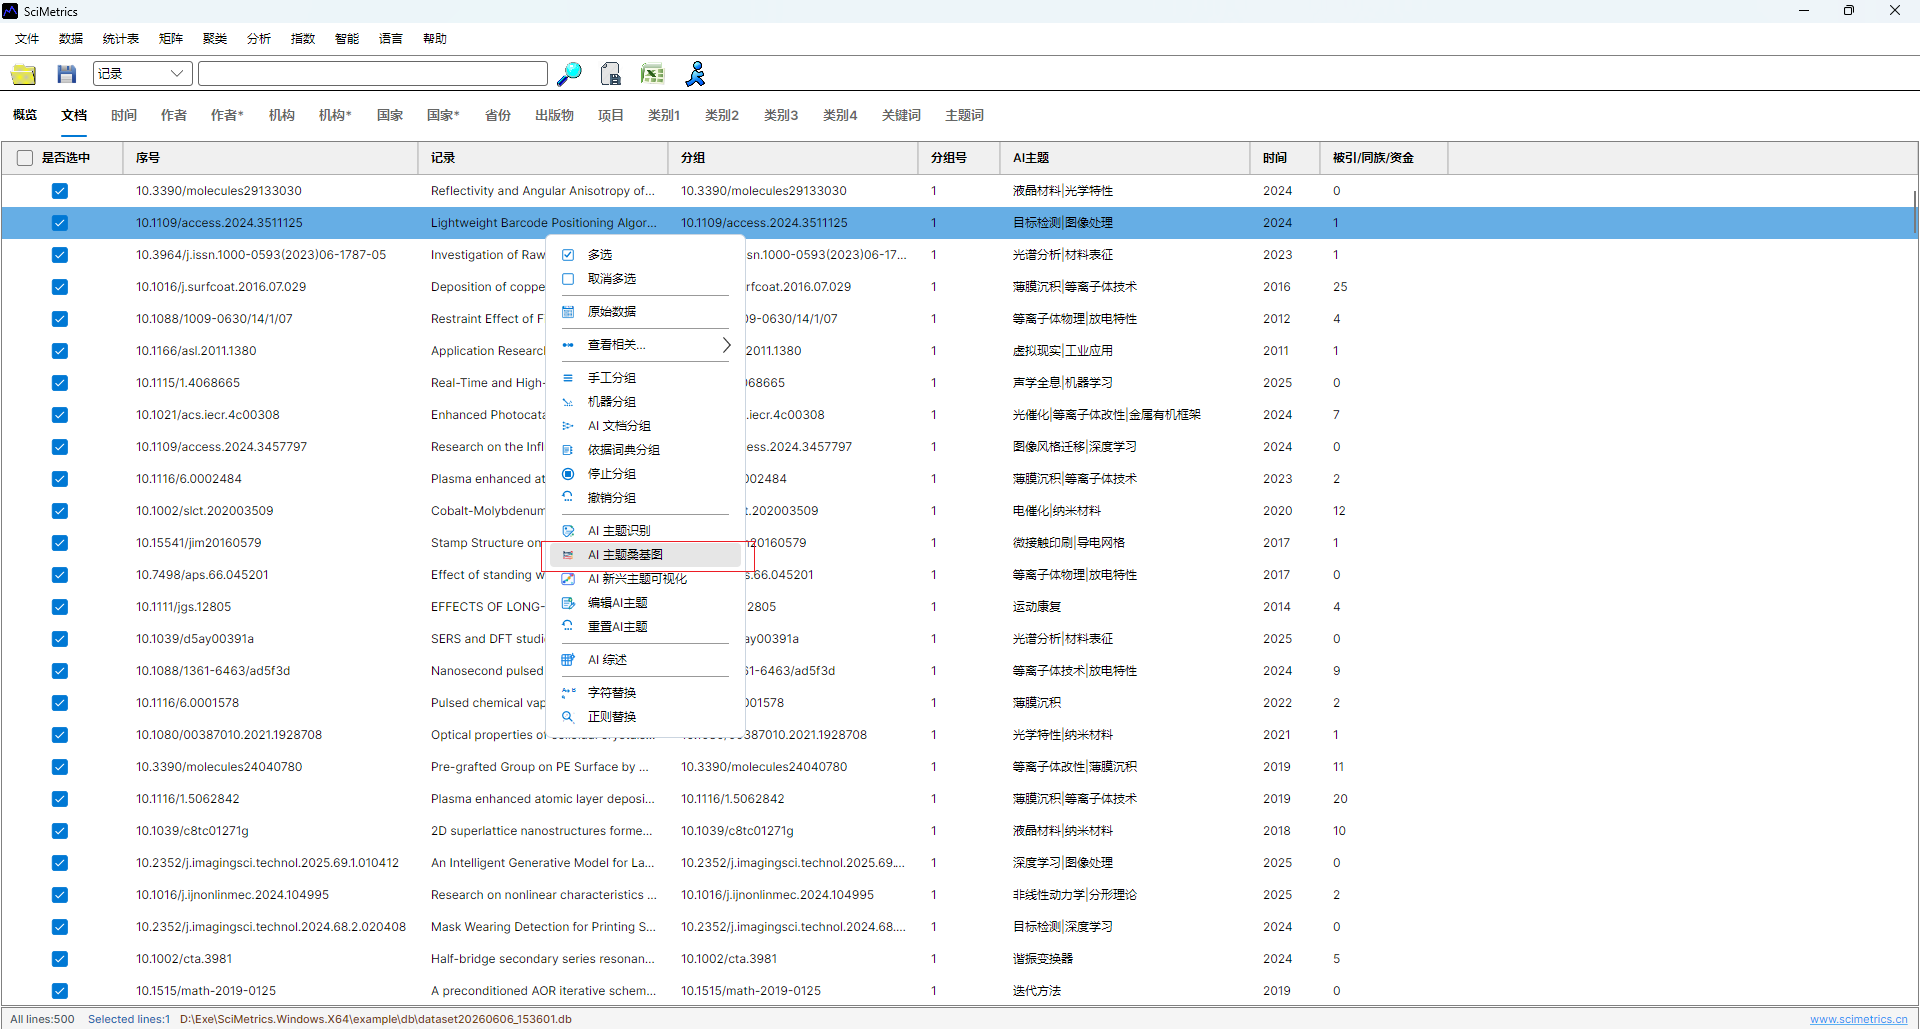
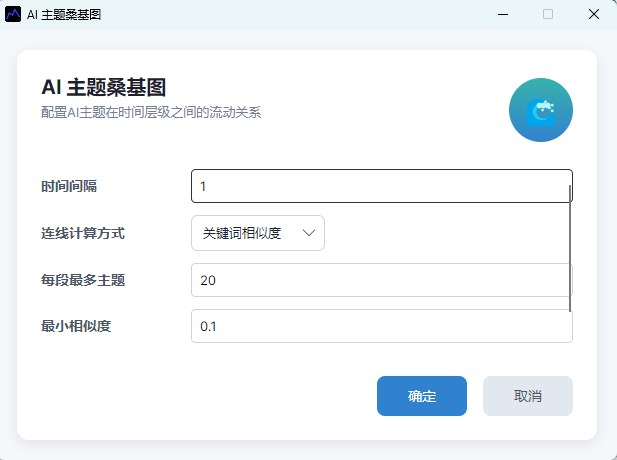
Intelligence -> AI Topic -> AI Topic Sankey. - Set the time interval, connection method, maximum topics per segment, minimum similarity, and whether only selected papers should be used.
- Generate the Sankey view.
- Save the project file for later editing, export SVG for figures, or export Excel for review.
Interpretation
A topic with high growth momentum but small scale is often an early opportunity. A topic with high scale and citation impact but weak recent growth may already be mature. High author and institution entry scores usually mean that a research community is expanding.
Use the index and the Sankey view together: the index ranks candidate directions, while the Sankey view shows whether the topic is continuous, splitting, merging, or fading.
Interface Screenshots
The screenshots below are retained to verify menu entries, parameter settings, result views, and export locations.
AI Topic Competitiveness Map
Compare institutions, authors, or other subjects across AI topics with distribution views.
AI Topic Competitiveness Distribution Map
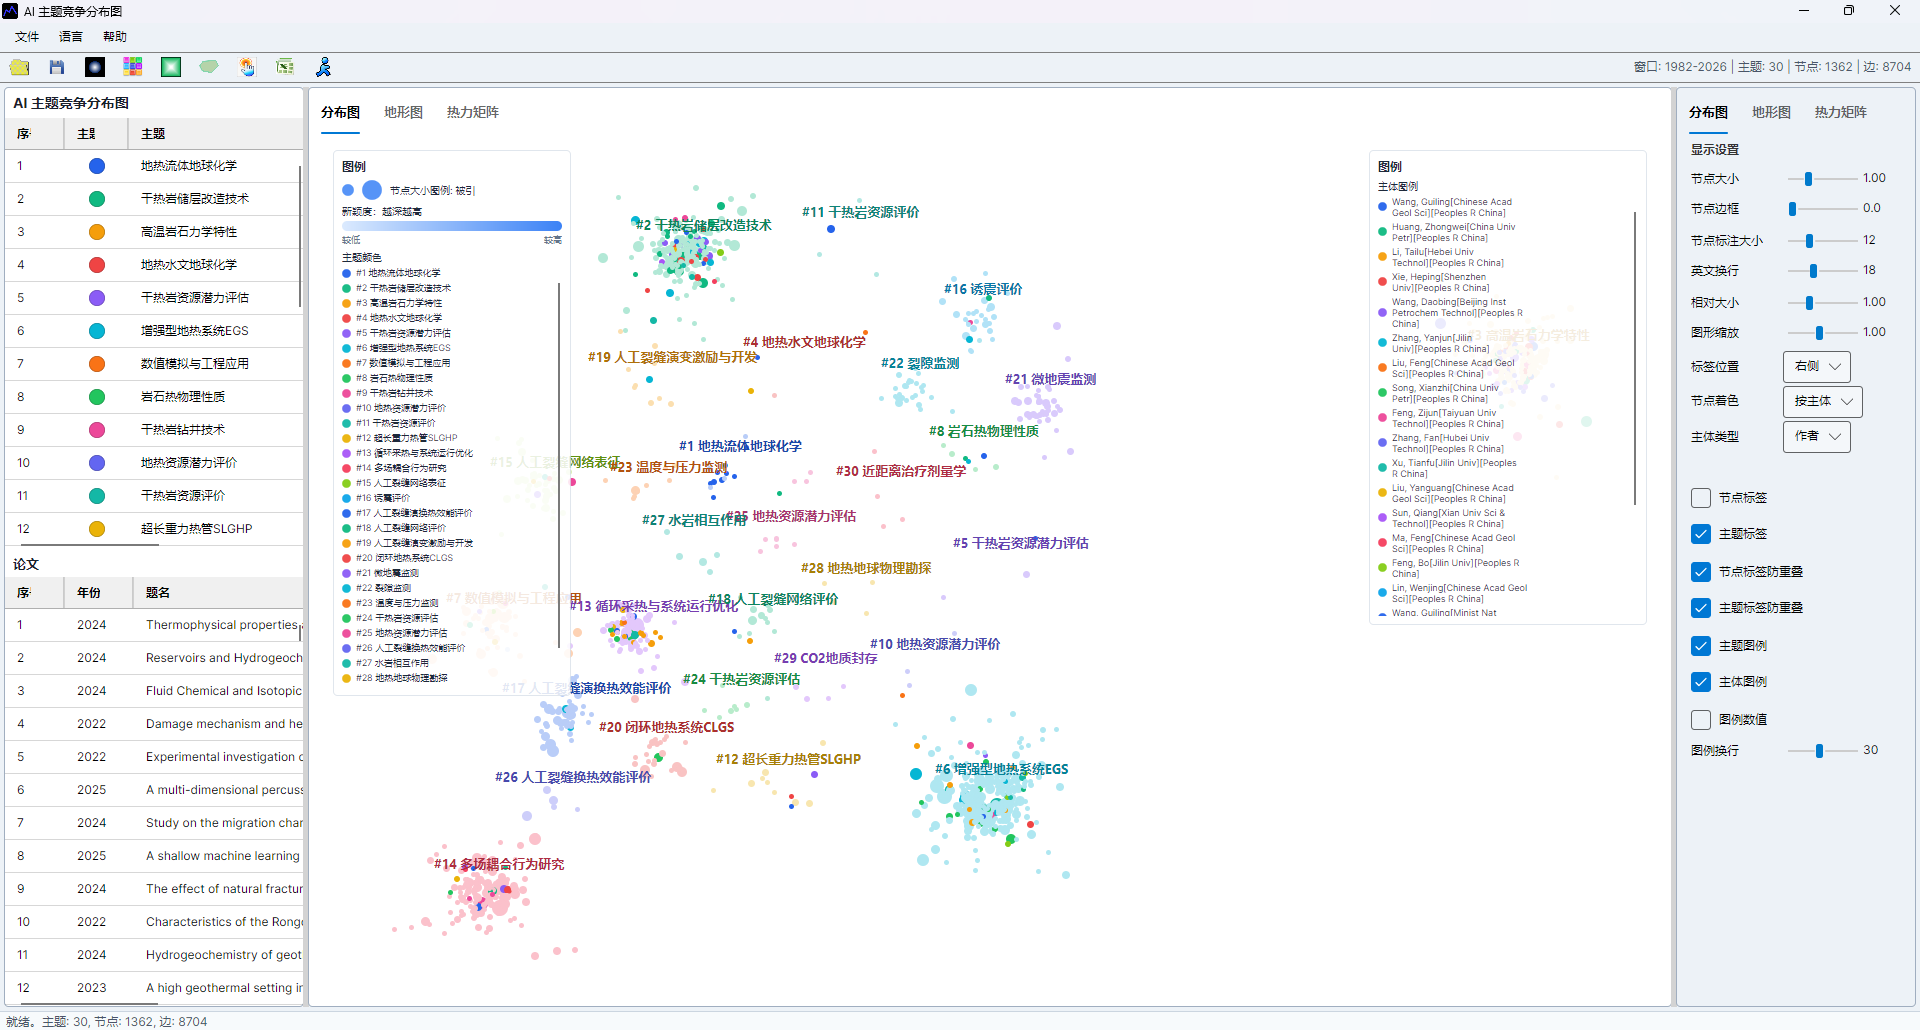
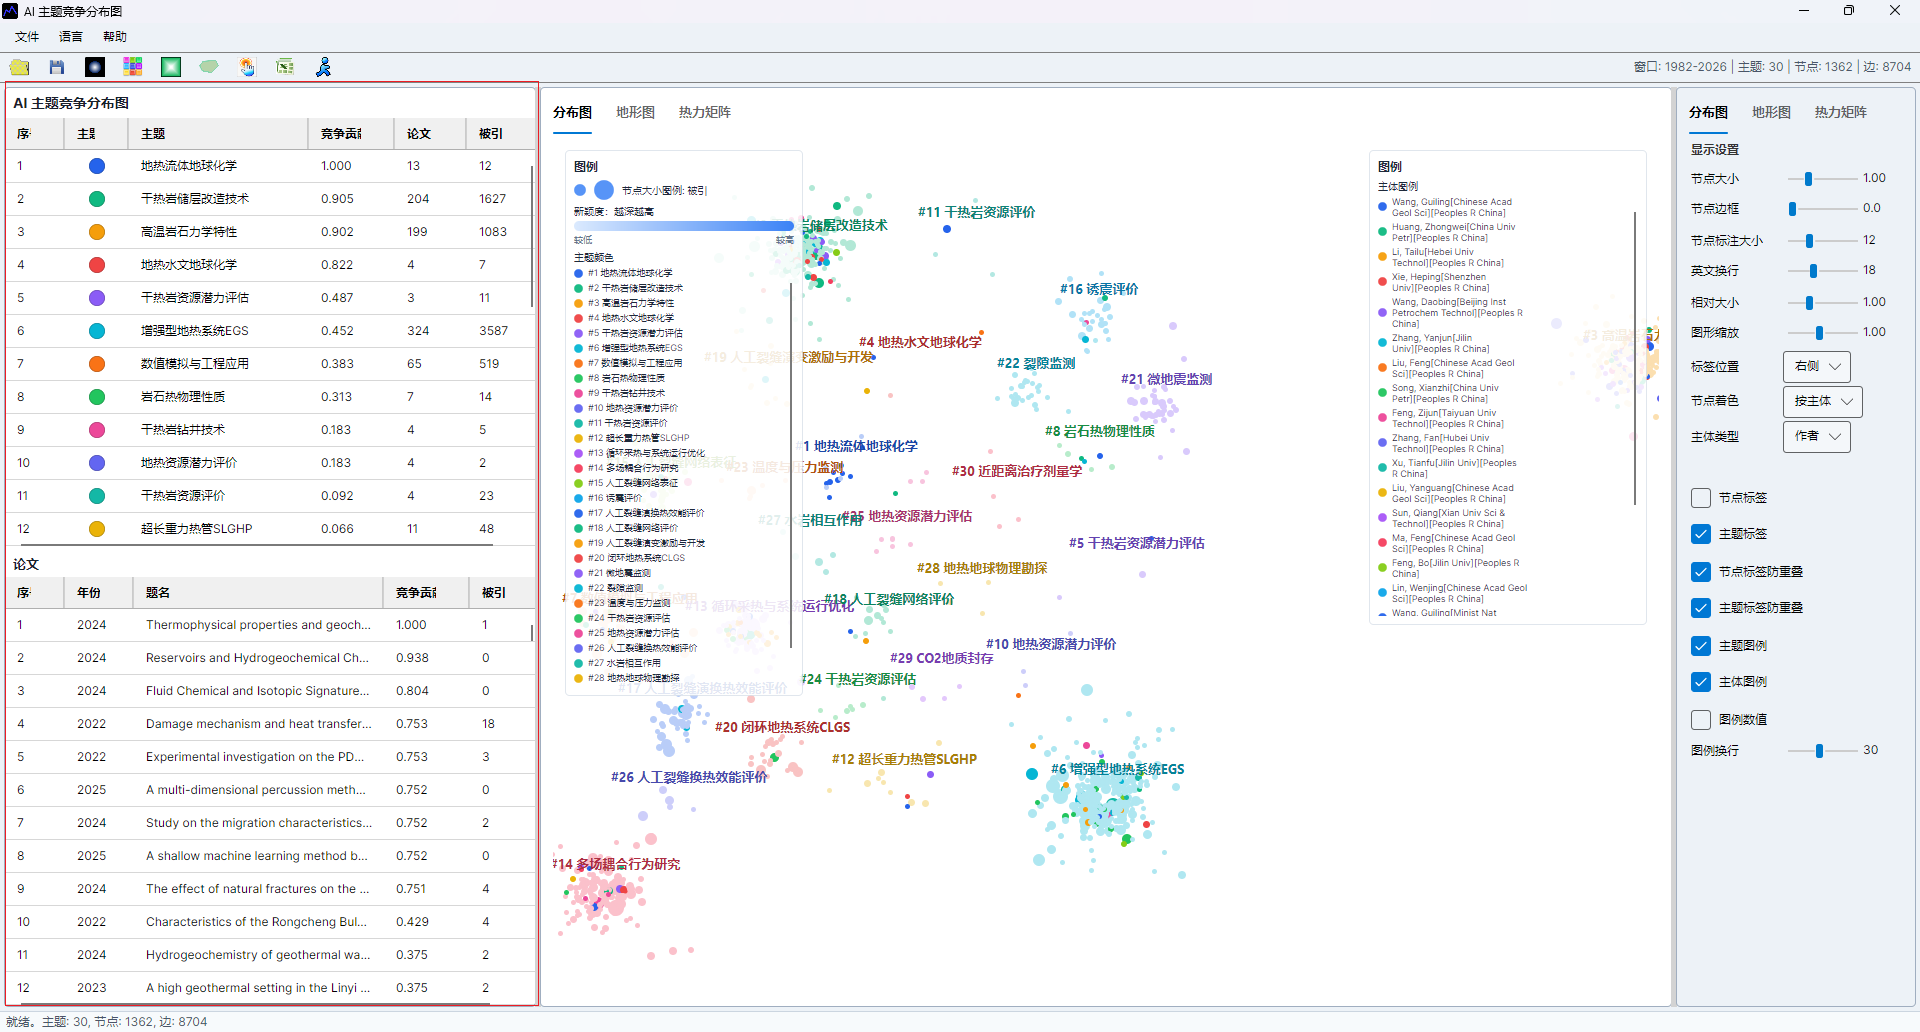
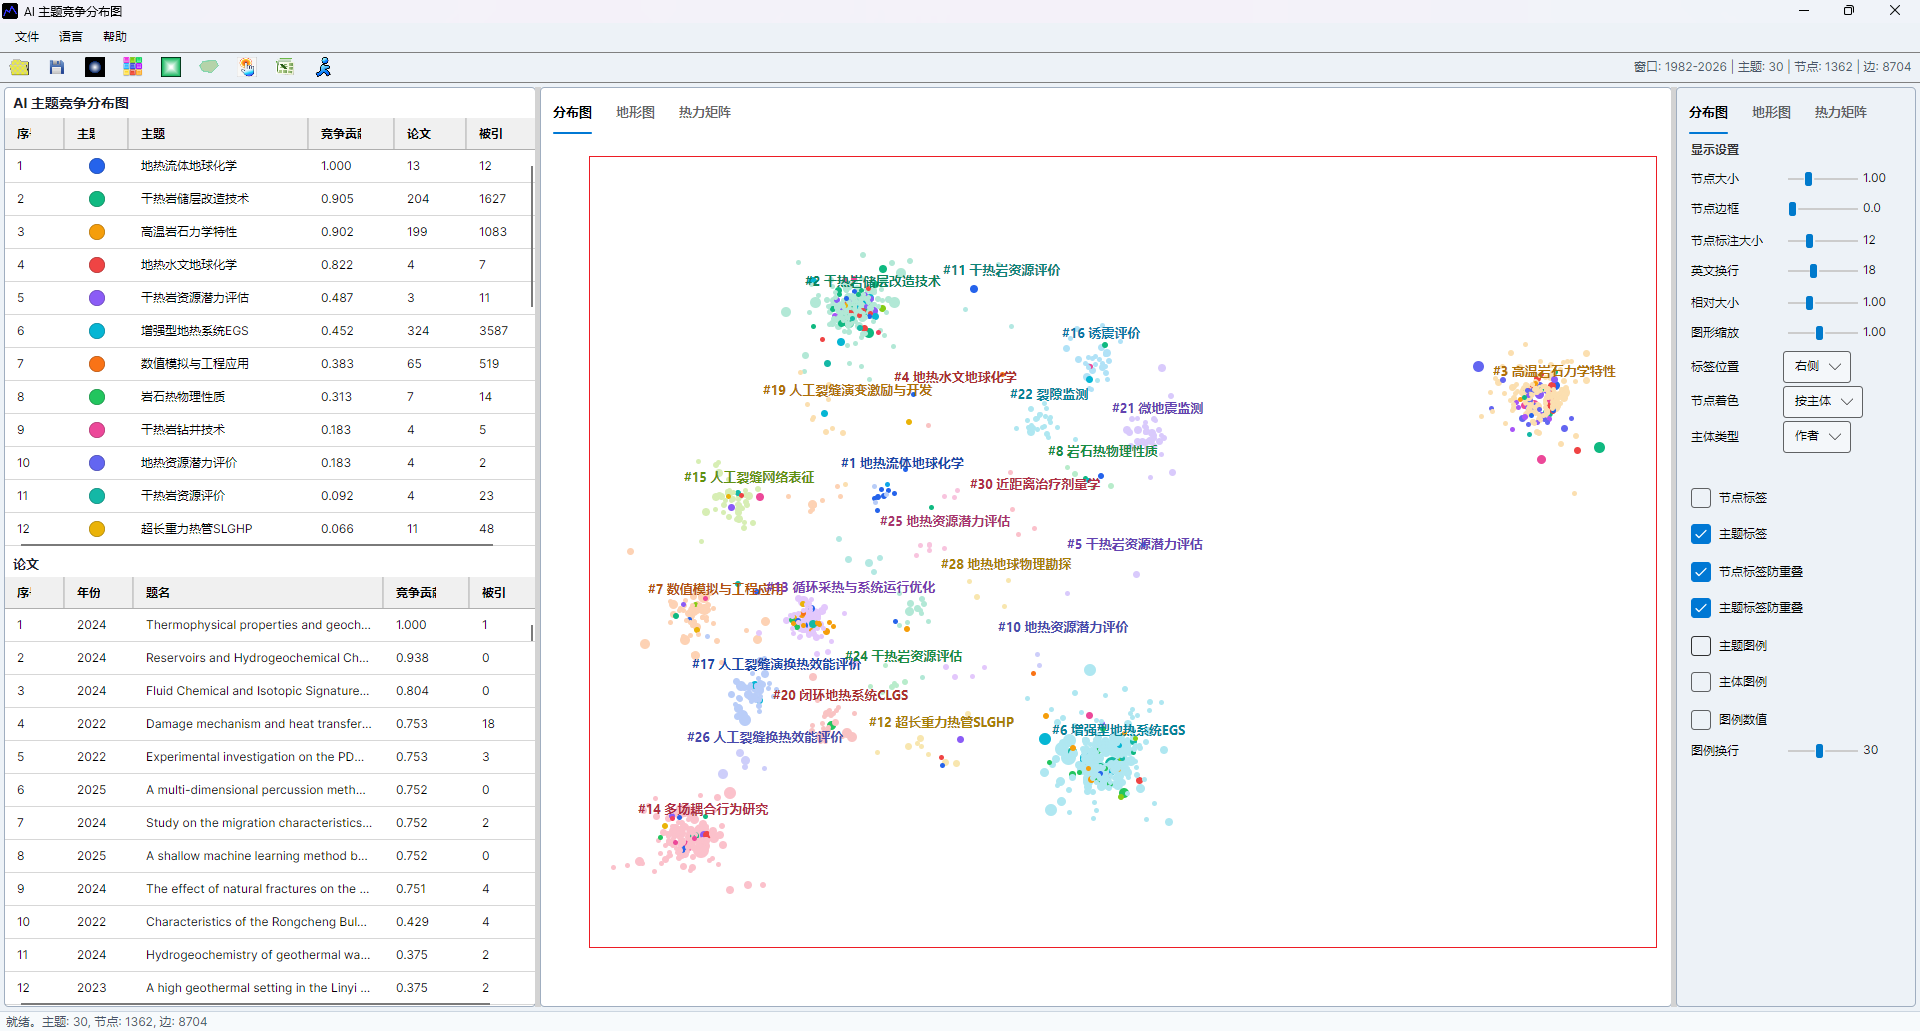
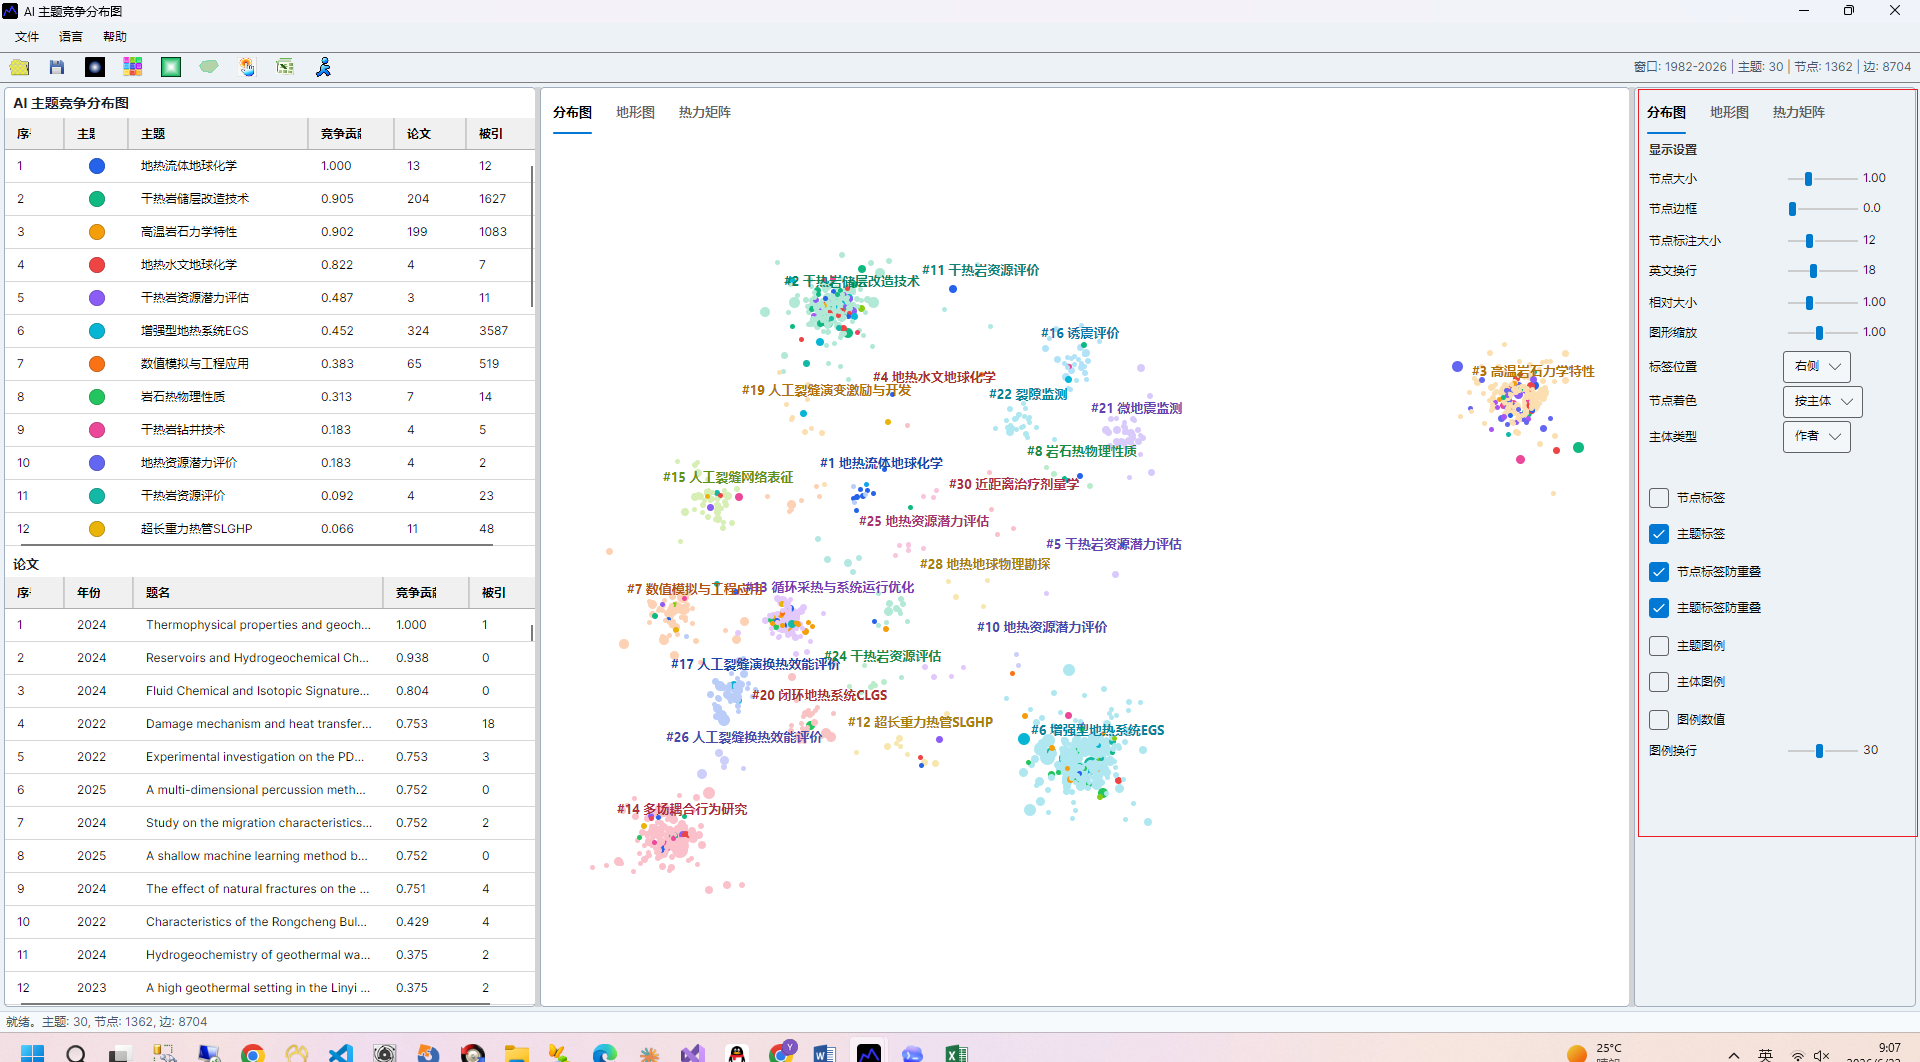
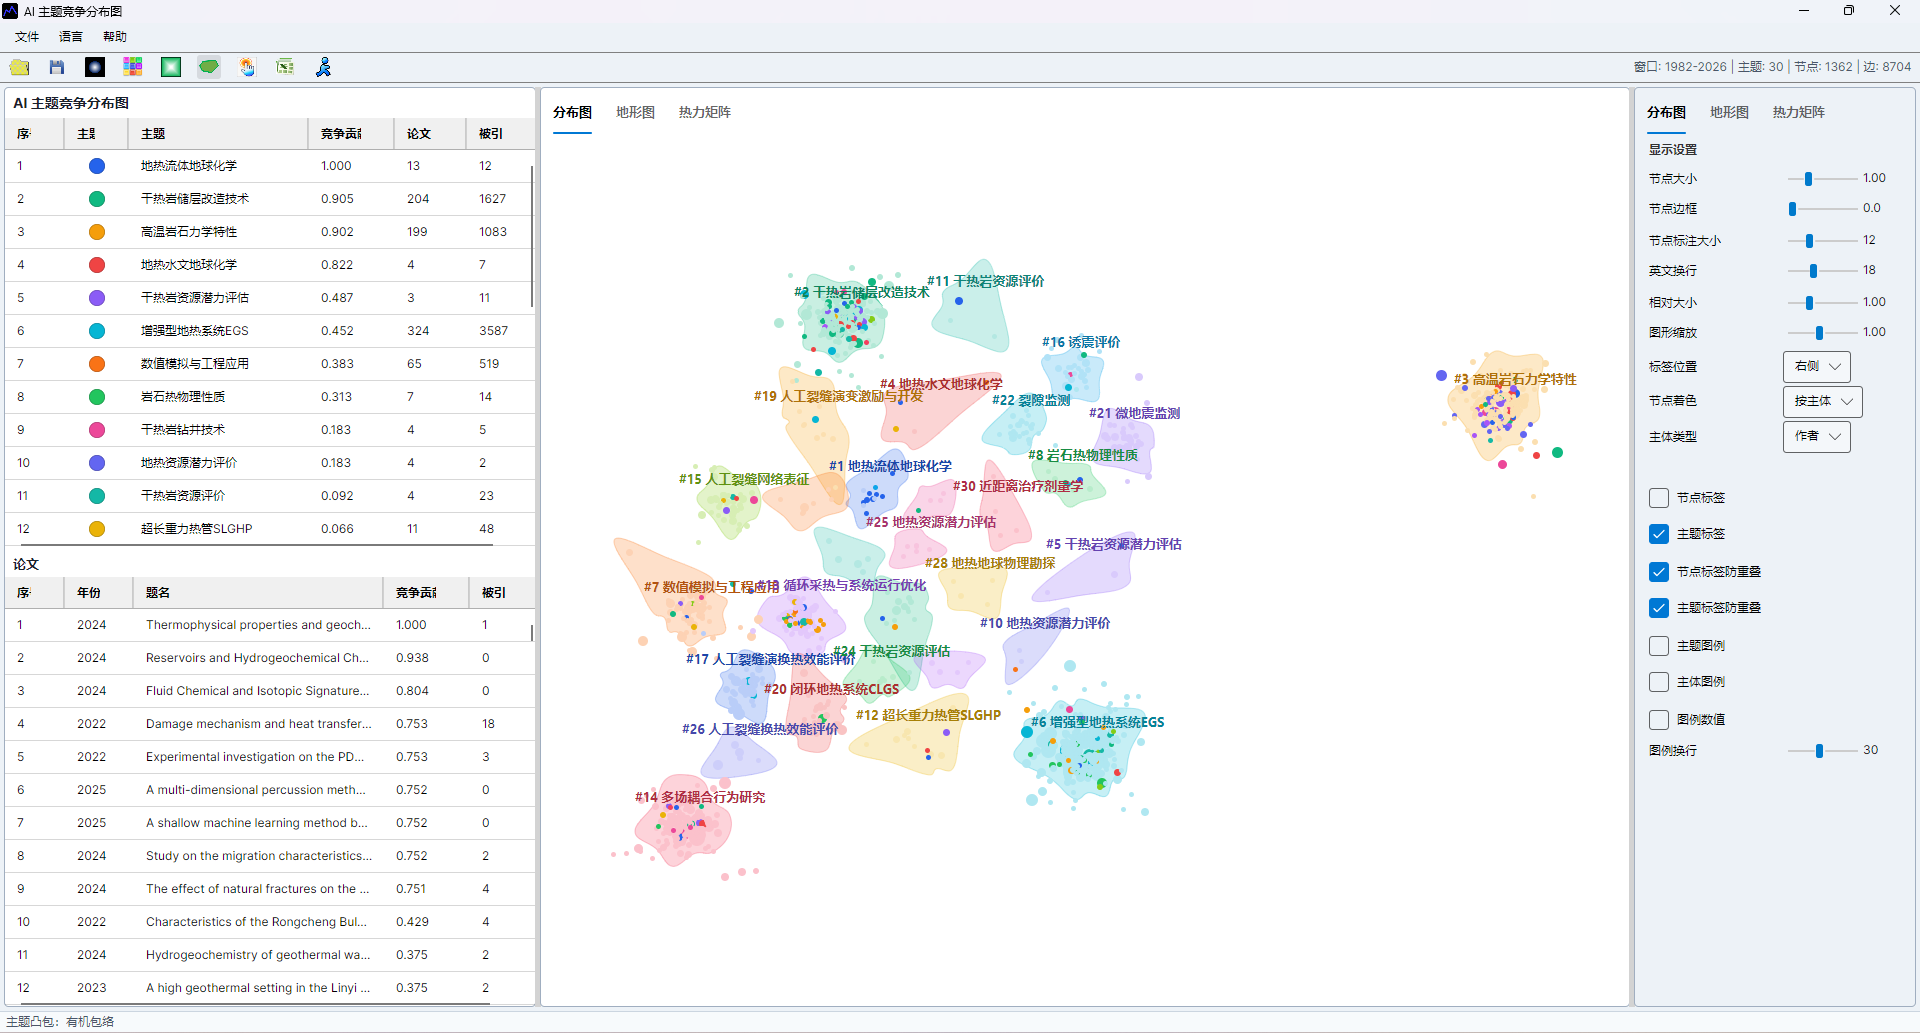
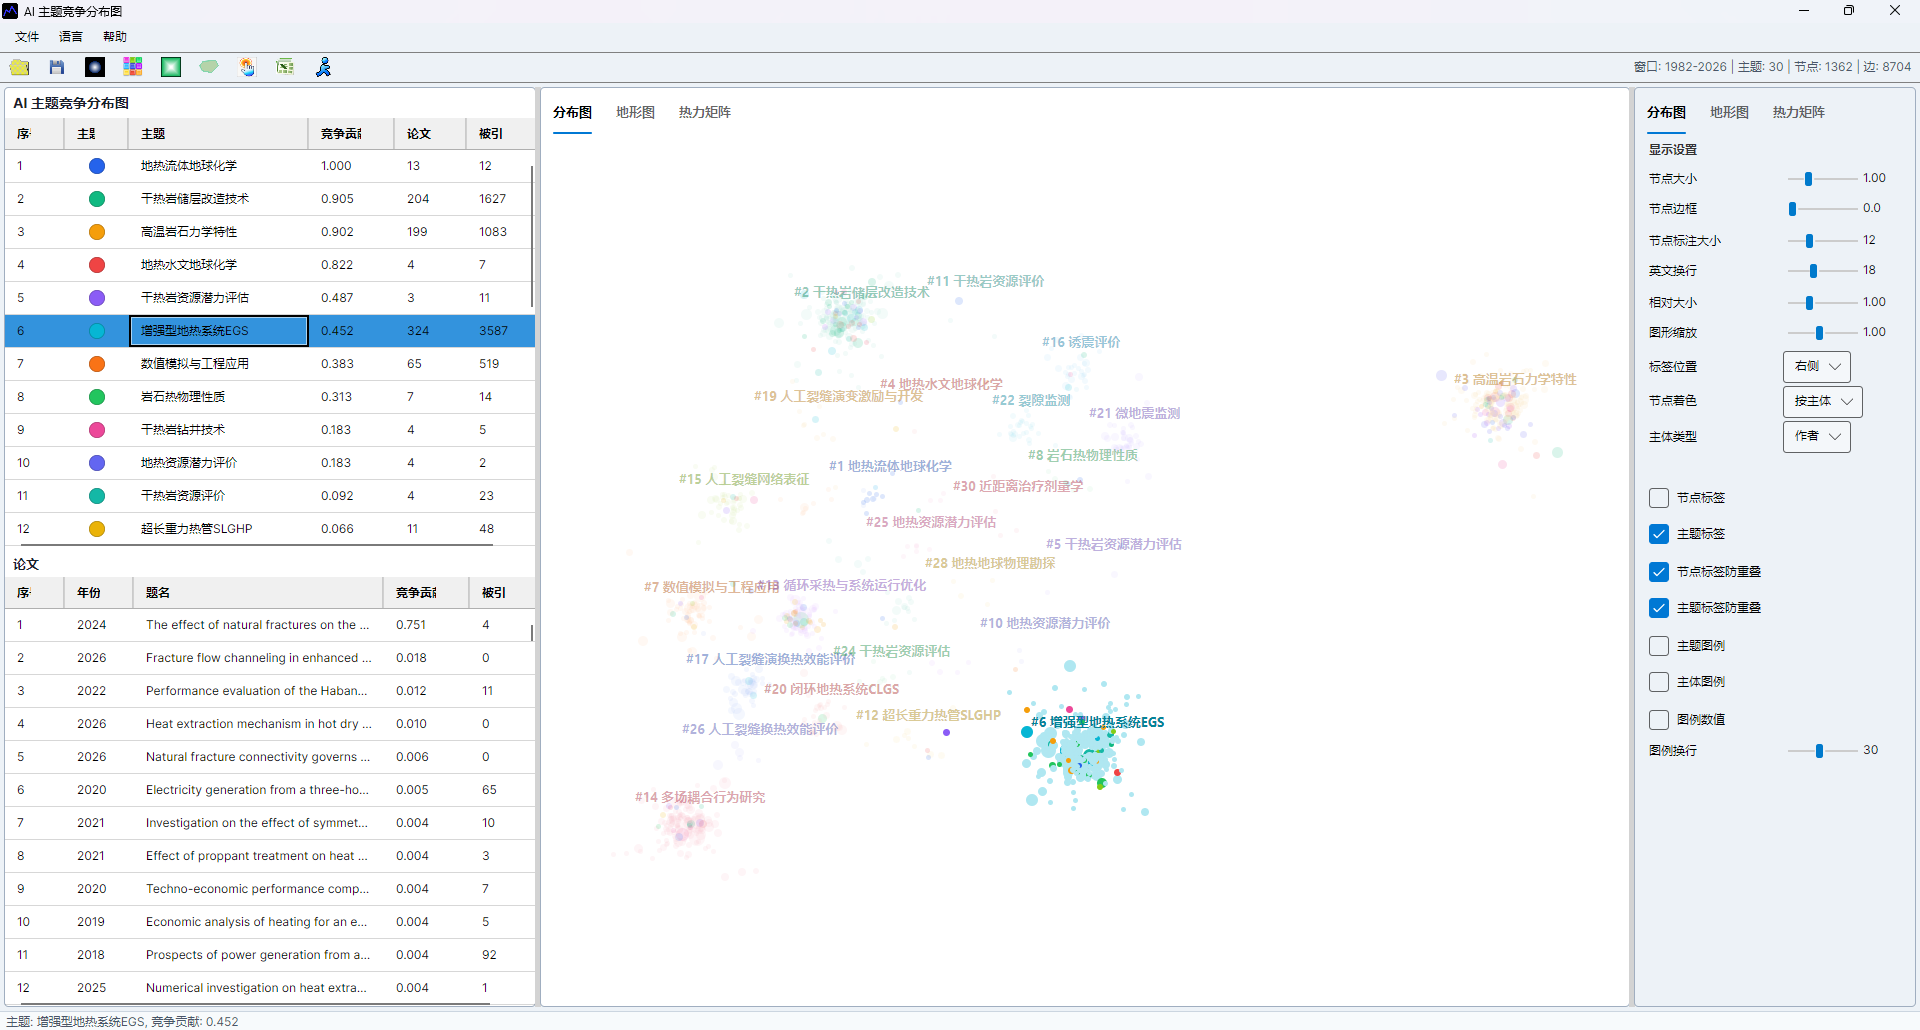
The AI topic competitiveness distribution map shows how institutions, authors, or other subjects are positioned across AI topics. It is useful for comparing strengths, identifying benchmark subjects, and explaining topic-level competitive structure.
Before You Start
- Import the literature dataset.
- Complete AI topic identification and review topic names.
- Clean or merge the subject dimension that will be compared, such as institution or author names.
- Decide whether the analysis should use all papers or only selected papers.
Export Competitiveness Indicators
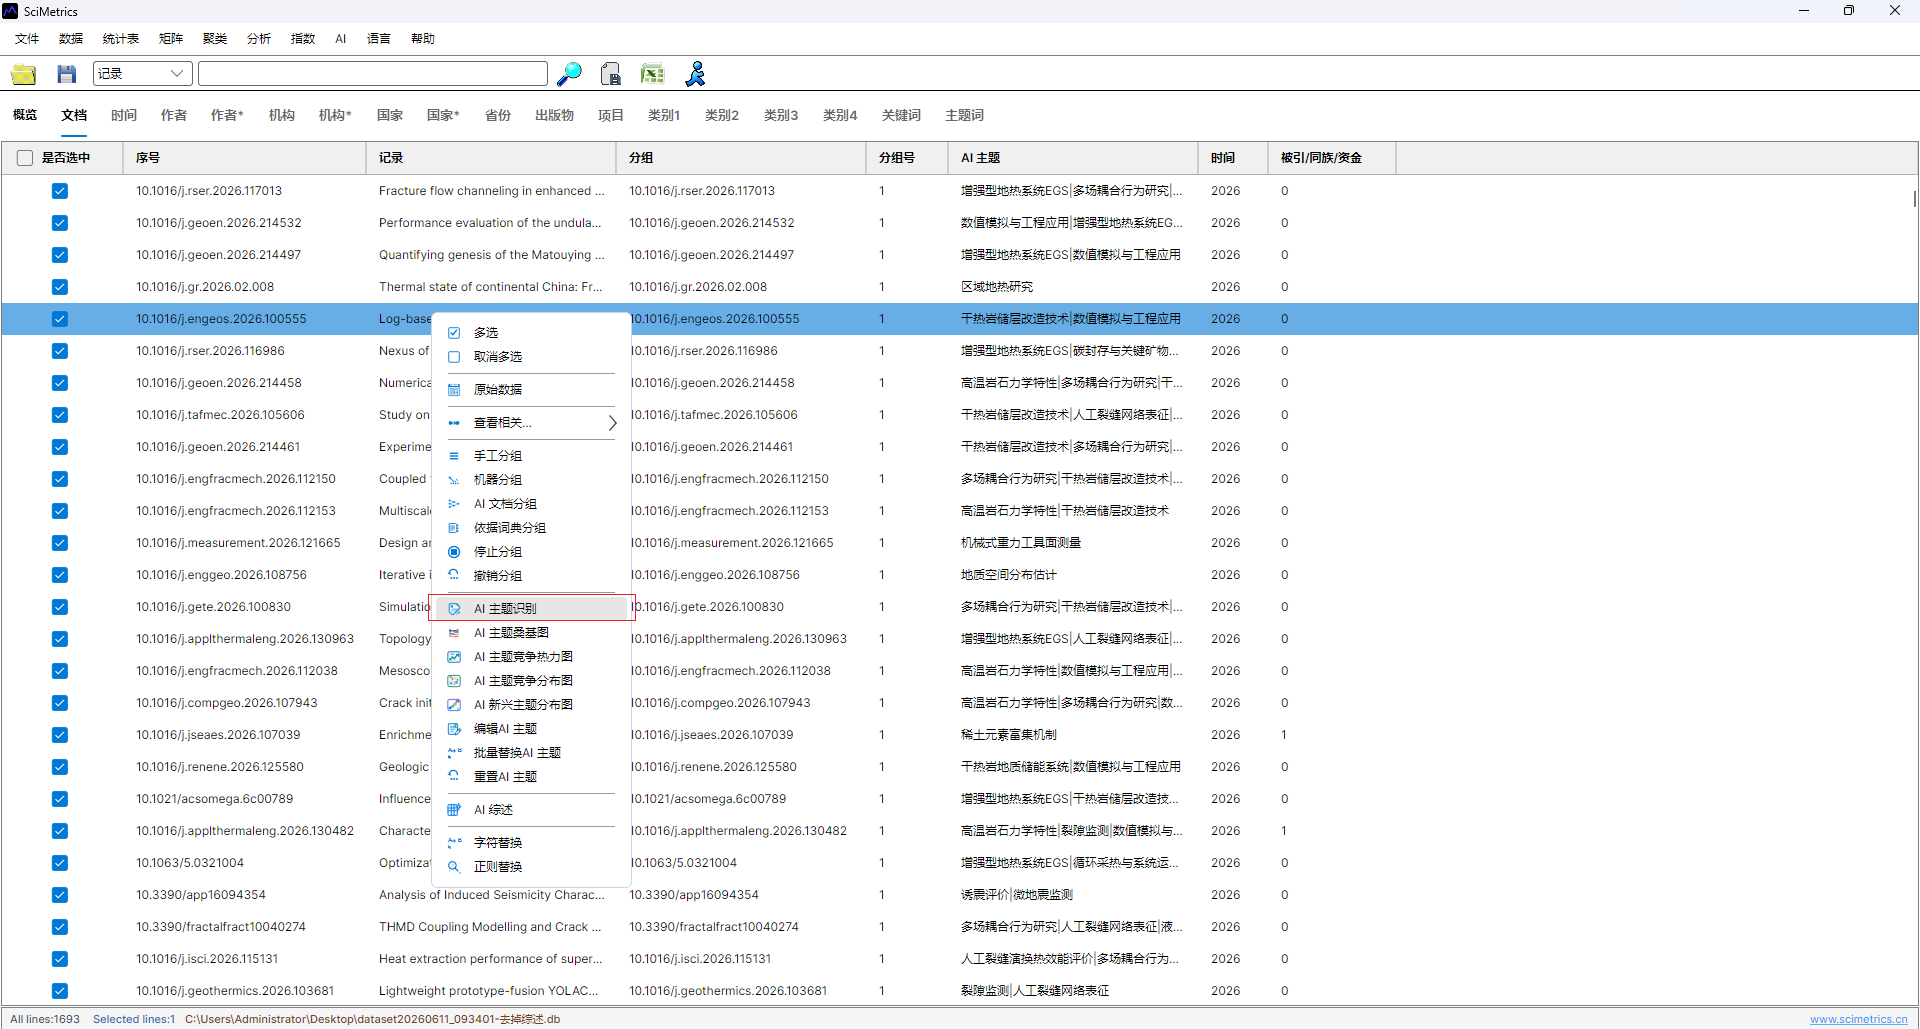
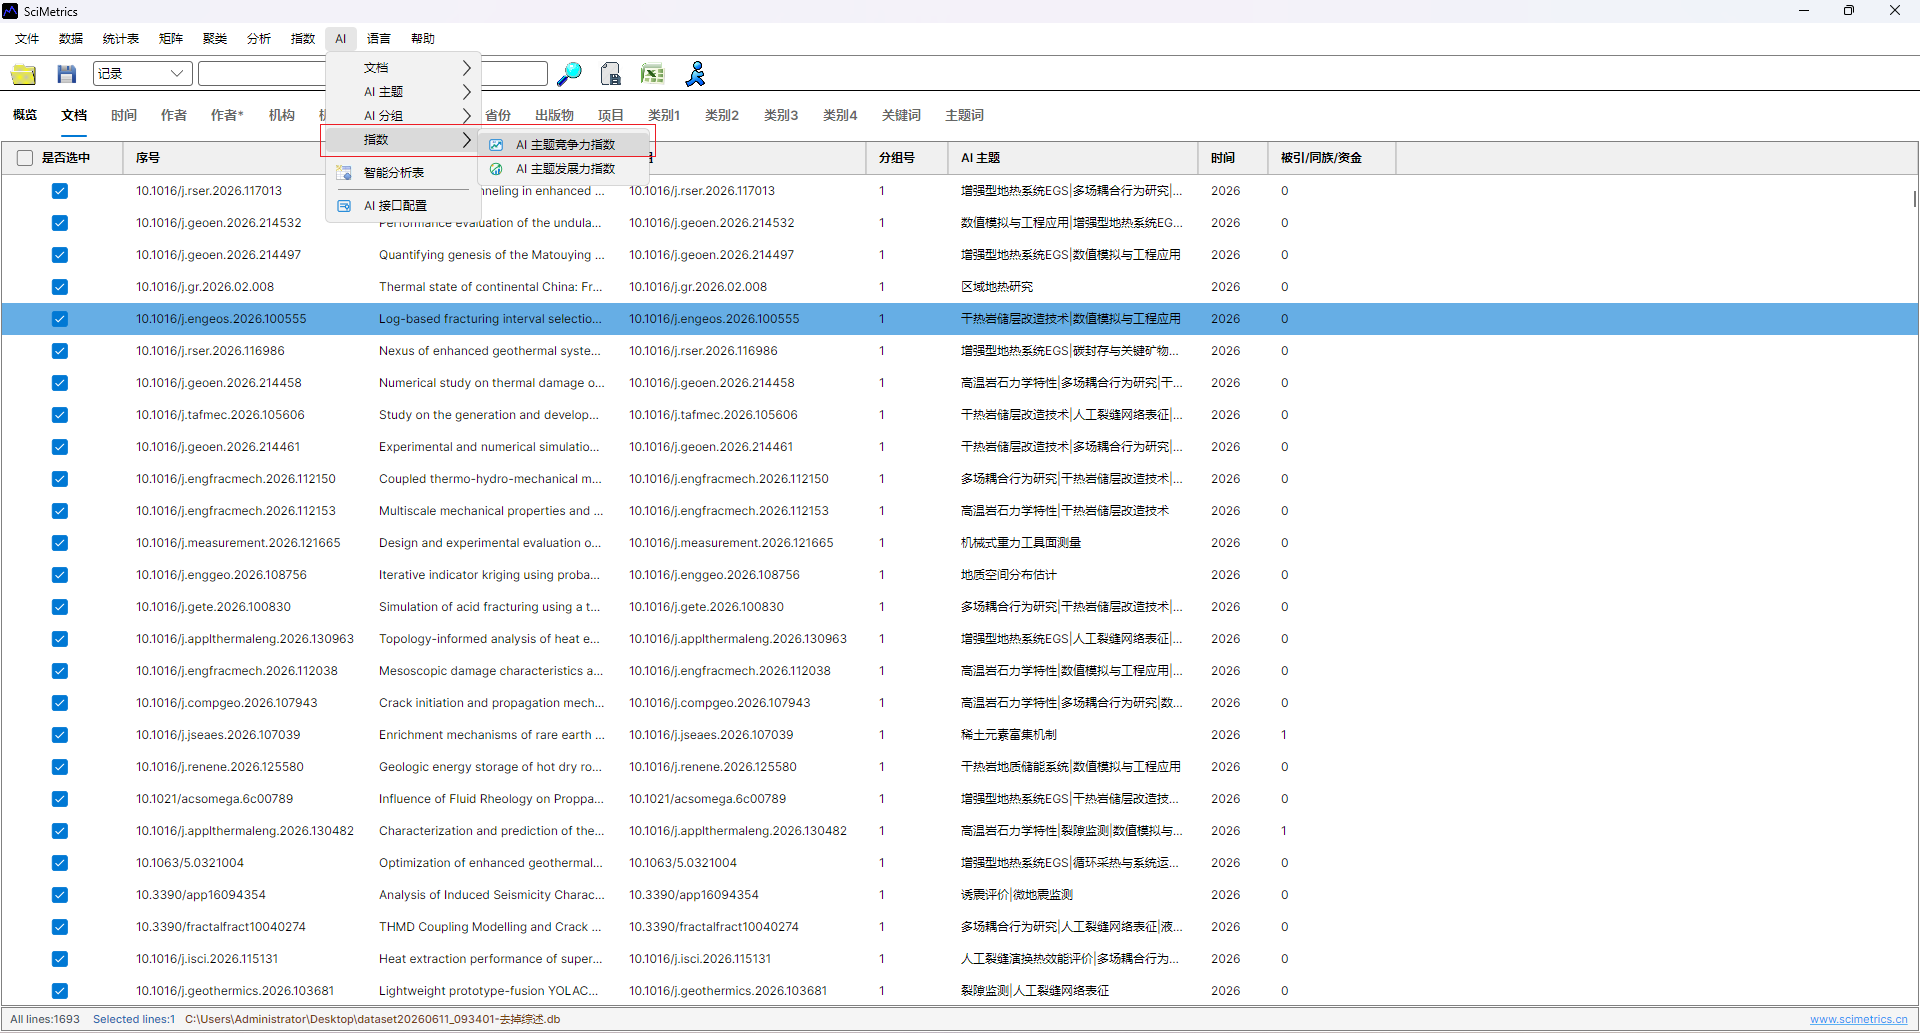
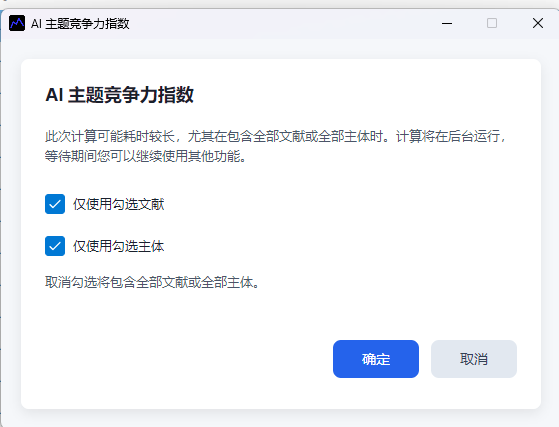
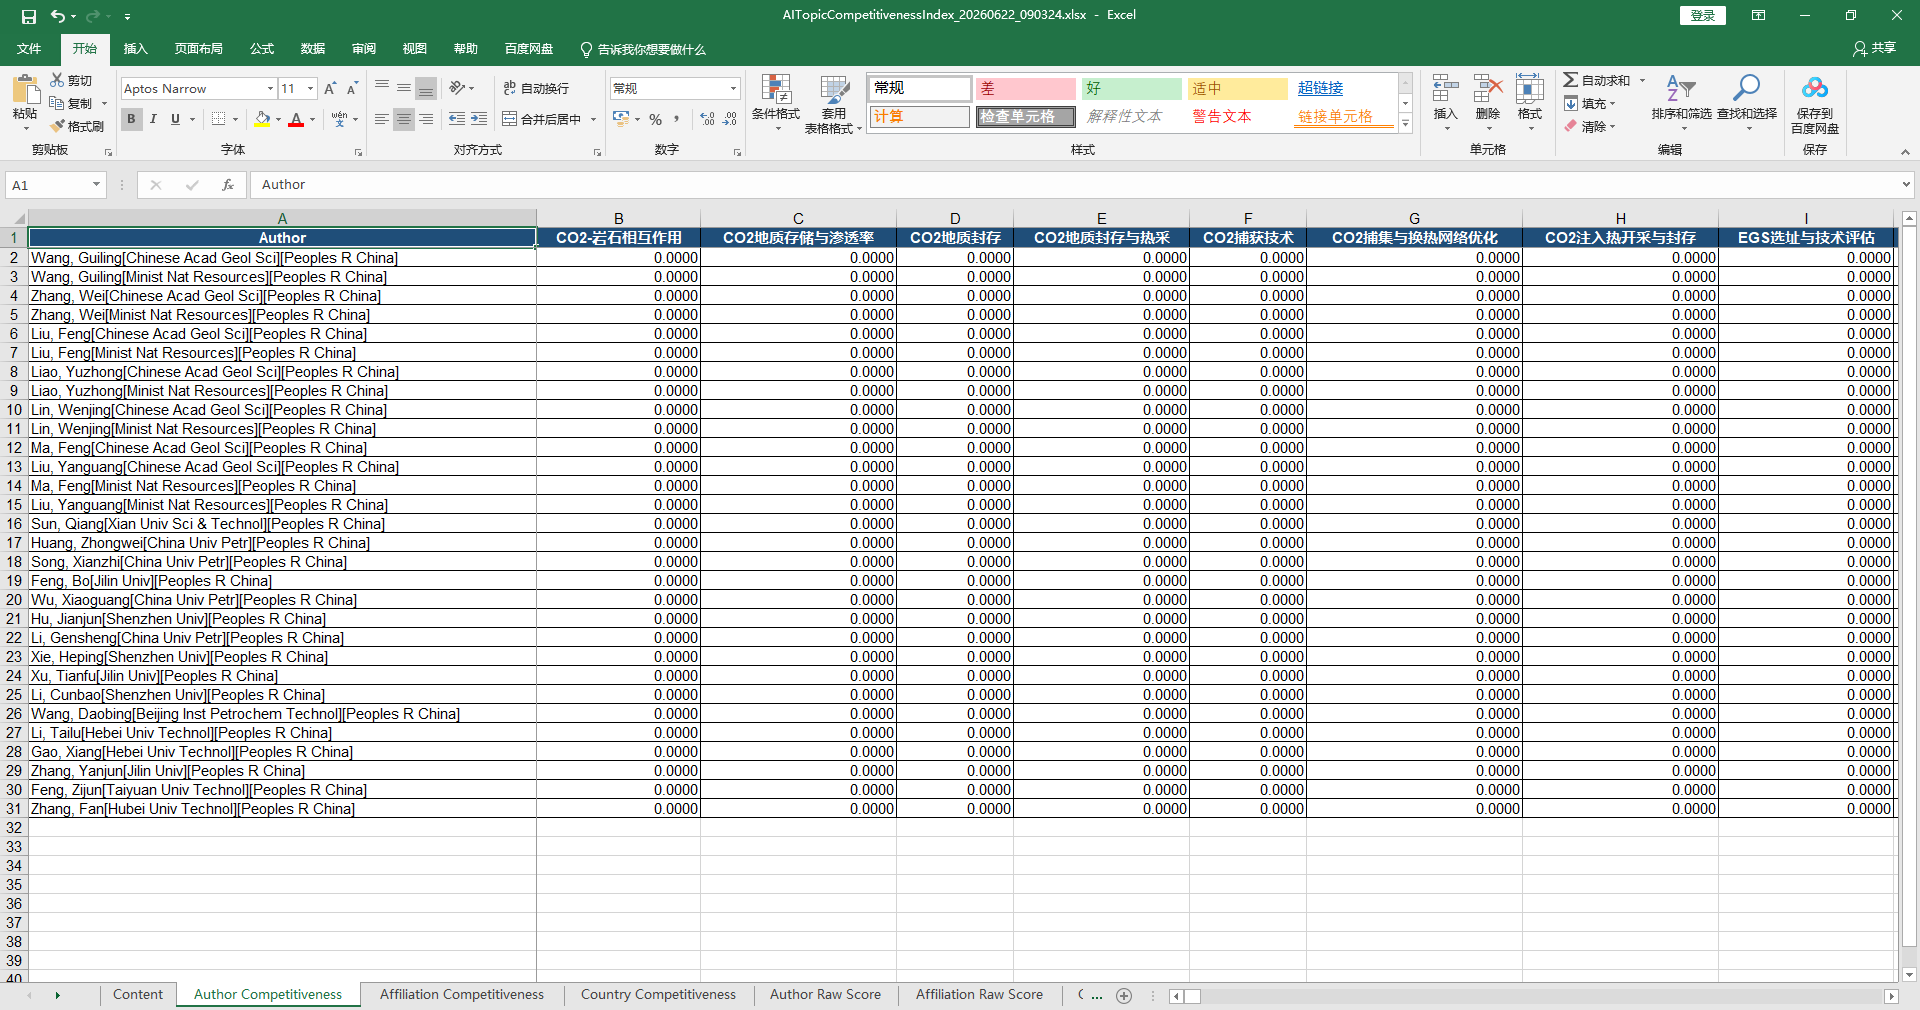
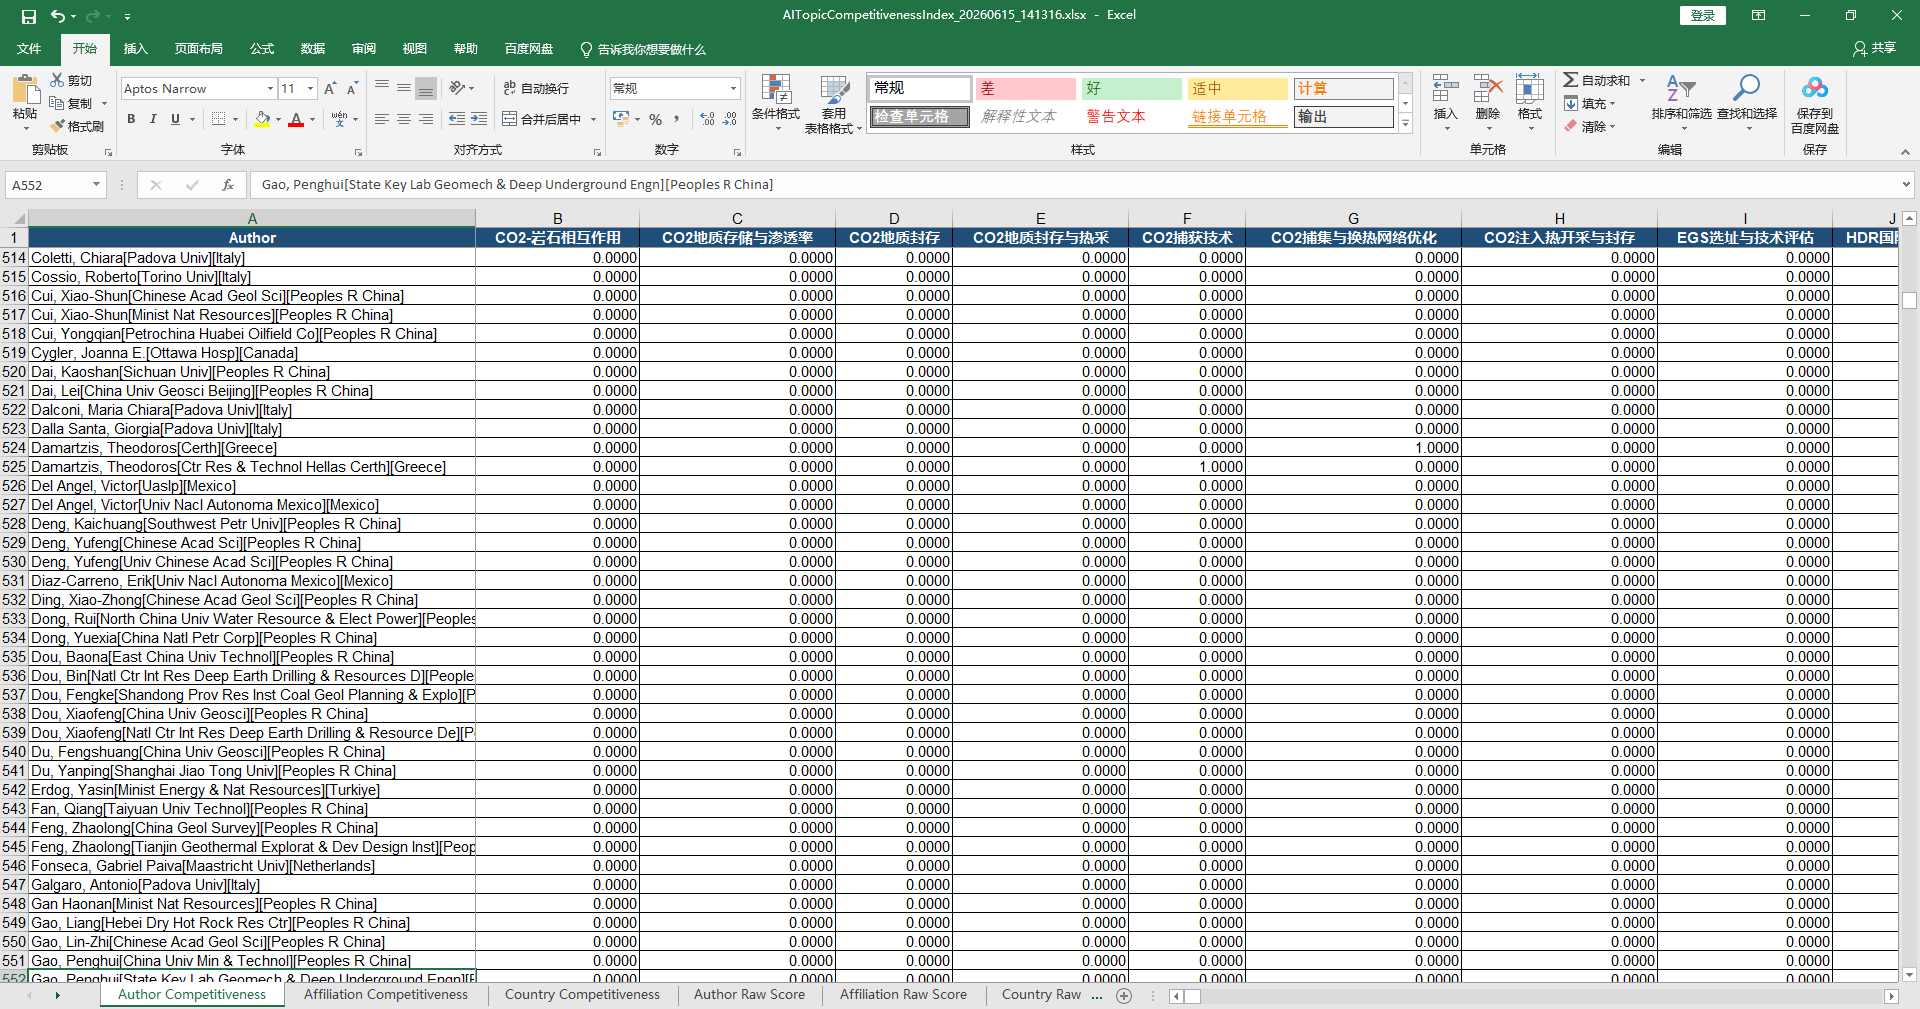
Use the AI topic competitiveness index export before or alongside the visualization. The Excel output provides a reviewable table for topic scores, subject scores, and supporting counts. Keep this file with the visualization so the chart can be checked later.
Build The Distribution View
- Open the AI topic competitiveness distribution function.
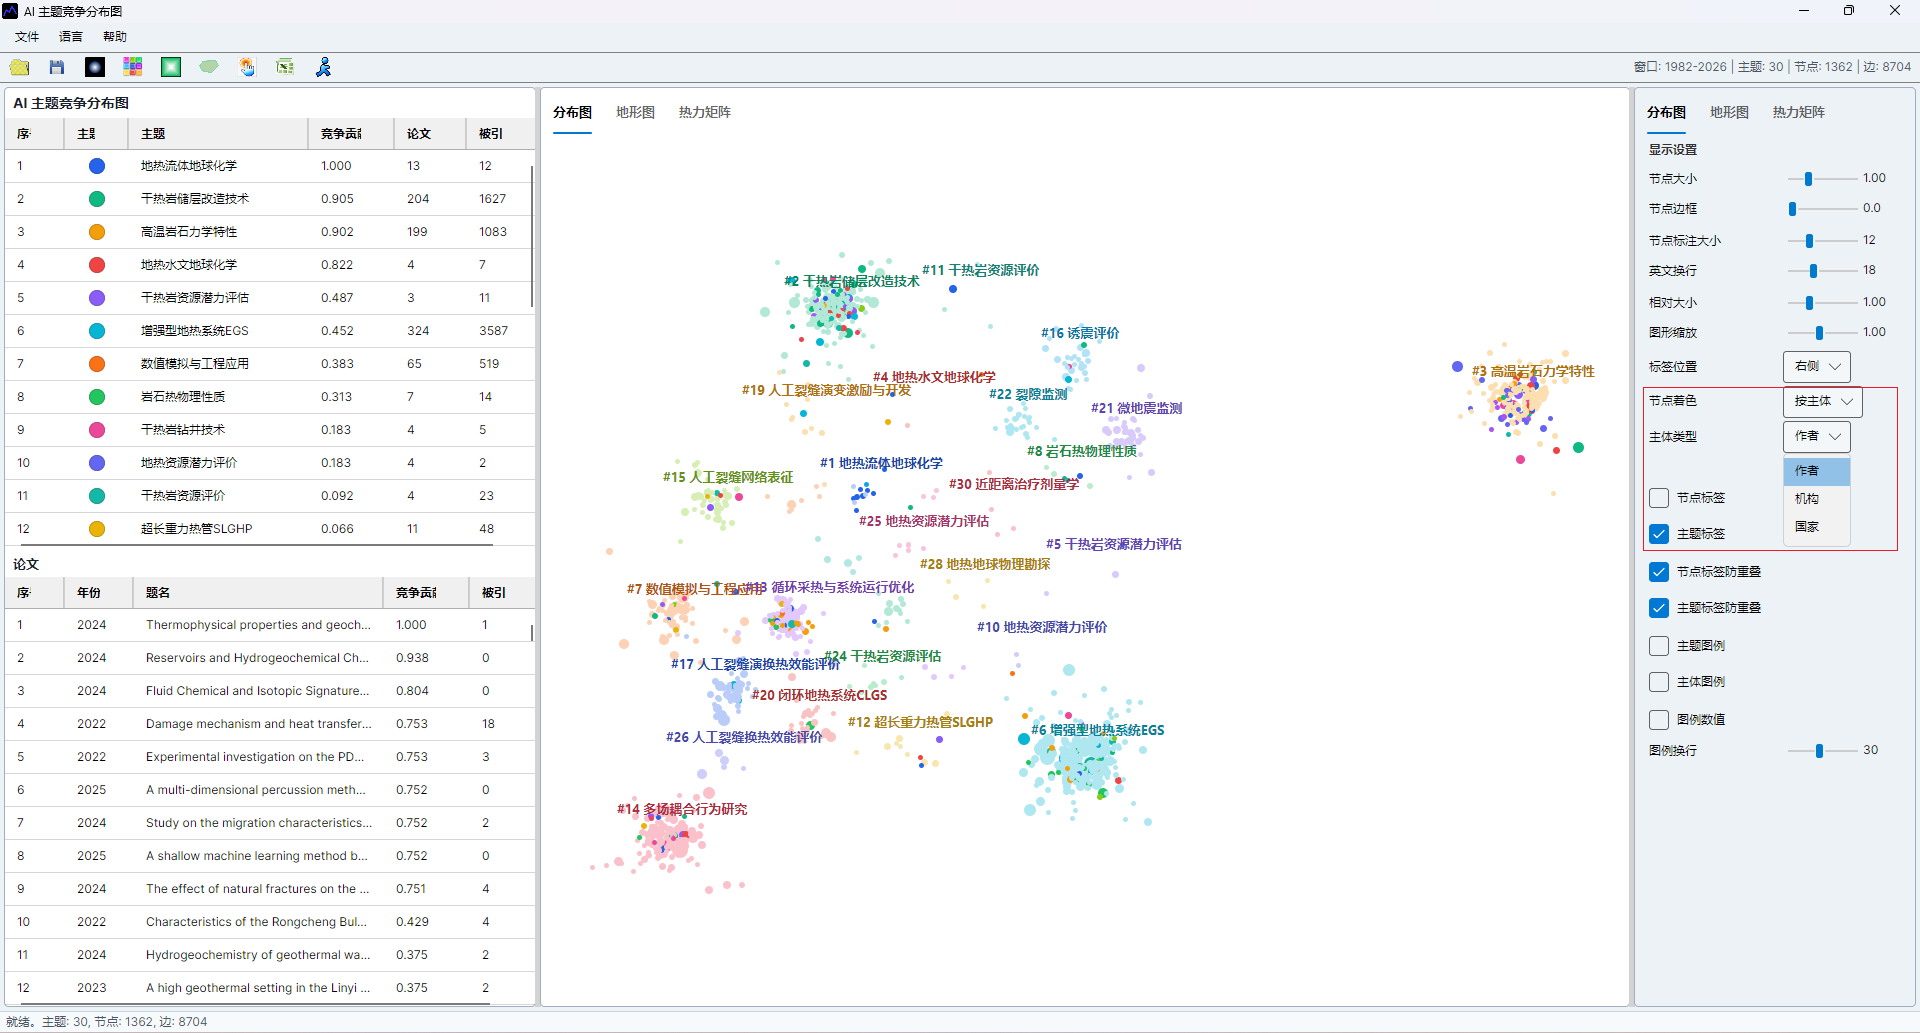
- Select the comparison subject, such as institution, author, country, or another supported dimension.
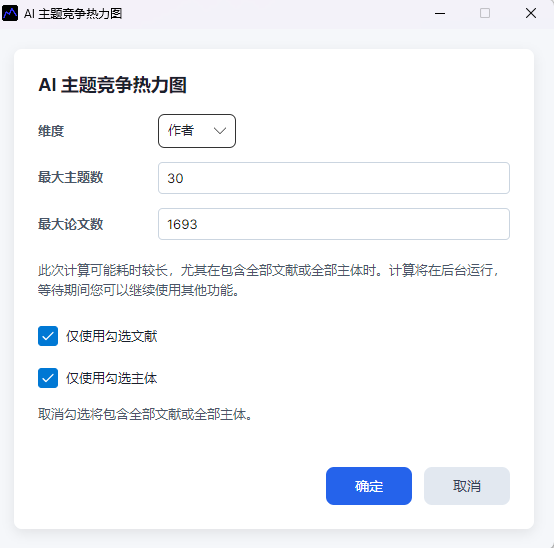
- Set the topic and subject limits.
- Generate the distribution map.
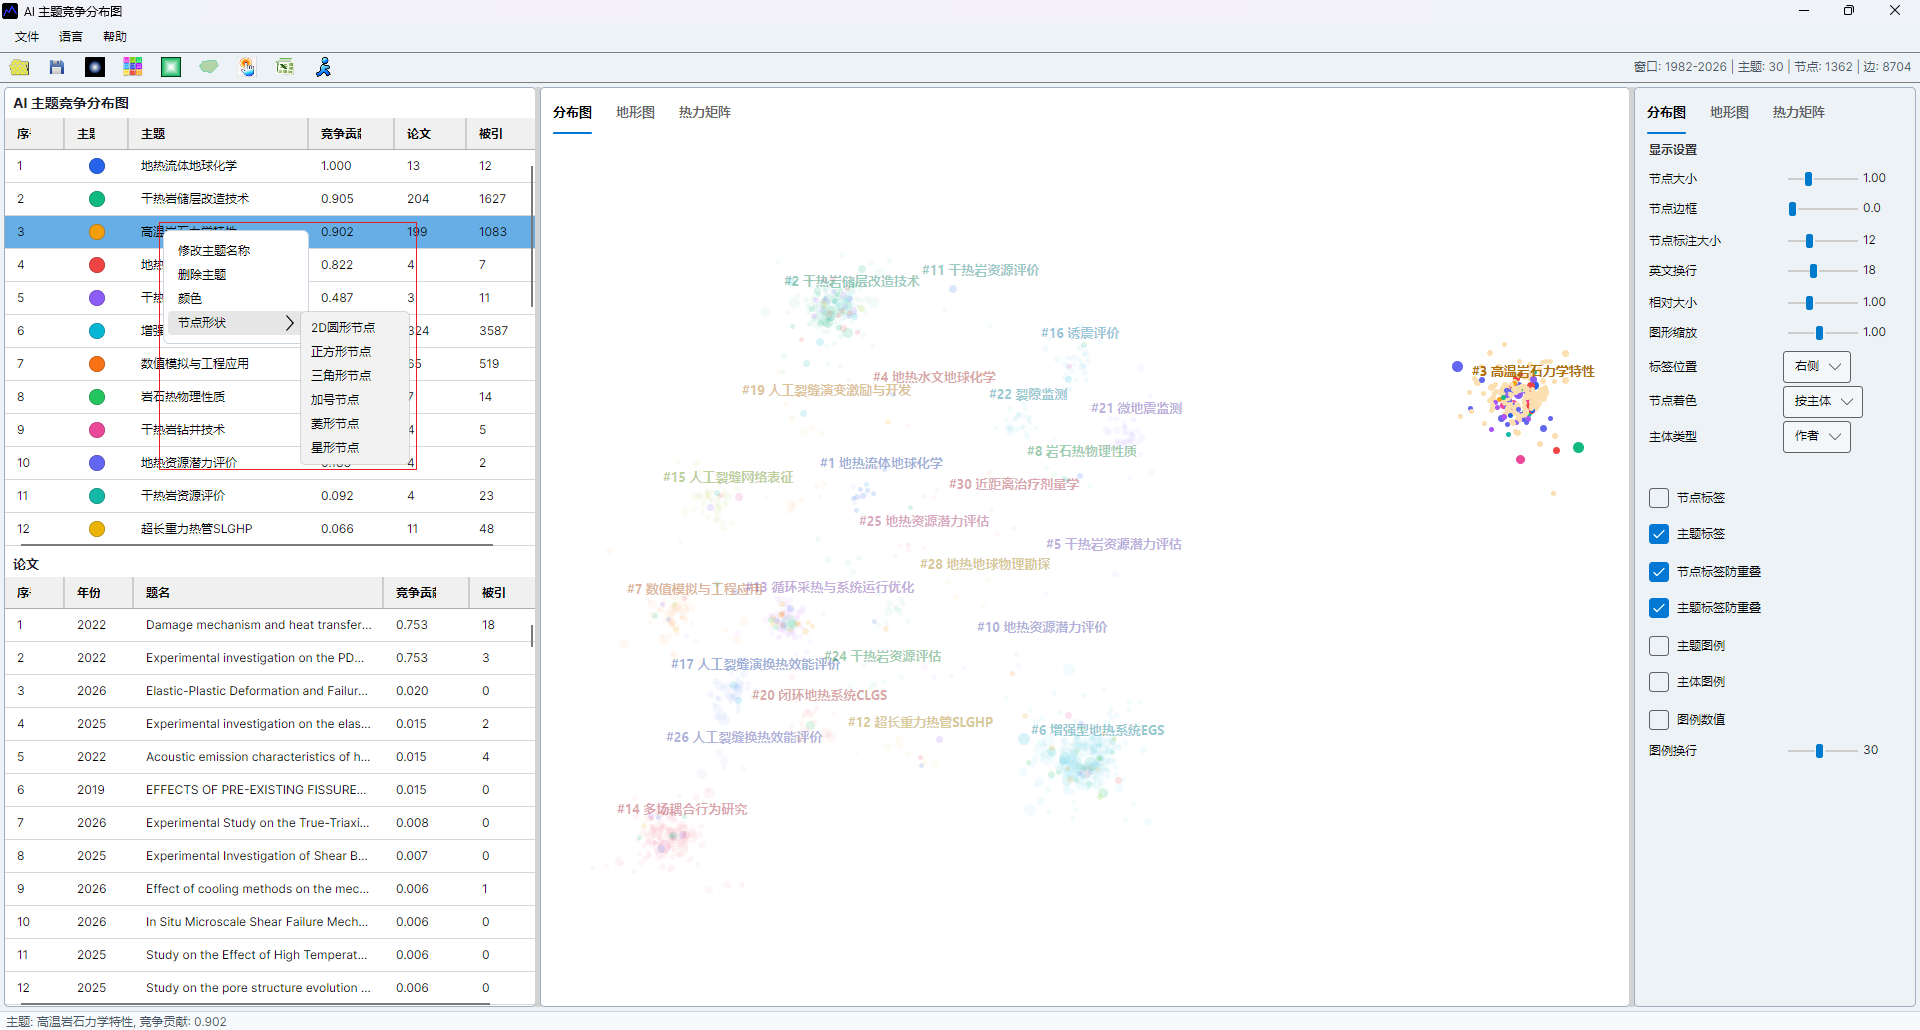
- Use the topic list and paper list to inspect the evidence behind a visible cluster.
Reading The Result
The distribution view helps answer where each subject is strong, whether a subject is concentrated in a few topics, and whether multiple subjects compete in the same topic space. Do not rely on position alone; verify the subject-topic relationship with the paper list, the exported table, and the original records.
For formal reports, export both the figure and the Excel data. The figure is used for communication, and the table is used for traceability.
Topic Hull Settings
The competition-distribution view and AI Emerging Topic distribution share the same topic-hull implementation. Membership comes only from existing AI topic labels. Institution or author colors and spatial distance do not regroup nodes, and a topic is not split into multiple sub-hulls, preserving the one-topic, one-outline meaning.
The right-side Minimum Topic Hull Nodes setting defaults to 3 and accepts 2–5. At 2, two same-topic nodes at different positions form a round-ended capsule. At the default 3, two-node topics are omitted. Single-node topics never draw a hull. Values 4 and 5 can hide topics with weak membership counts.
Organic hulls now use rounded paths that remain inside their neighboring boundary segments, avoiding tails on elongated outlines. Padding grows with the largest rendered node and zoom. Borders use a slightly darker shade of the topic fill color. Screen and SVG export share the same boundary calculation, so export does not substitute a different hull.
MCP and Automation API Control
Ask a connected model in plain language:
Use the scim MCP on the current AI Topic Competition Distribution view.
Keep the existing AI topic membership, set Organic topic hulls, and set minimum topic hull nodes to 2.
Export the distribution page to D:\Research\Output\topic-competition-hulls.svg and verify the output file.
The deterministic command is:
{
  "command": "visual.set_ai_topic_visual_options",
  "args": {
    "view": "distribution",
    "topicHullMode": "organic",
    "topicHullMinNodeCount": 2
  }
}
In cycle order, topicHullMode accepts none, natural, organic, and convex; natural is an independent Natural Smooth effect. The toolbar cycles Off, Natural Smooth, Organic, Convex, then Off. Export with visual.export_ai_topic_visual_window. Direct local clients can POST the same JSON to http://127.0.0.1:37618/api/automation/command. MCP users normally do not need to enter the URL or write JSON. The command targets an already open Desktop window.
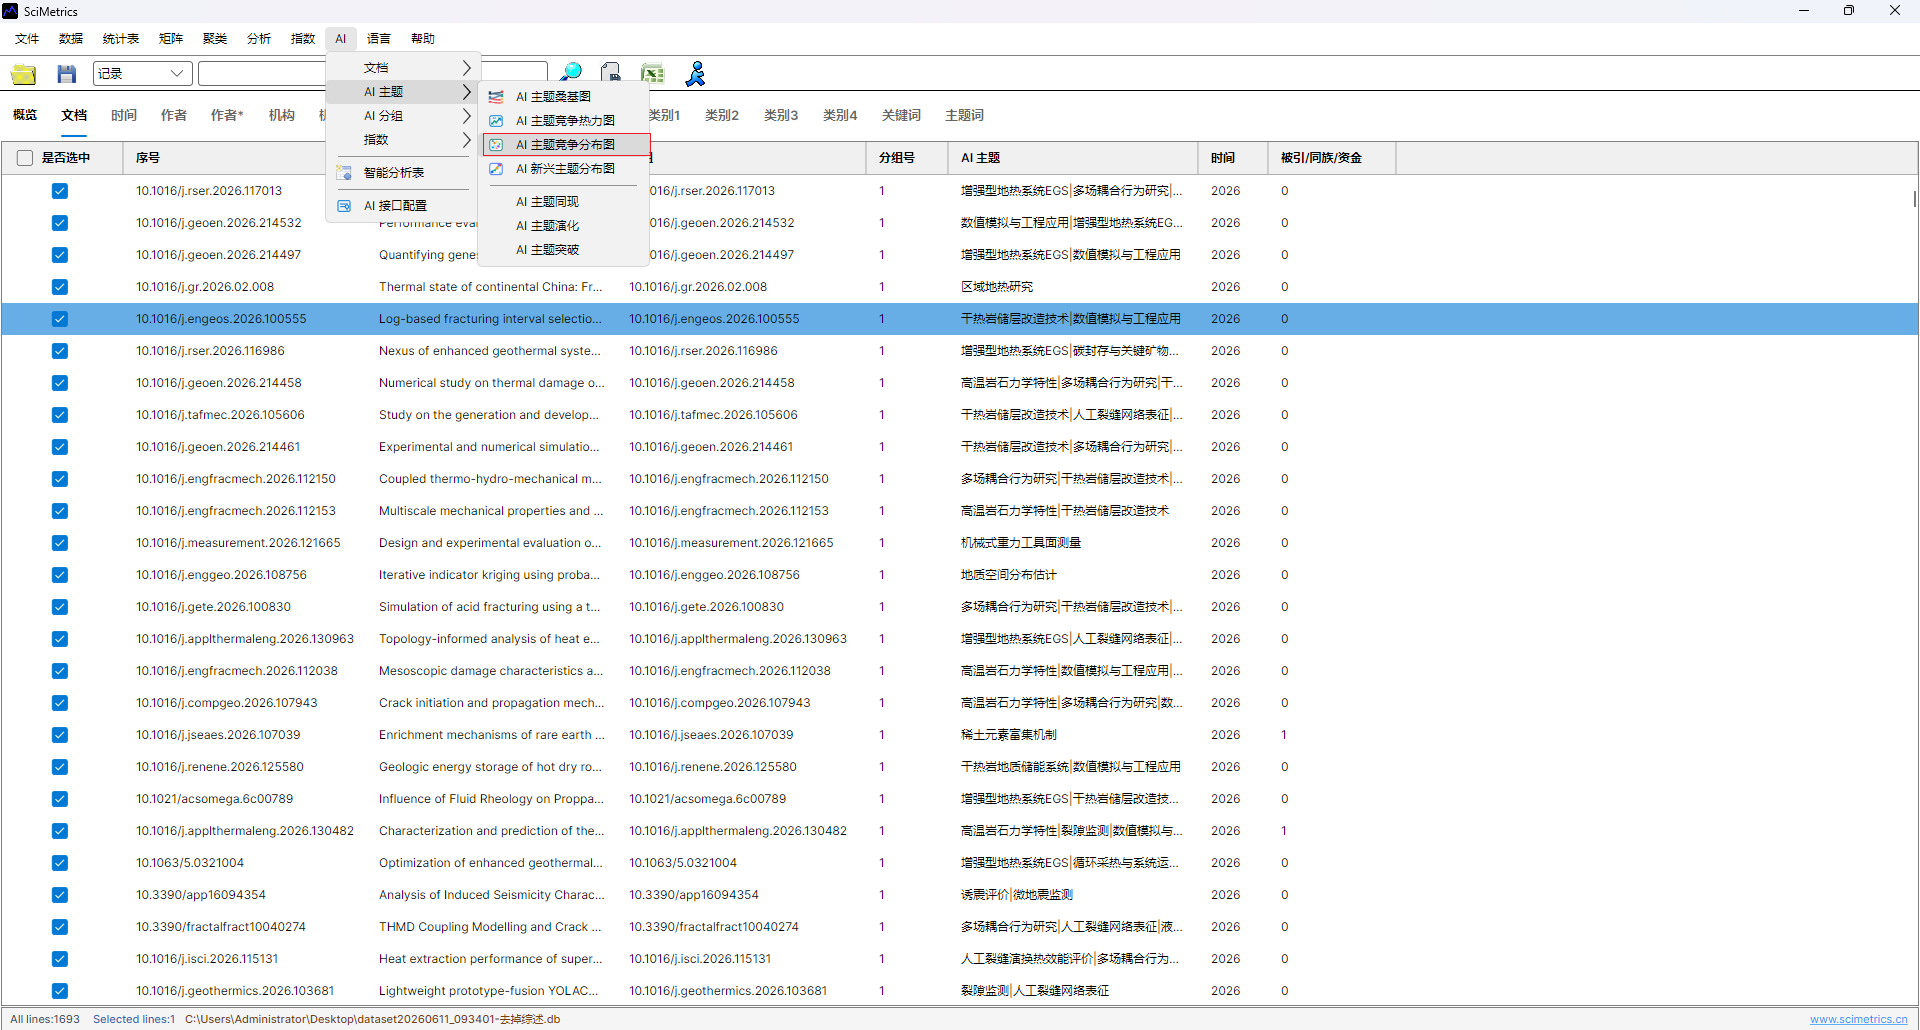
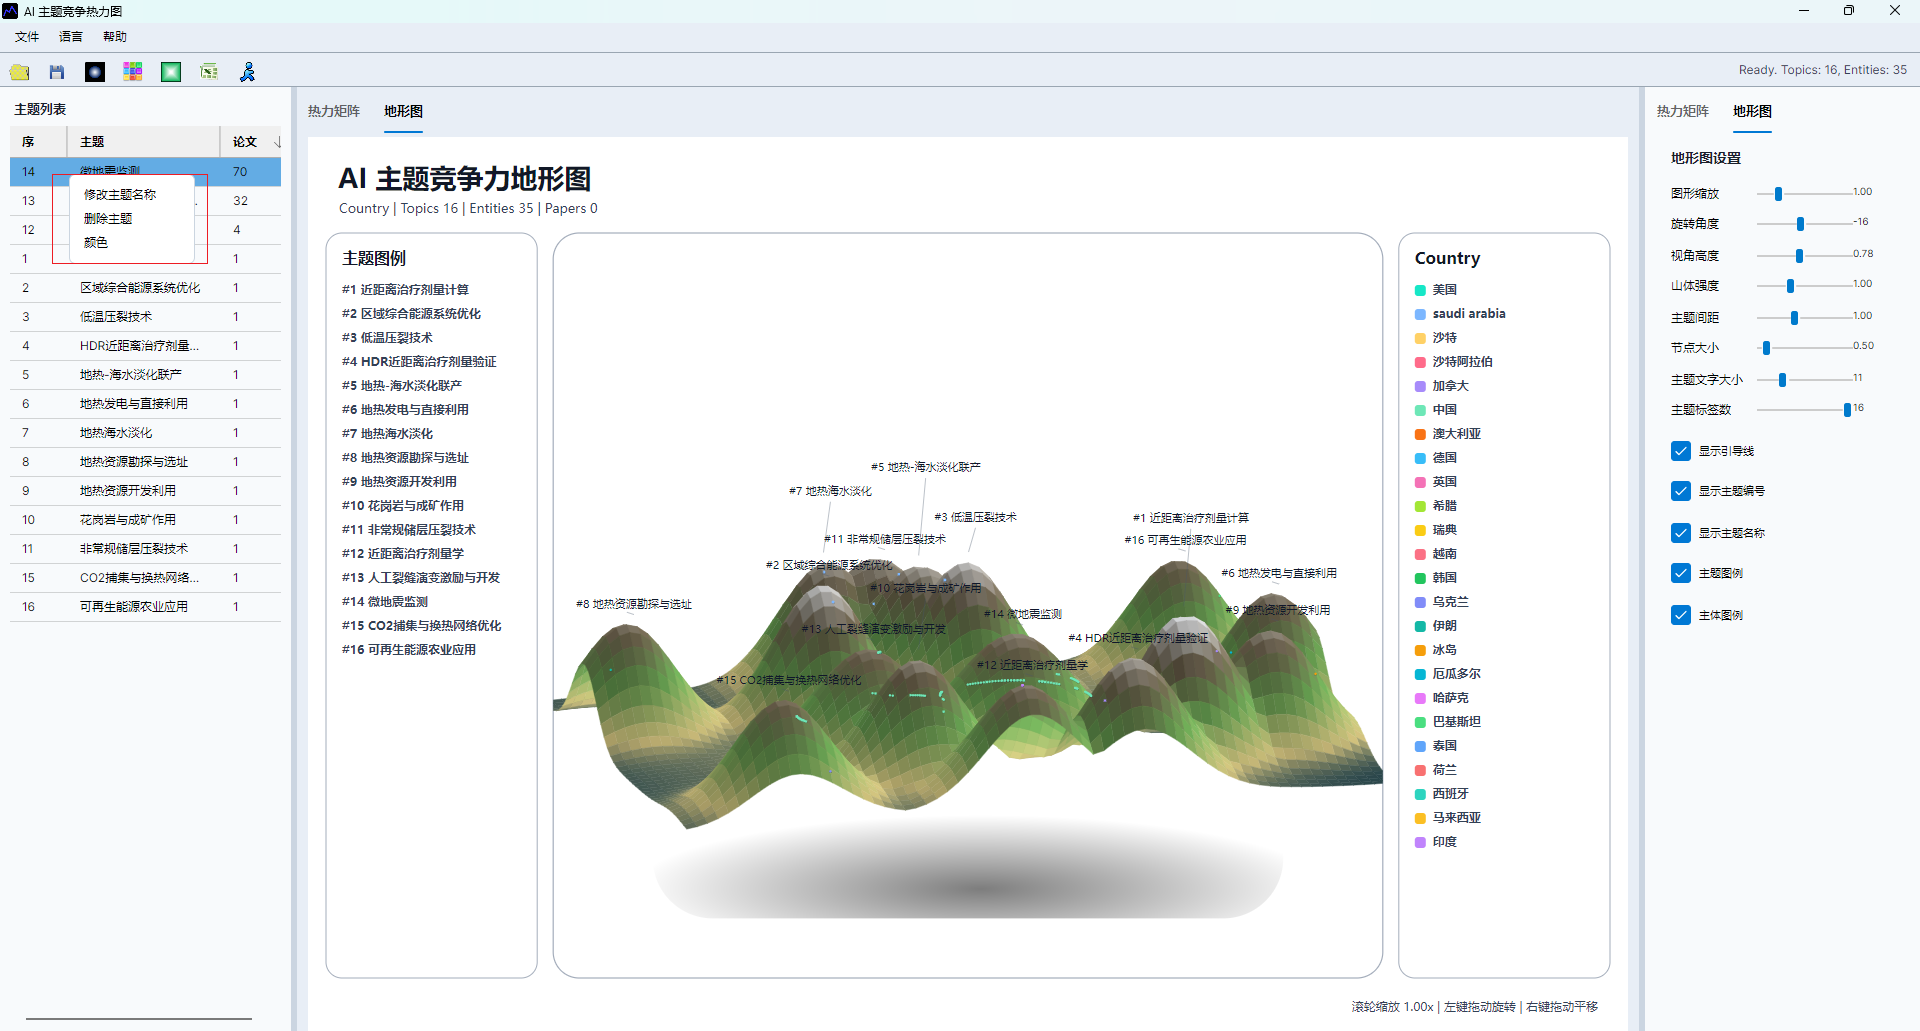
Interface Screenshots
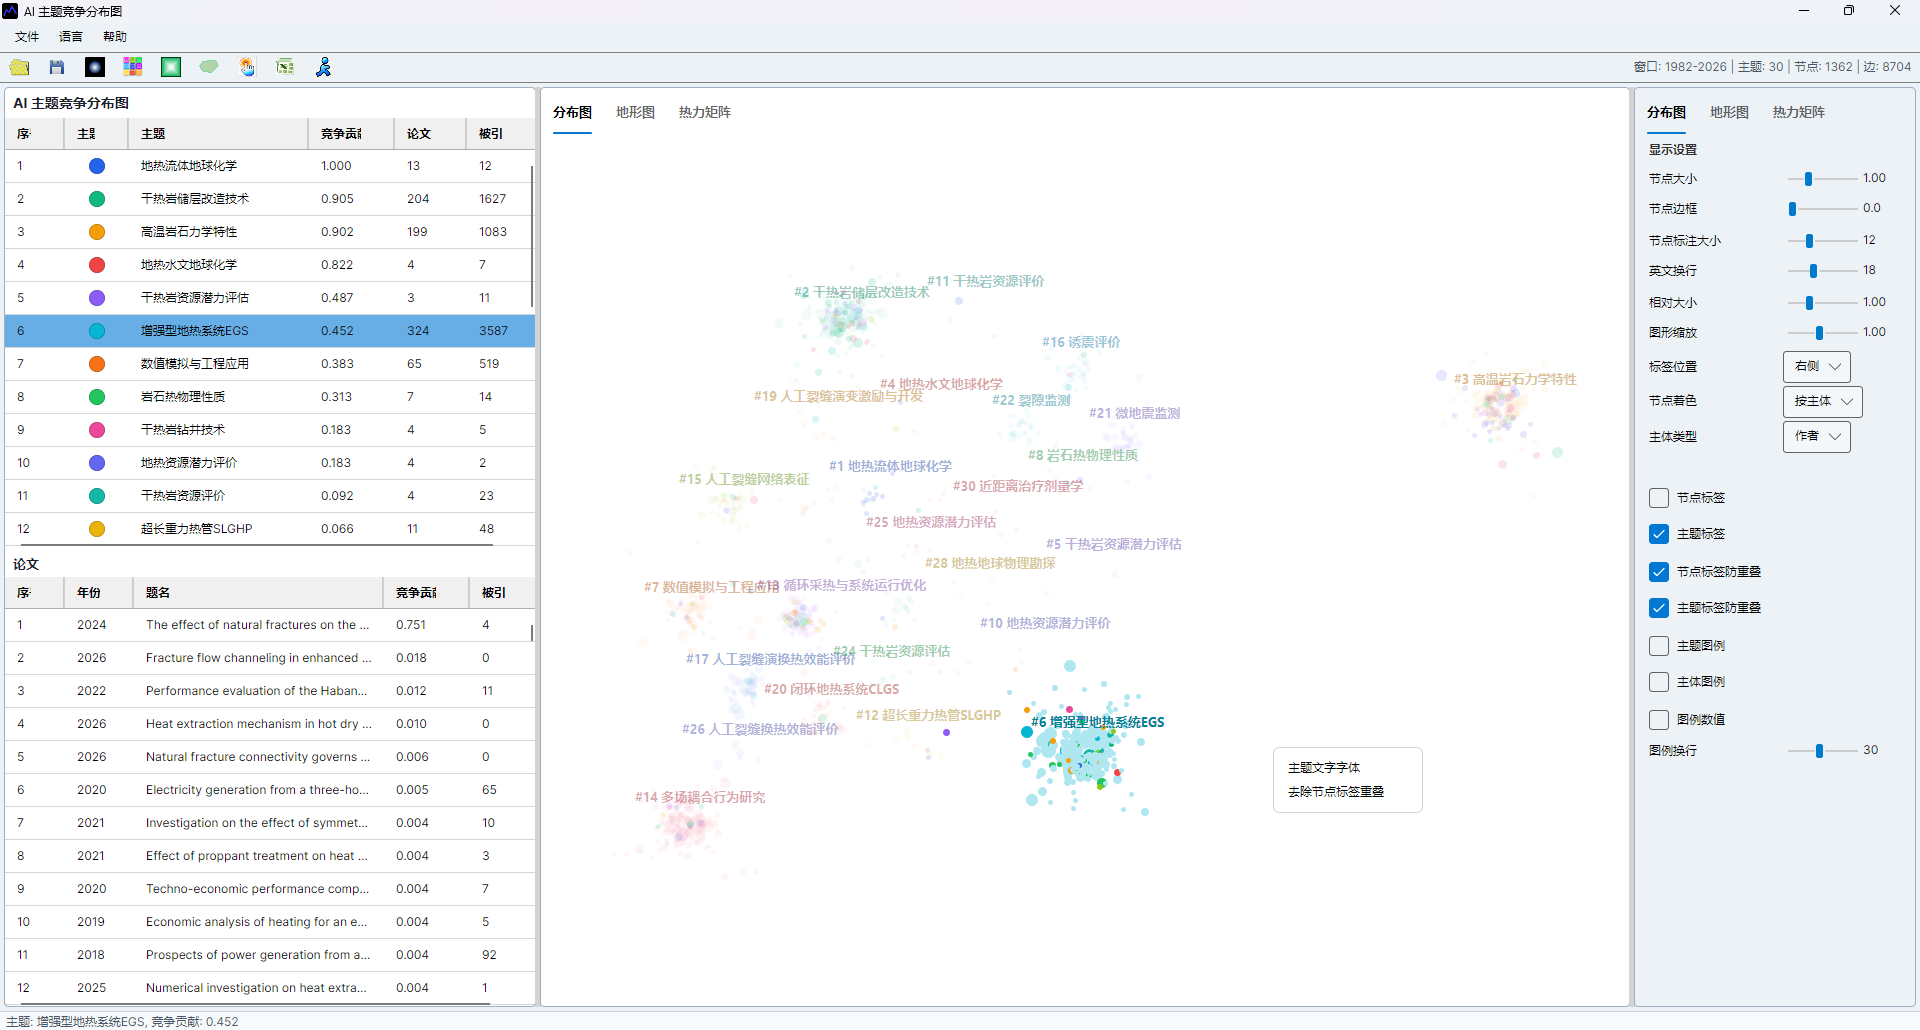
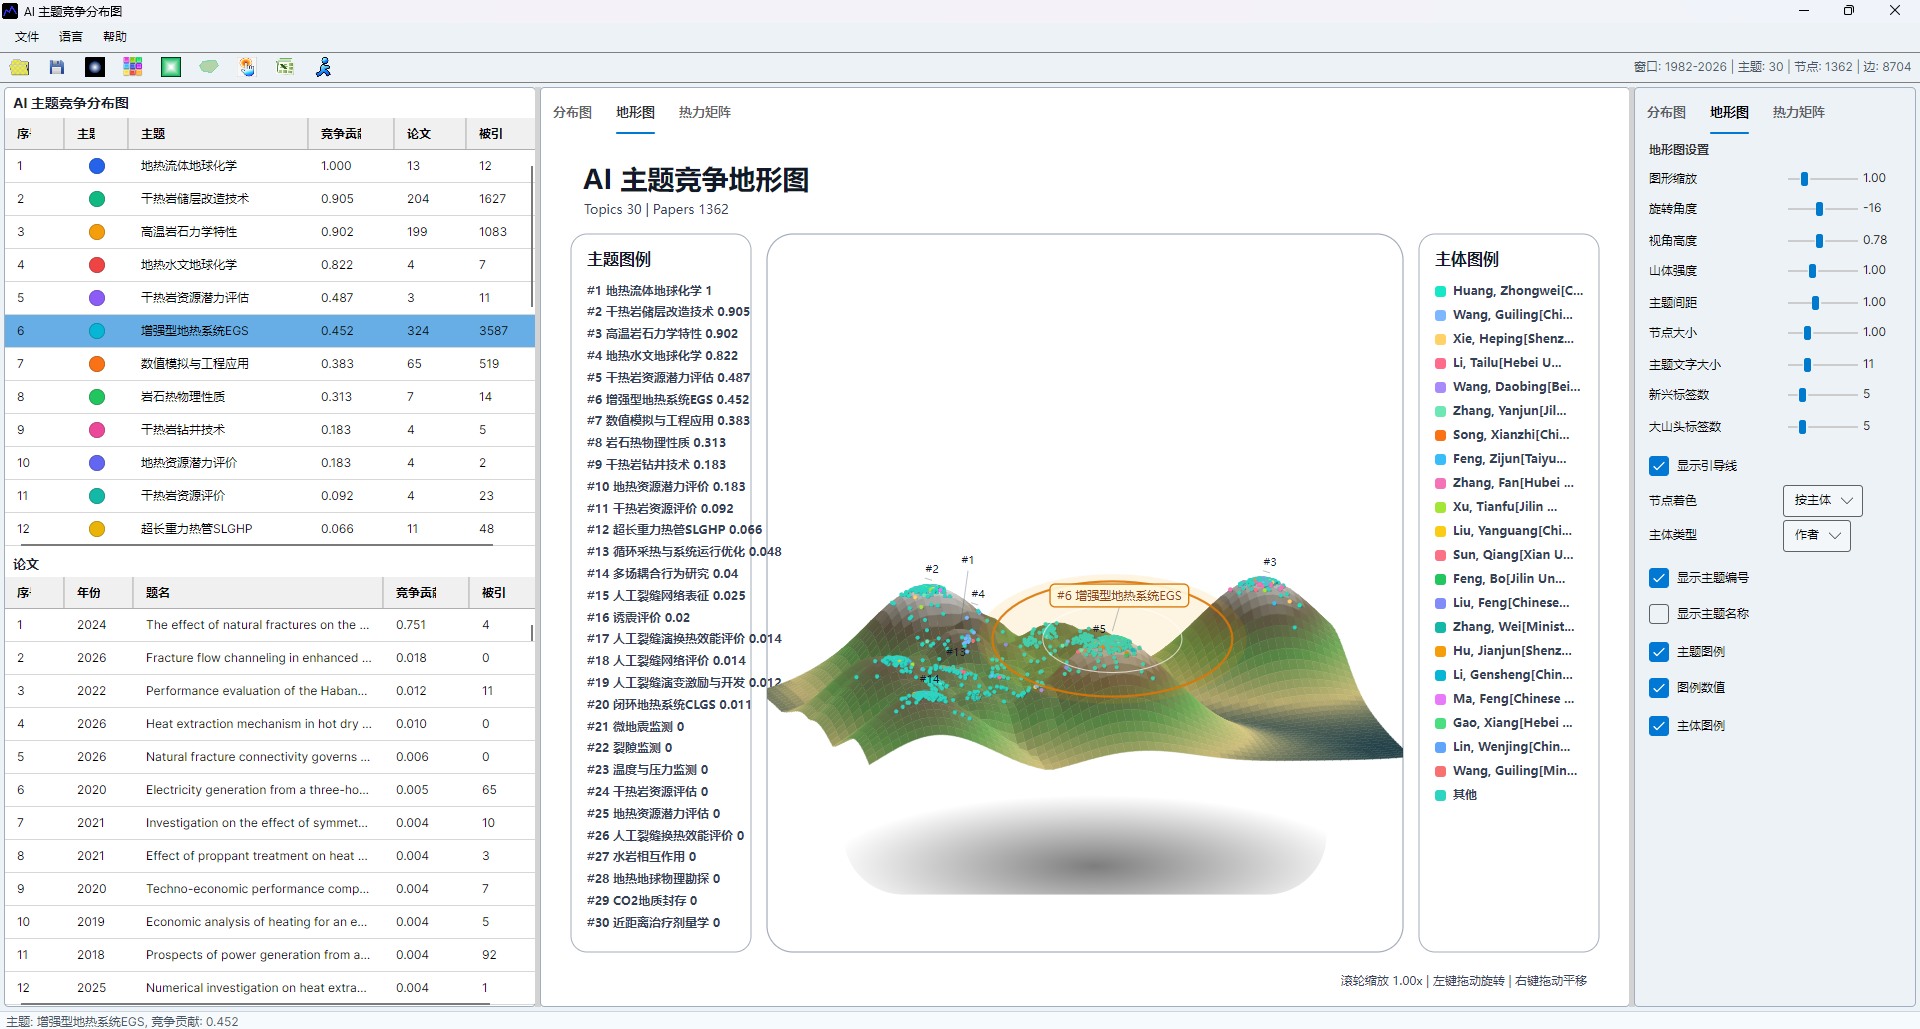
The screenshots below are retained to verify menu entries, parameter settings, result views, and export locations.
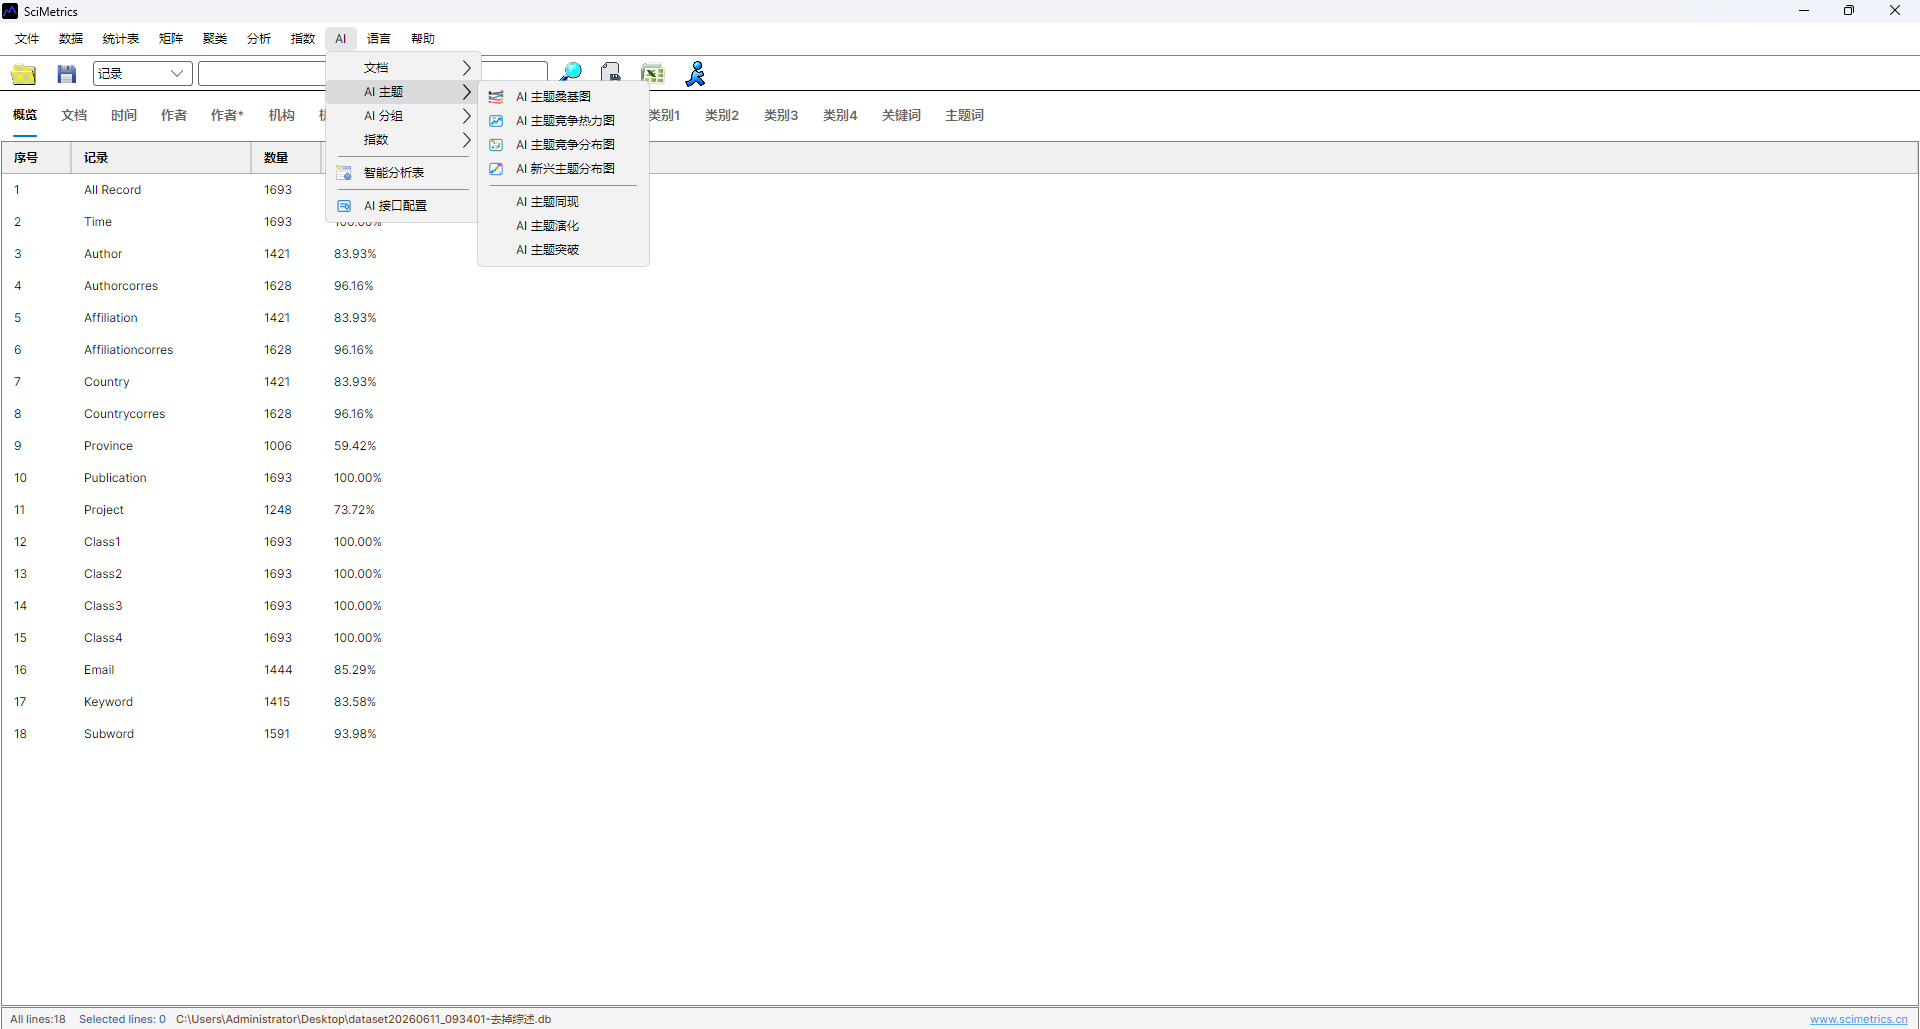
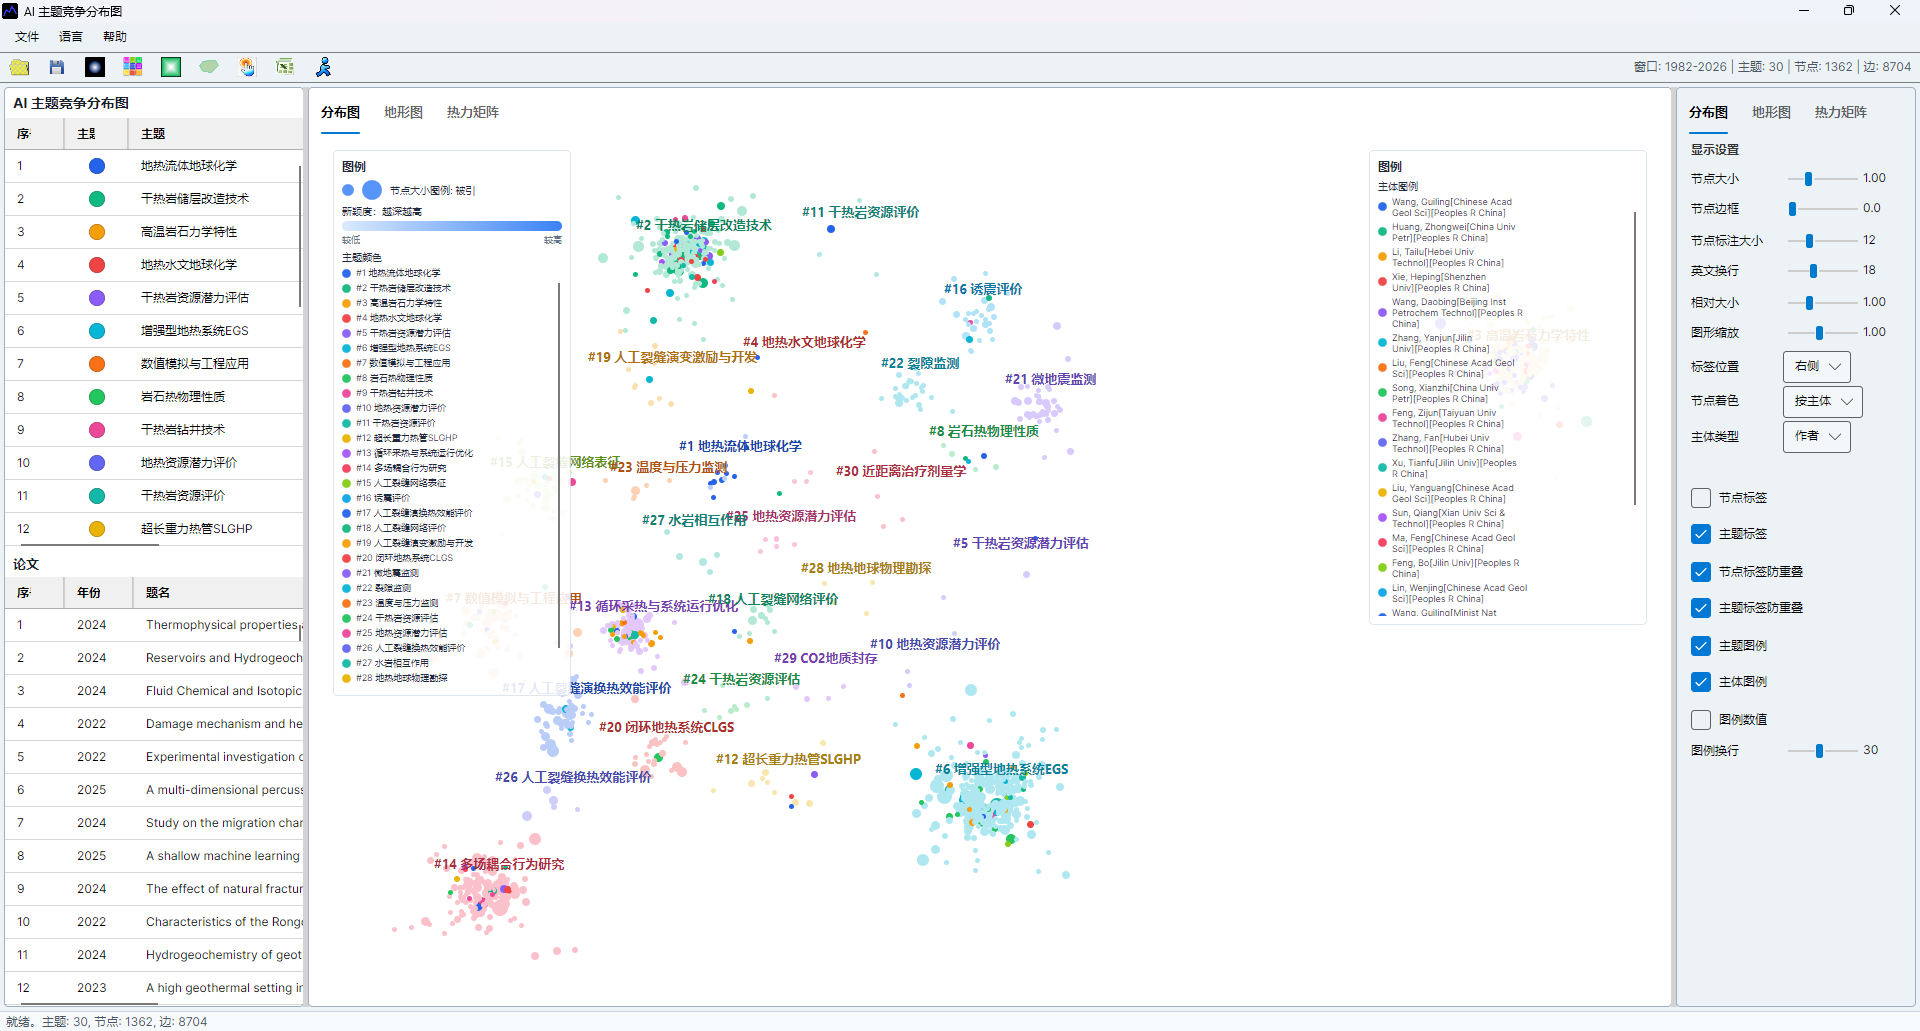
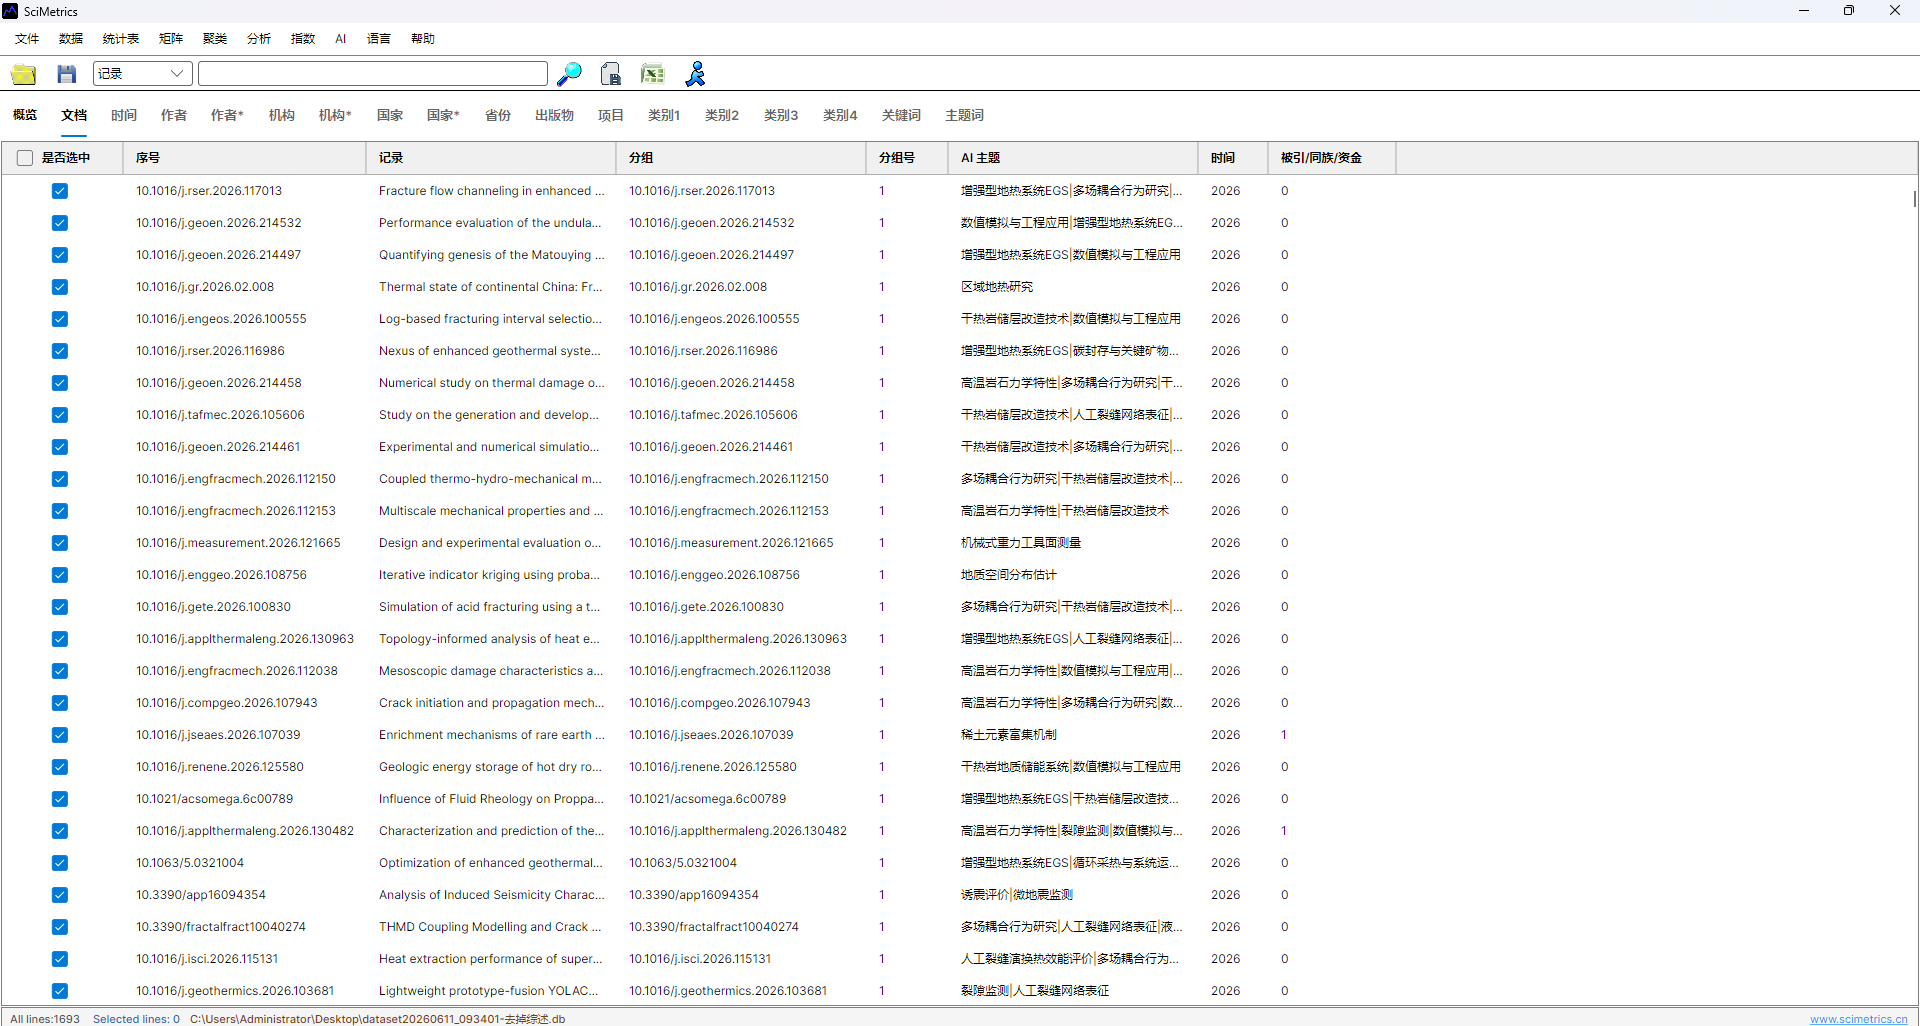
AI Topic Competitiveness Heatmap
Read subject-topic matrices, heatmaps, and terrain views for topic-level comparison.
AI Topic Competitiveness Heatmap
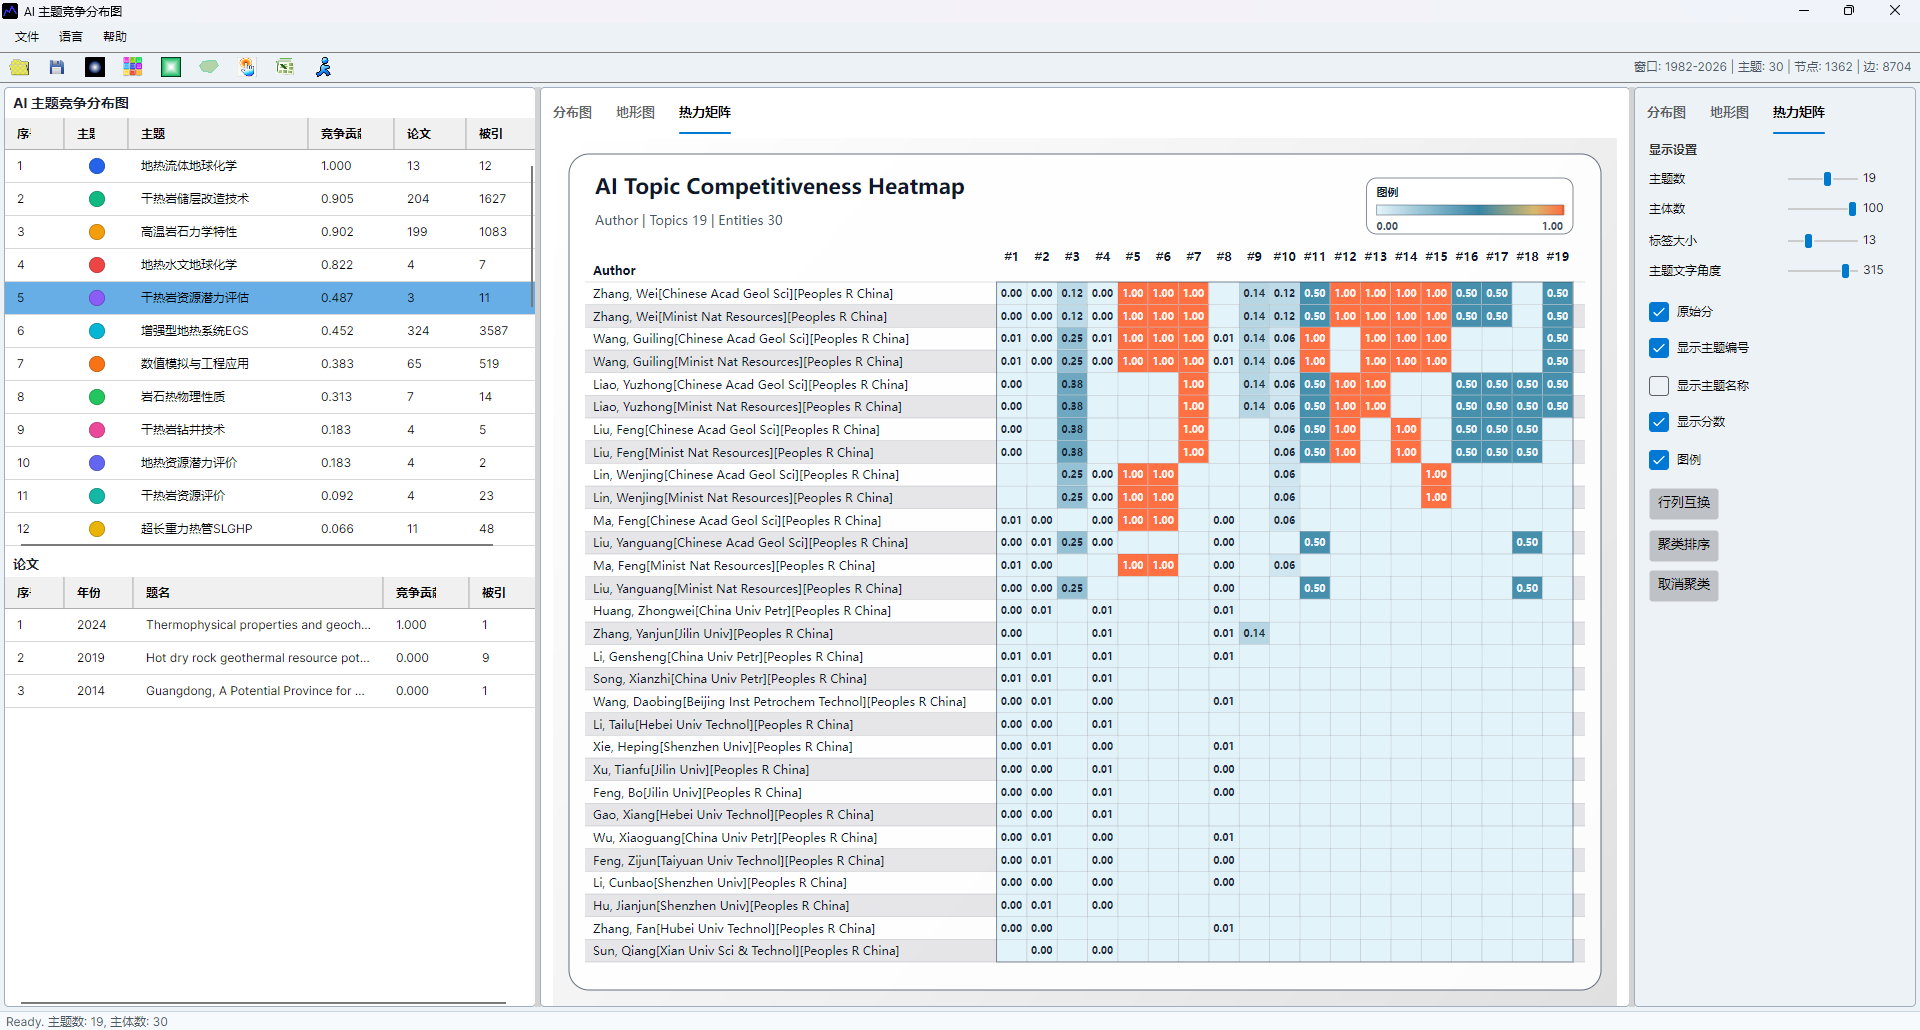
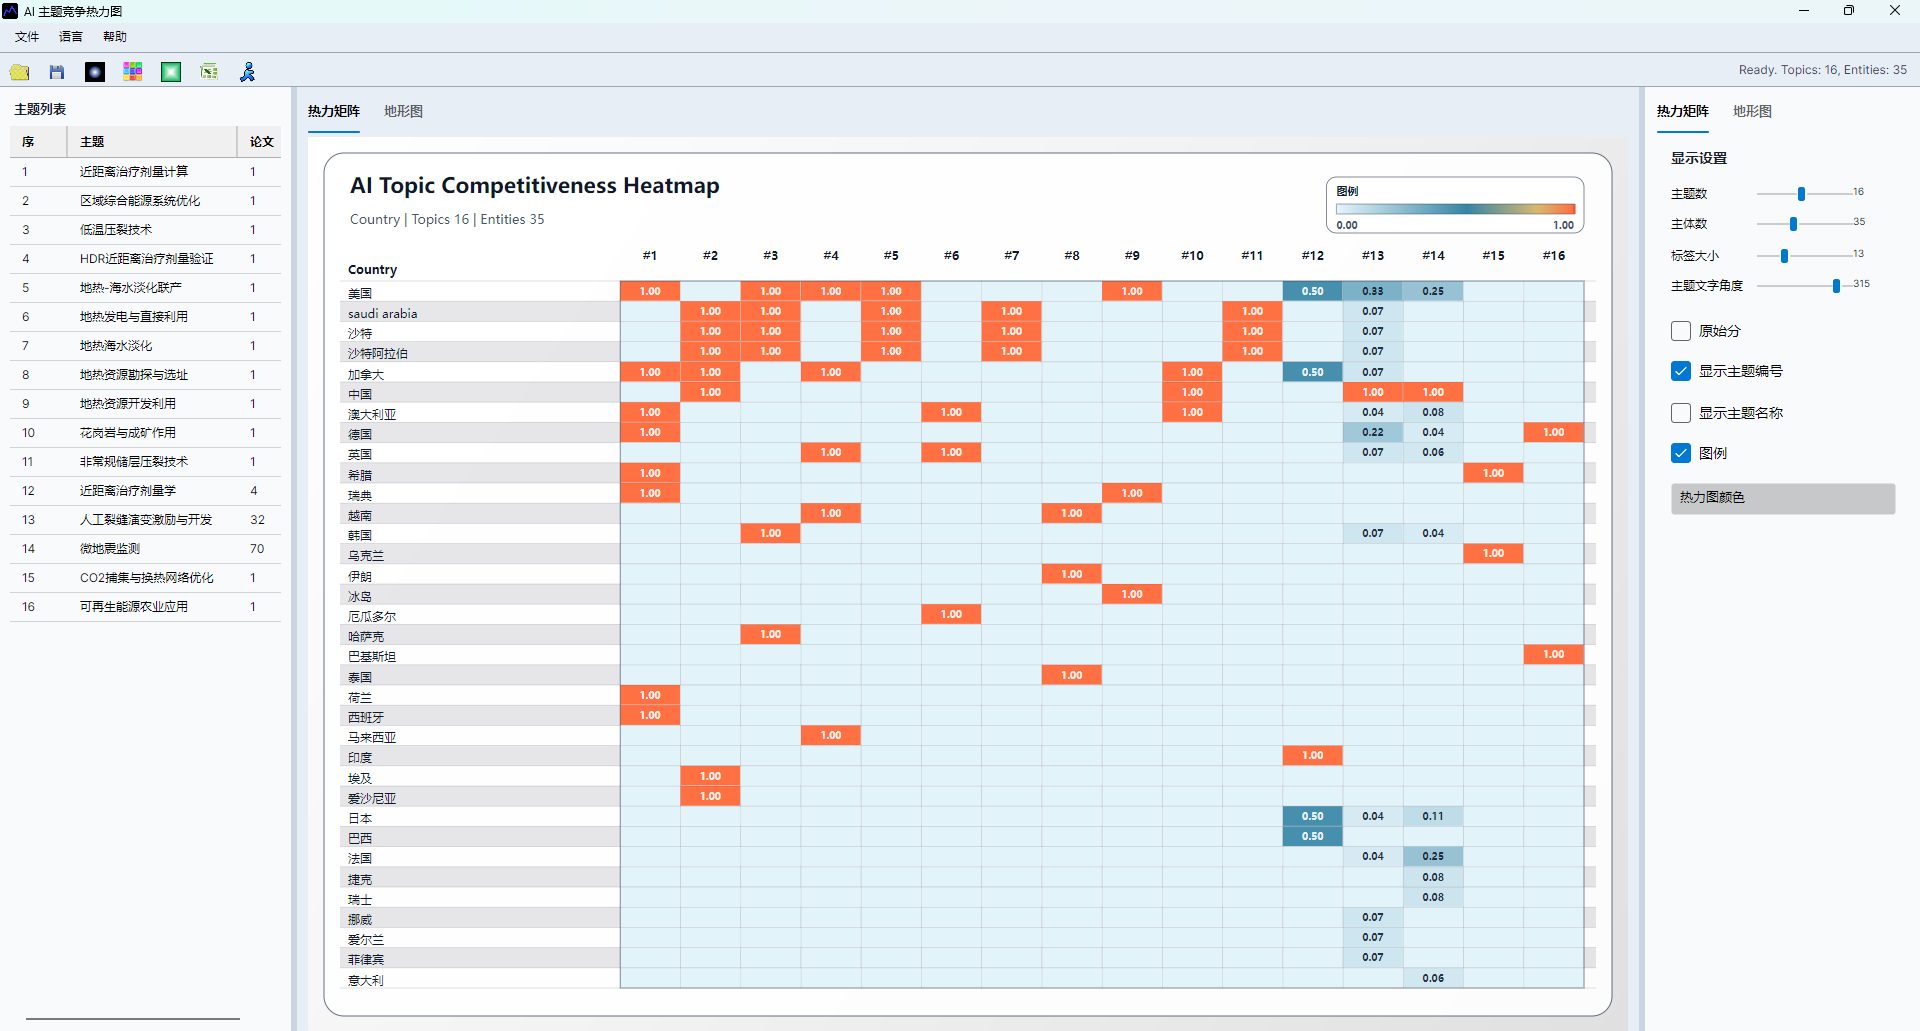
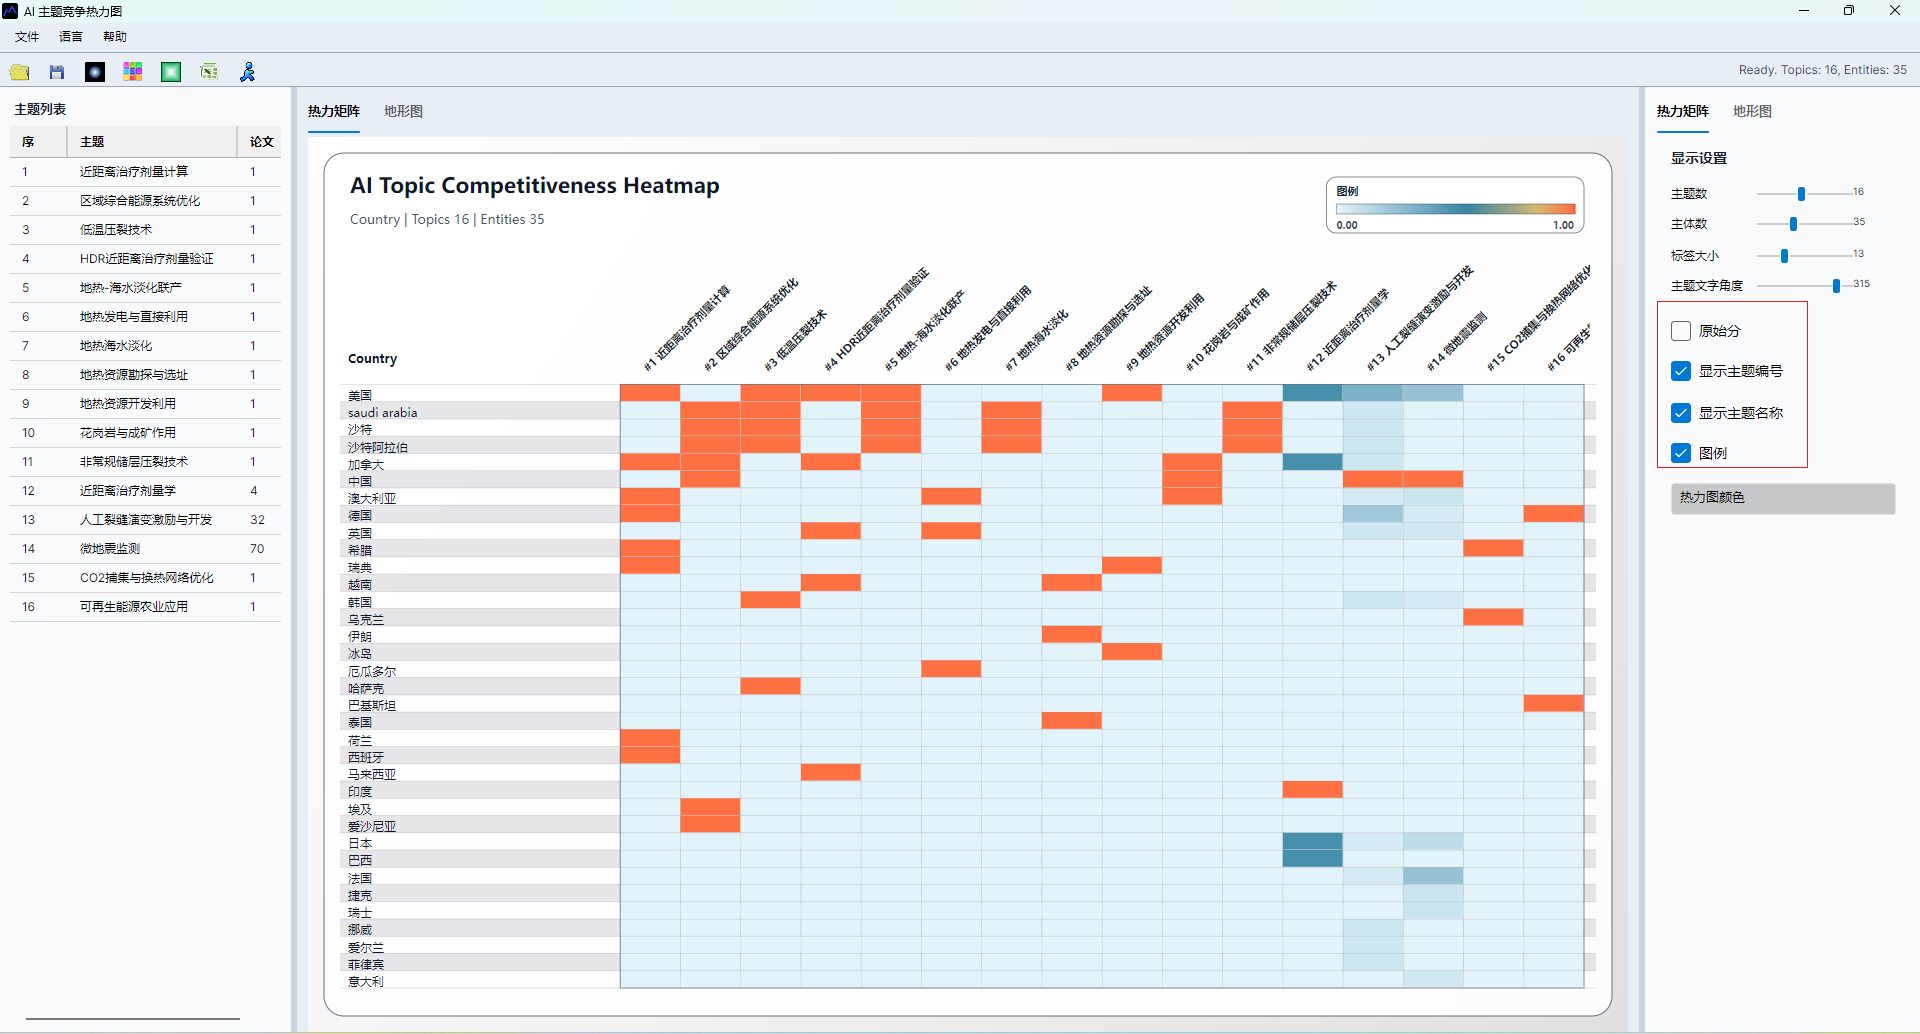
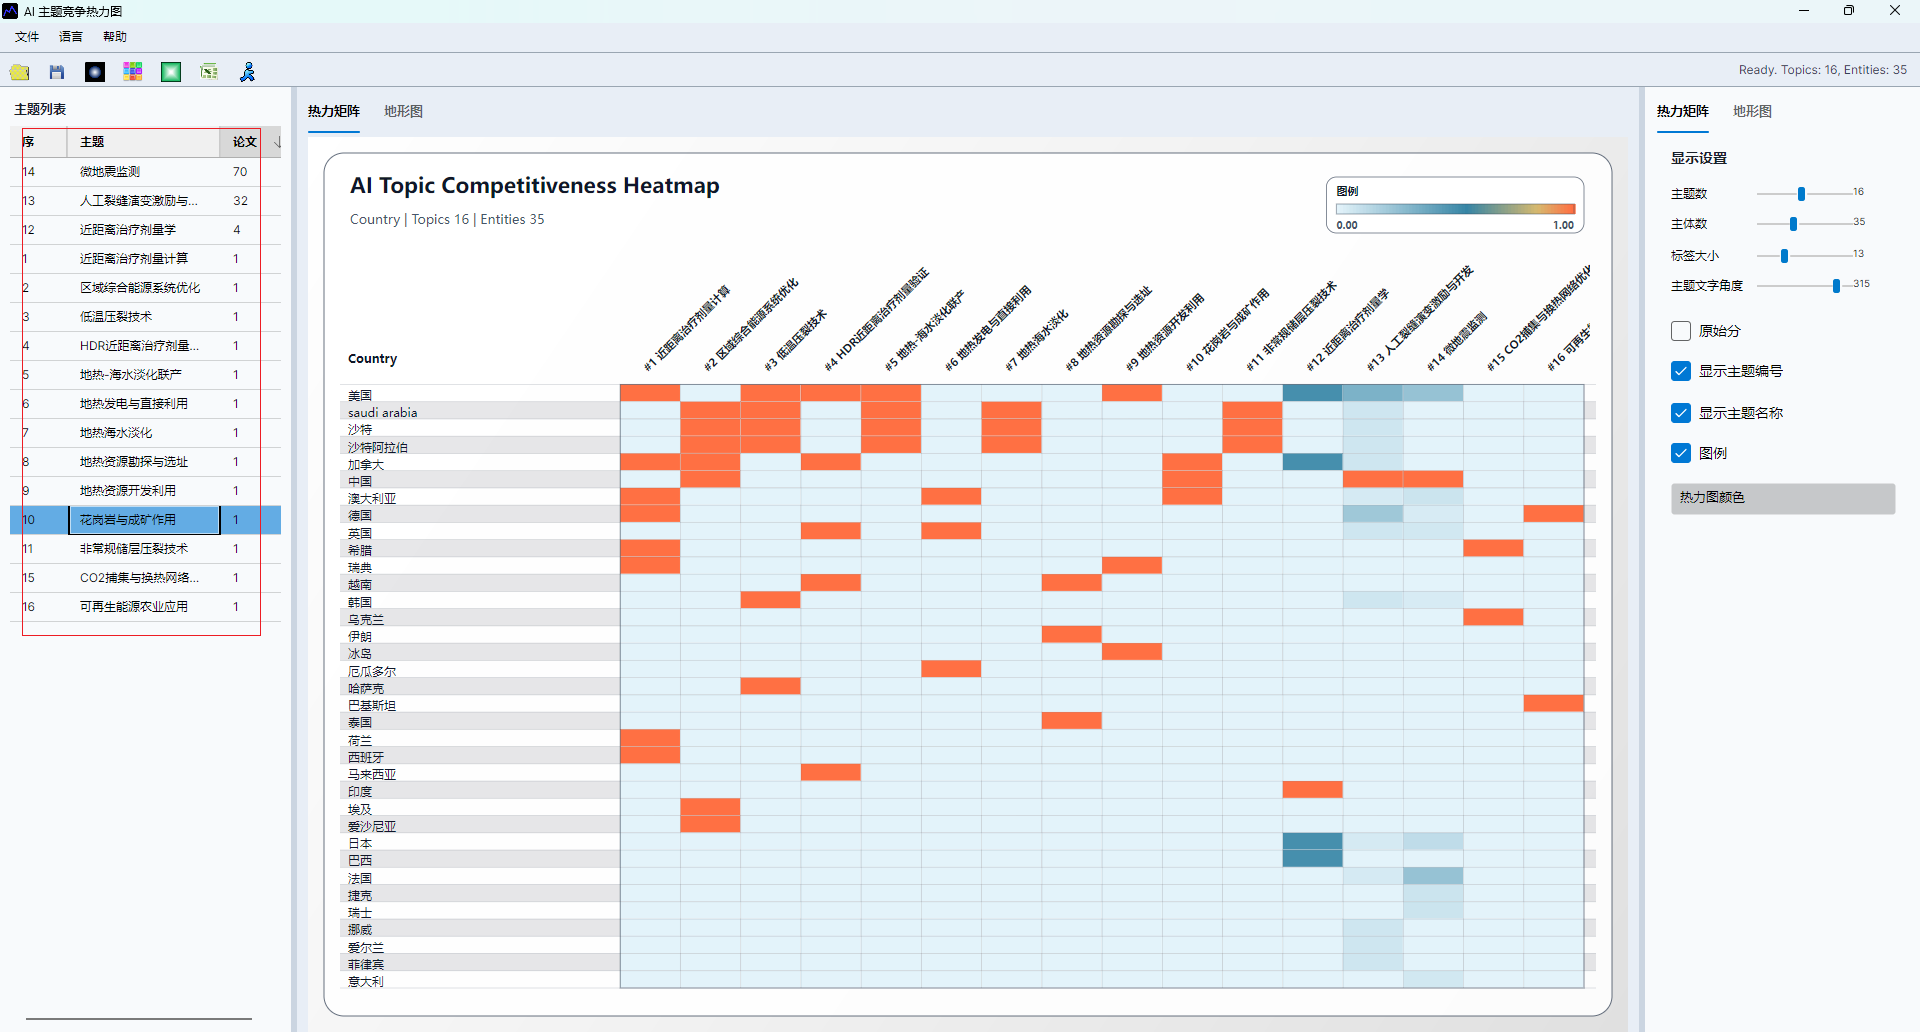
The AI topic competitiveness heatmap converts subject-topic relationships into a matrix. Rows usually represent topics, columns represent subjects, and color intensity represents the relative competitive strength or activity level.
Recommended Data Preparation
- Complete AI topic identification.
- Merge institution, author, or other subject names before comparison.
- Remove obvious noise and duplicate aliases.
- Decide the subject dimension and topic range before generating the matrix.
Generate The Heatmap
- Export or calculate the AI topic competitiveness index.
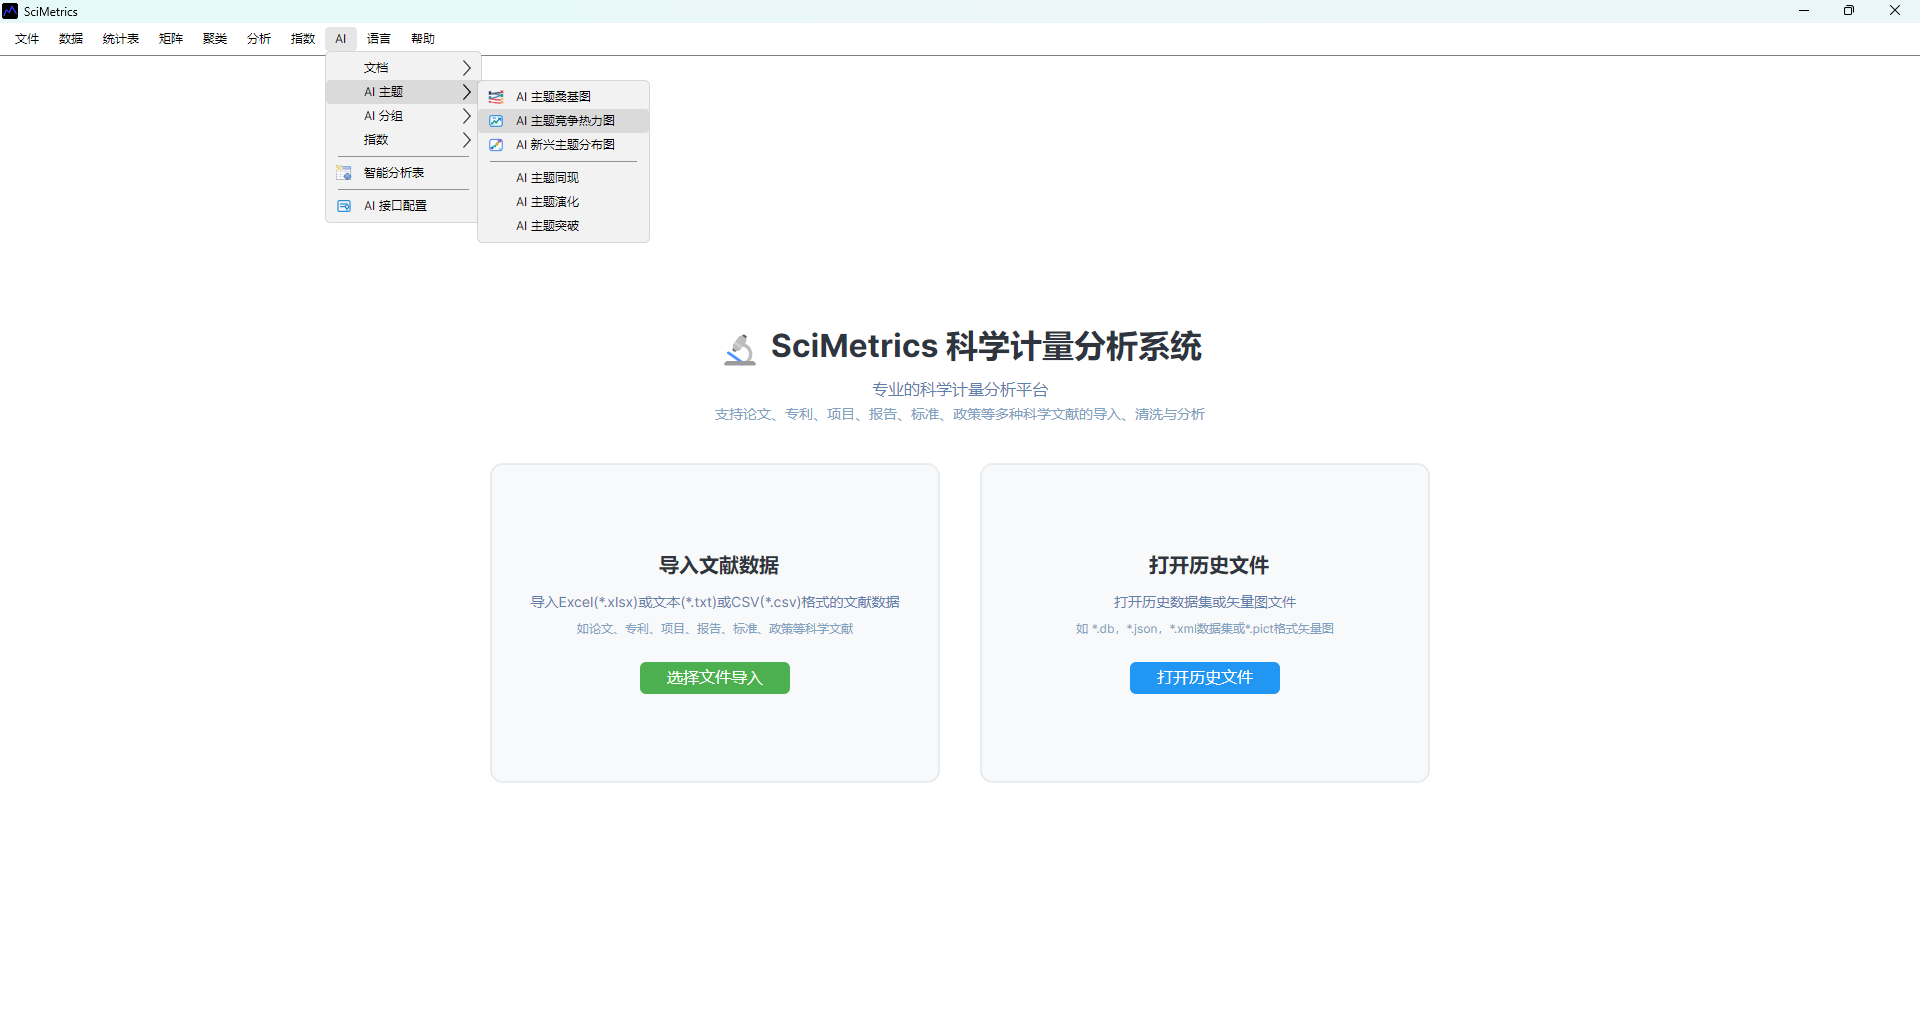
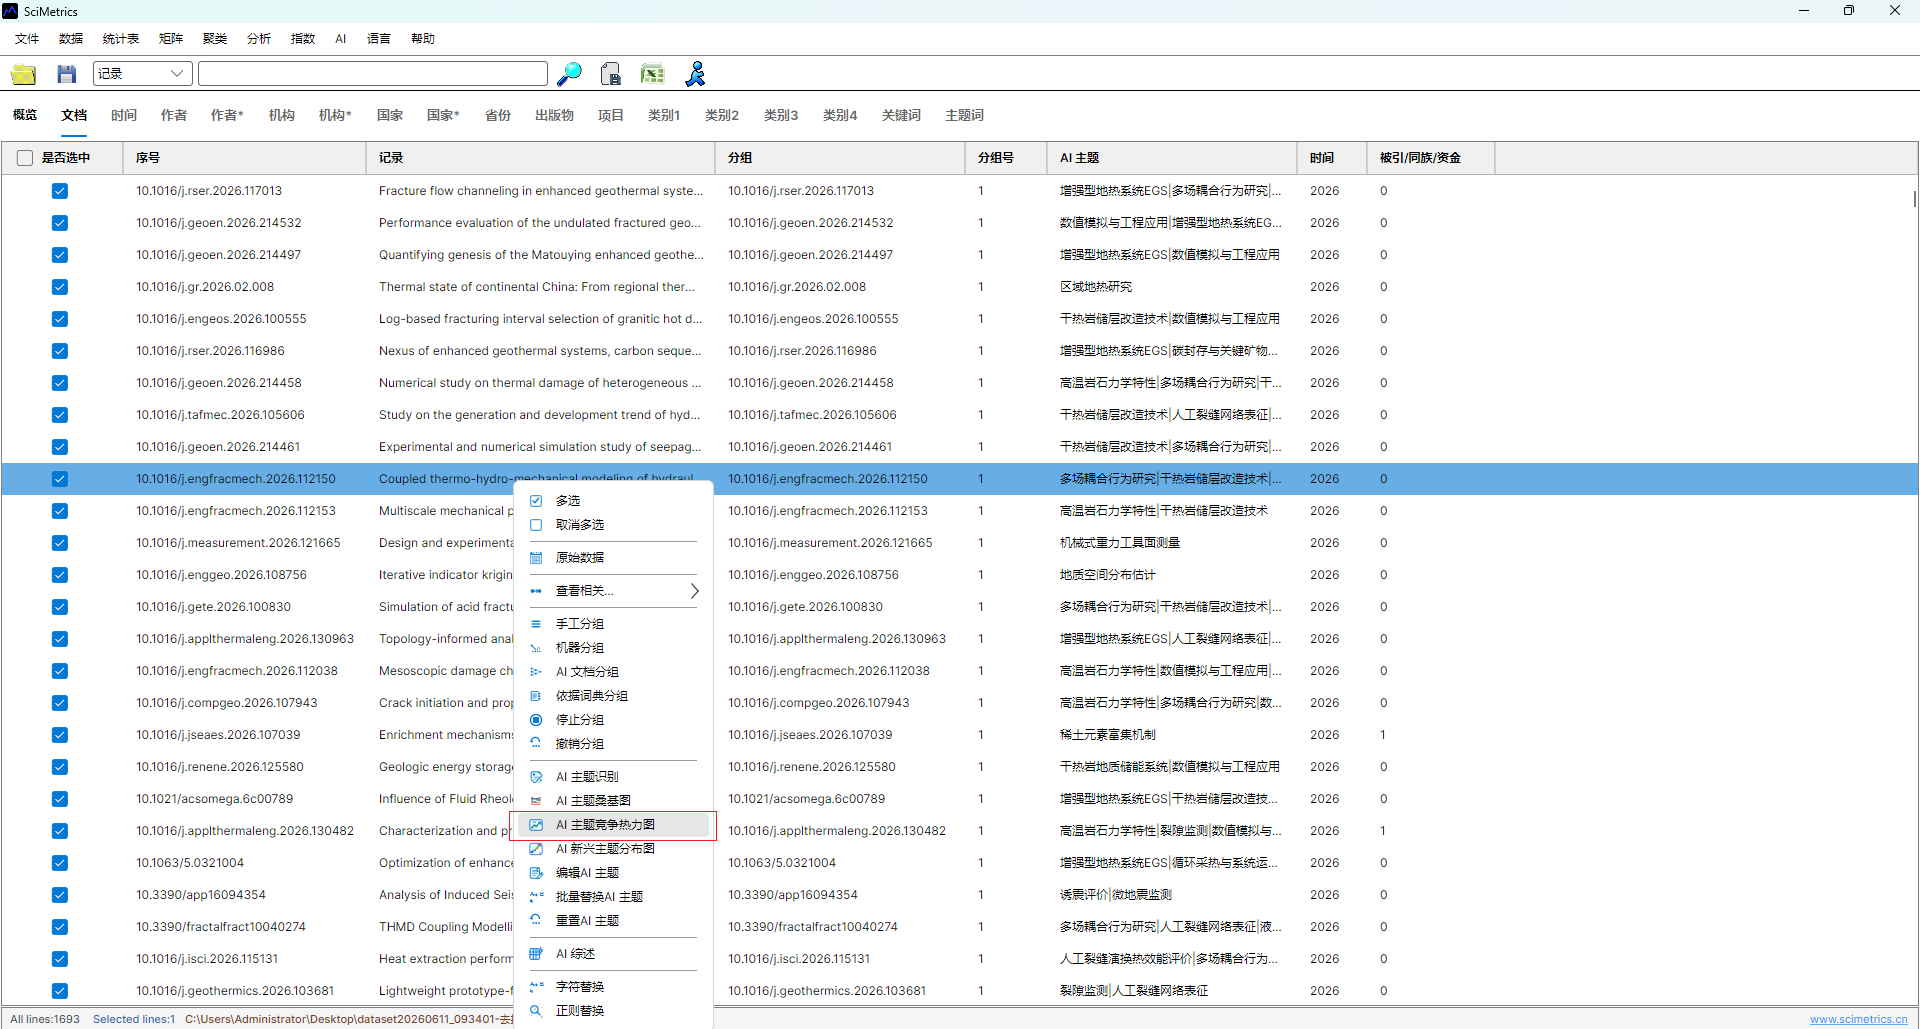
- Open the AI topic competitiveness heatmap or terrain view.
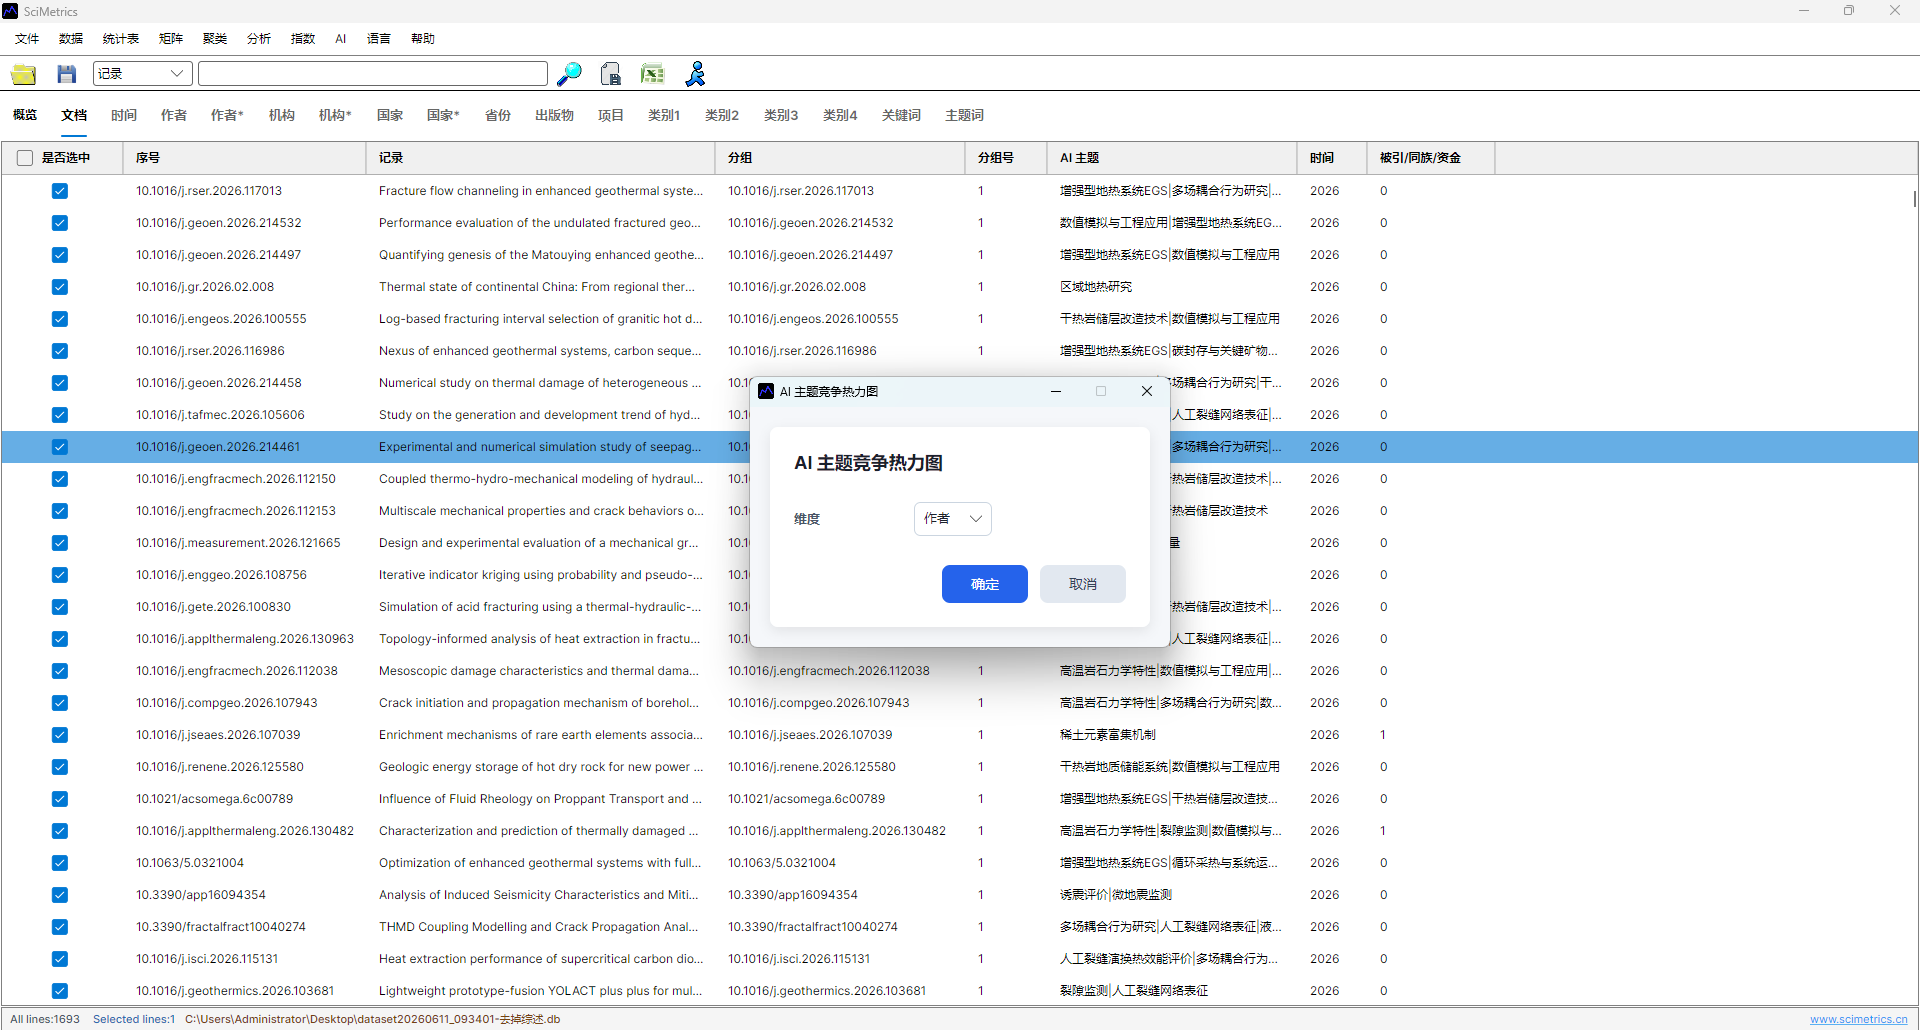
- Choose the subject dimension.
- Set topic and subject limits.
- Generate the matrix and adjust display options such as color, labels, background, and scale.
Reading The Heatmap
High-intensity cells show where a subject is highly active or competitive in a topic. A row with many strong cells means the topic is widely contested. A column with several strong cells means the subject has a broad topic layout.
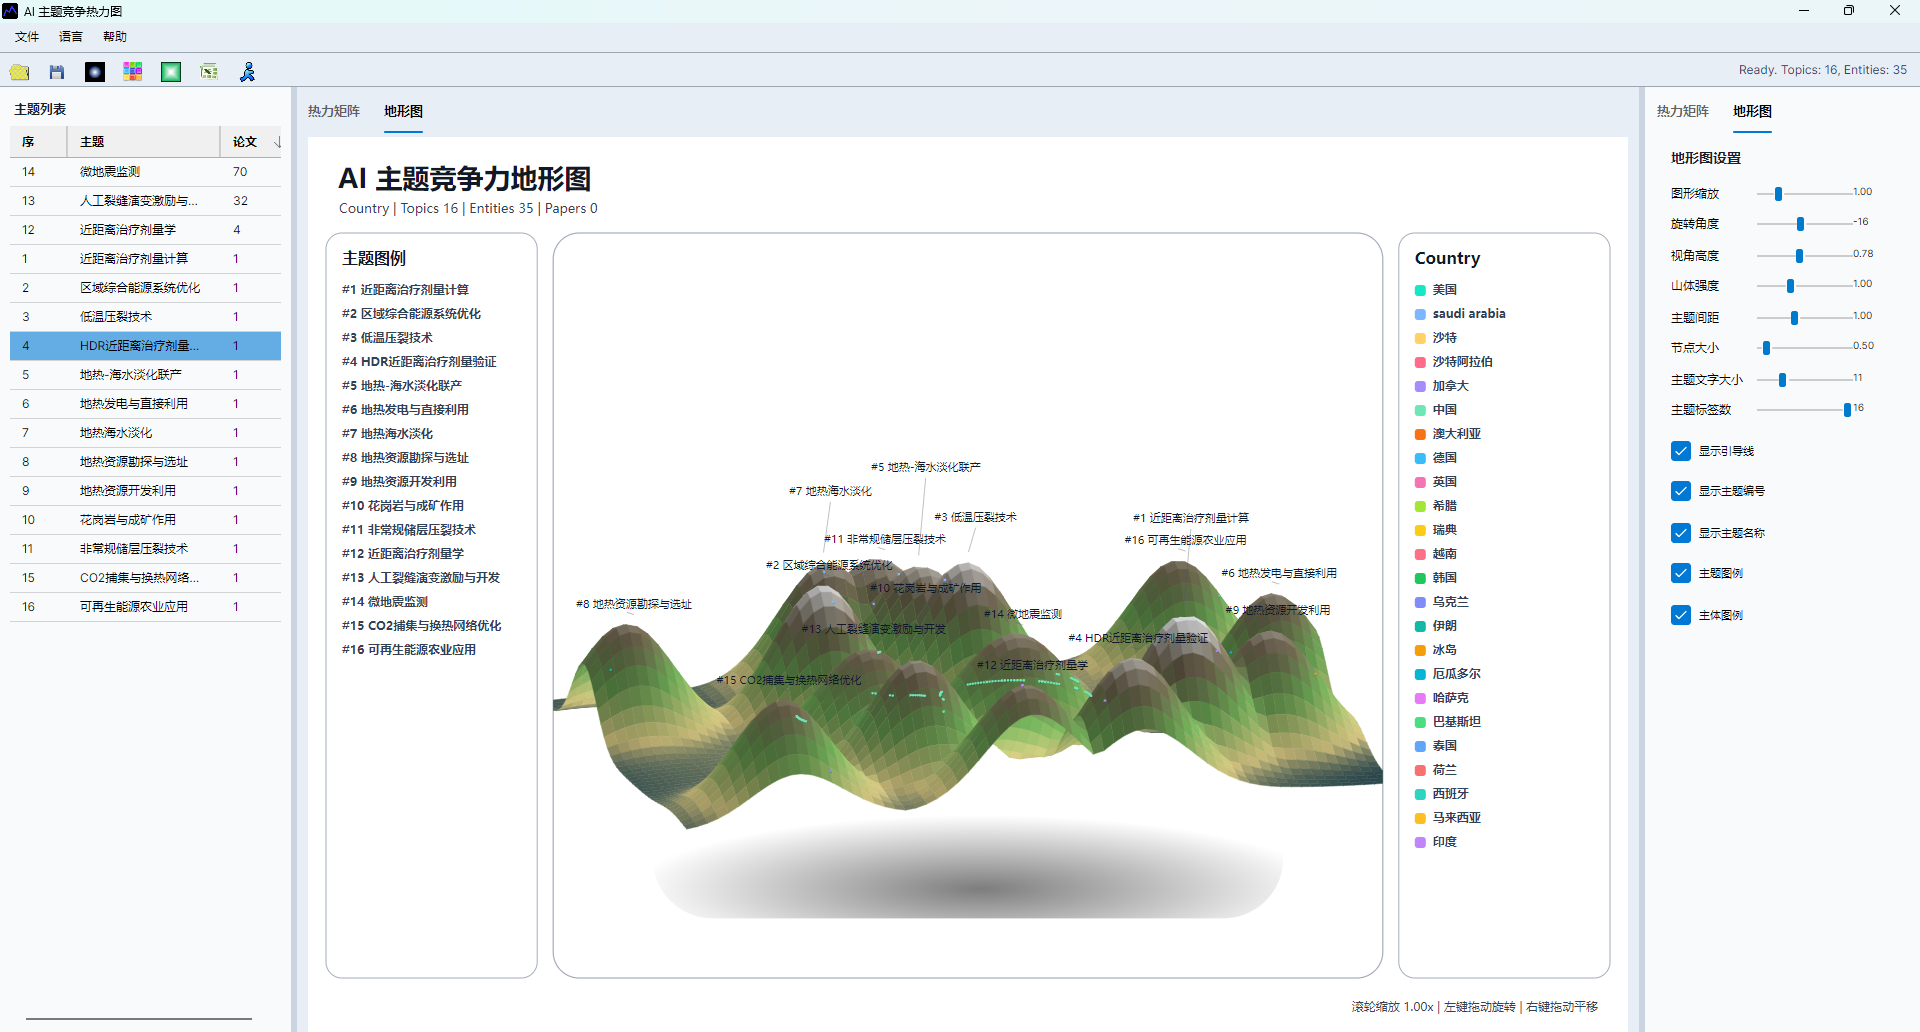
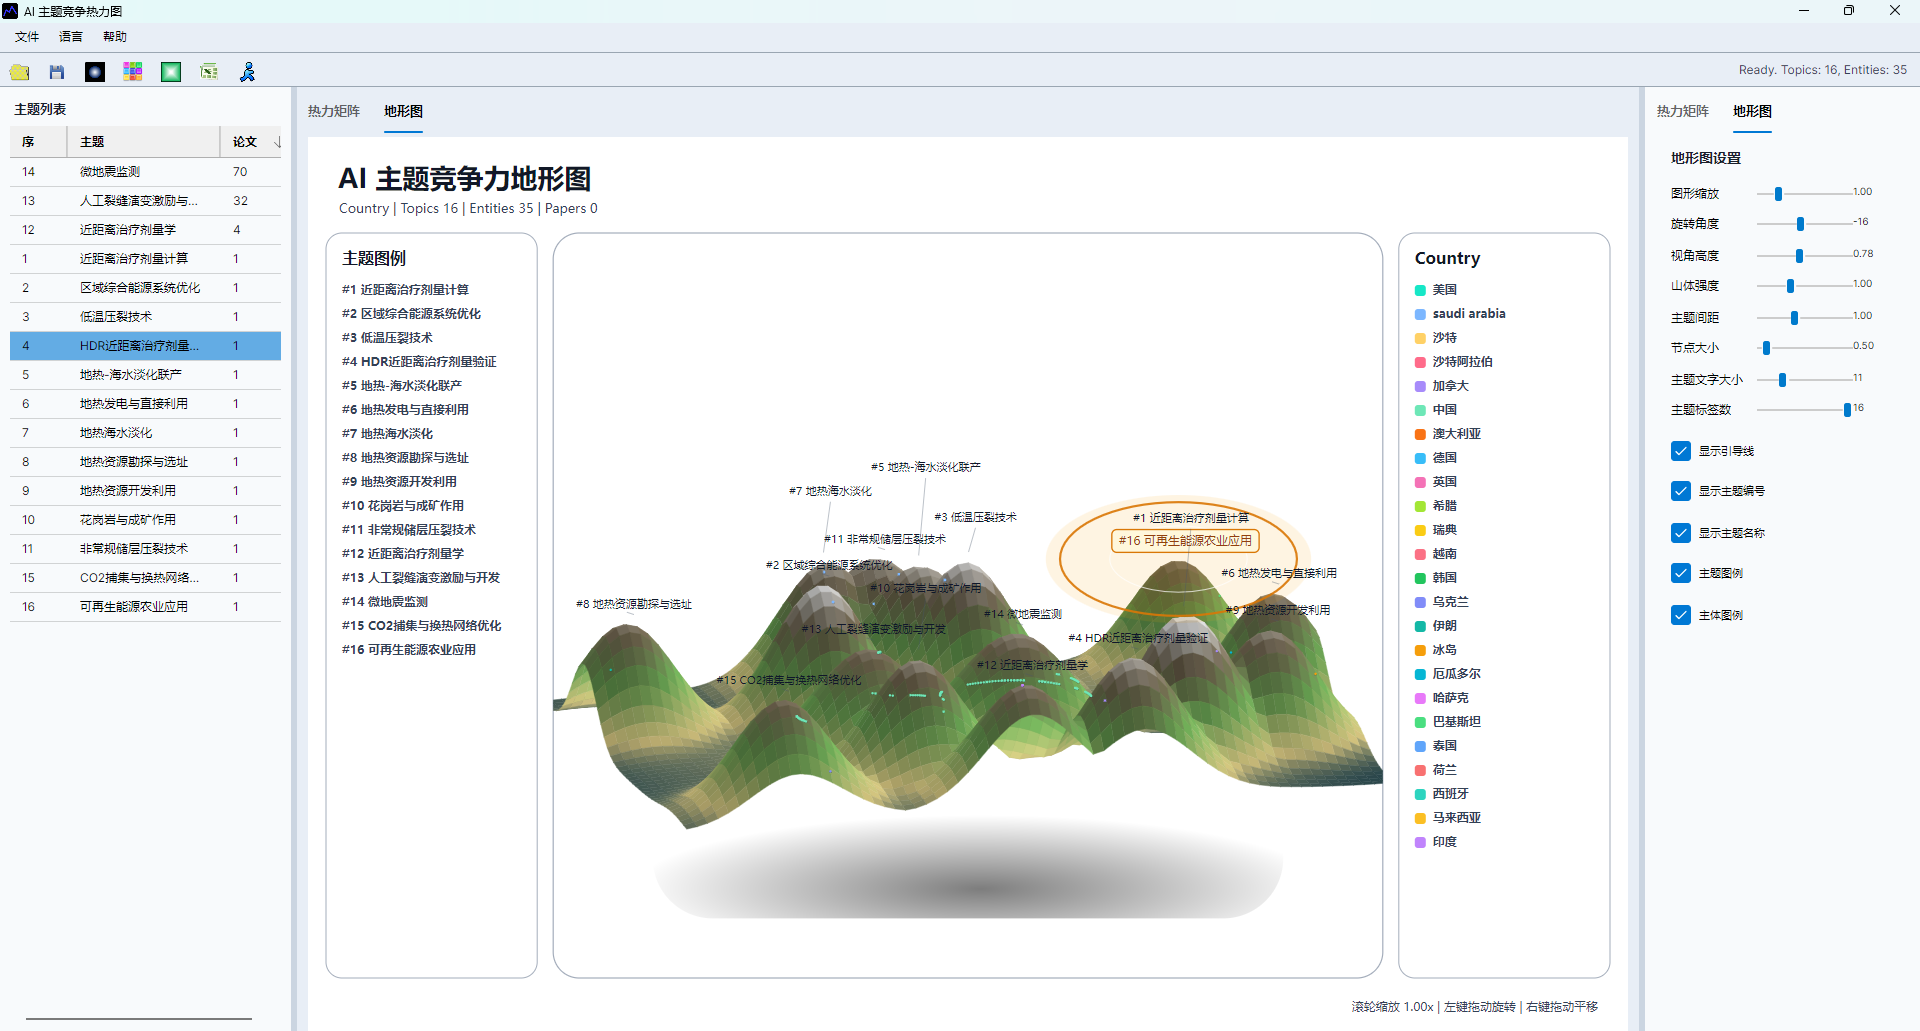
The terrain view can help communicate concentration and high-value areas, but the heatmap is usually easier for precise comparison. Use exported Excel data when a numeric conclusion is needed.
Review Rules
- Check whether the subject names were merged correctly.
- Avoid comparing topics with very different document volumes without reading supporting counts.
- Use selected-paper mode only when the selection rule is clear and recorded.
- Keep the exported matrix together with the figure for evidence tracking.
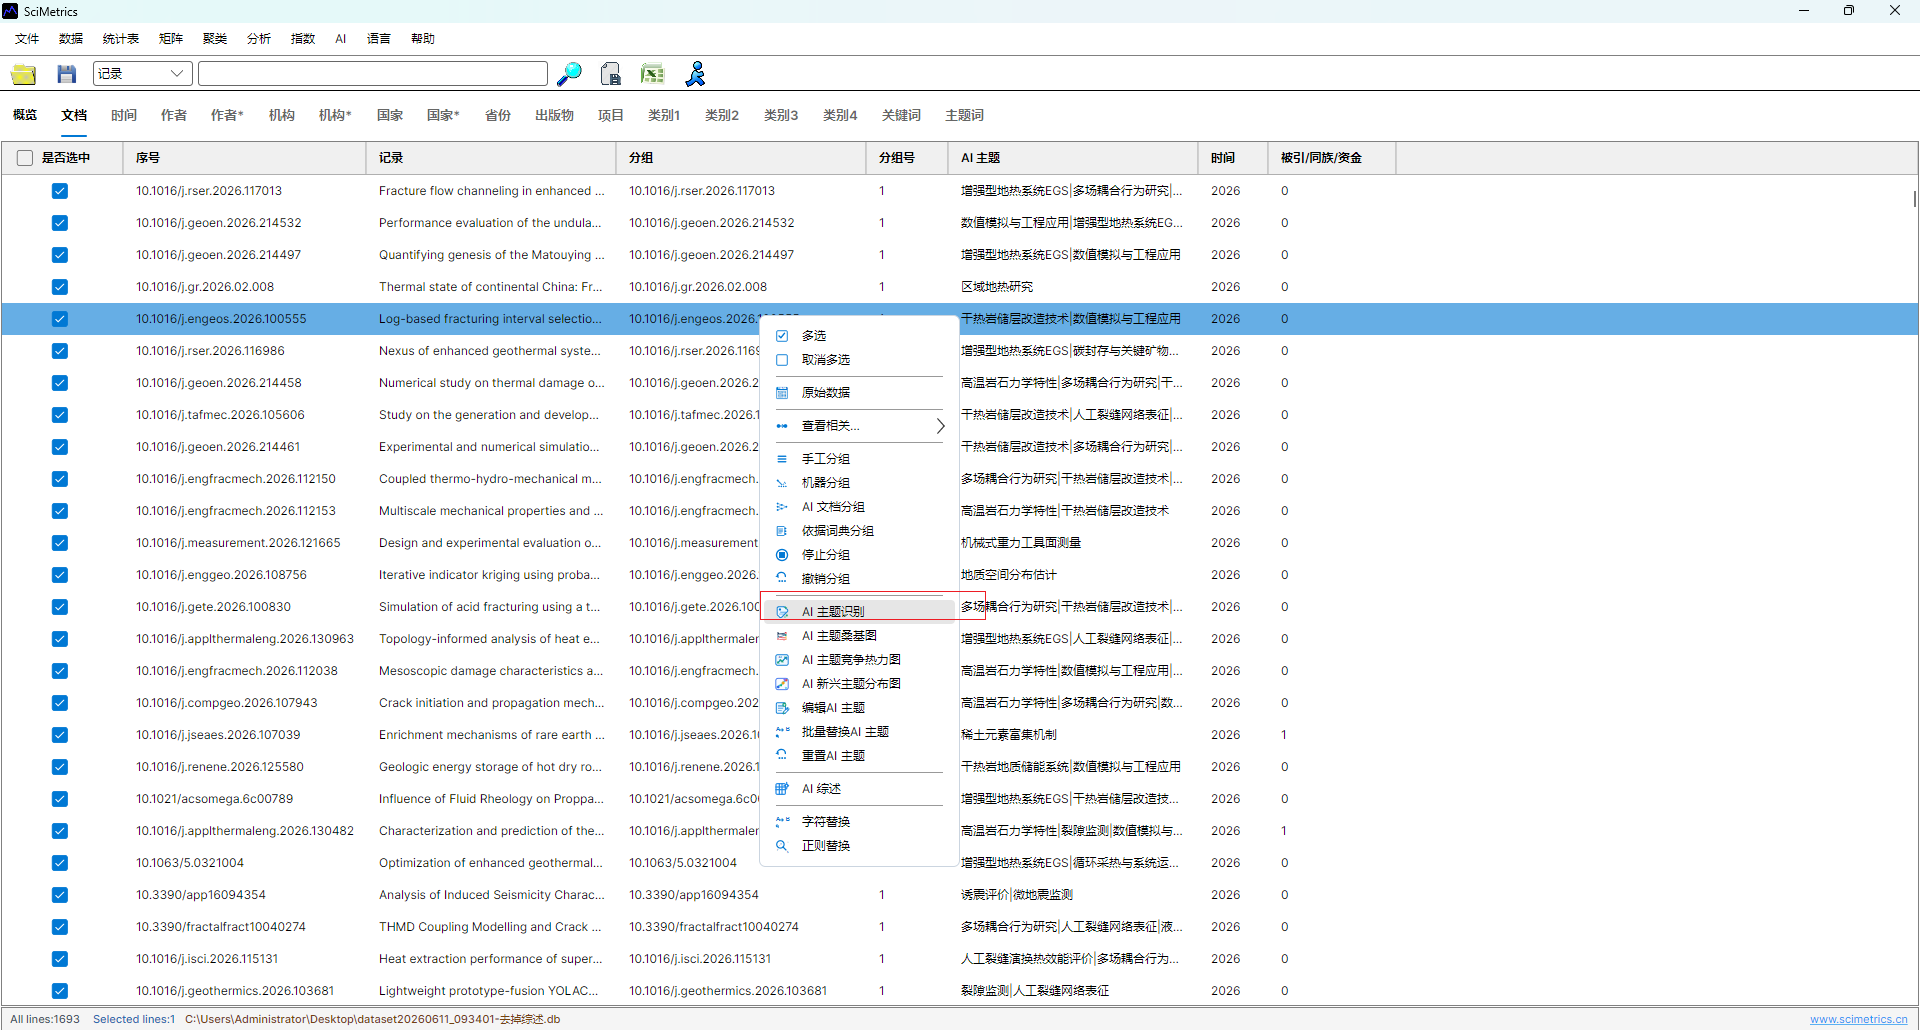
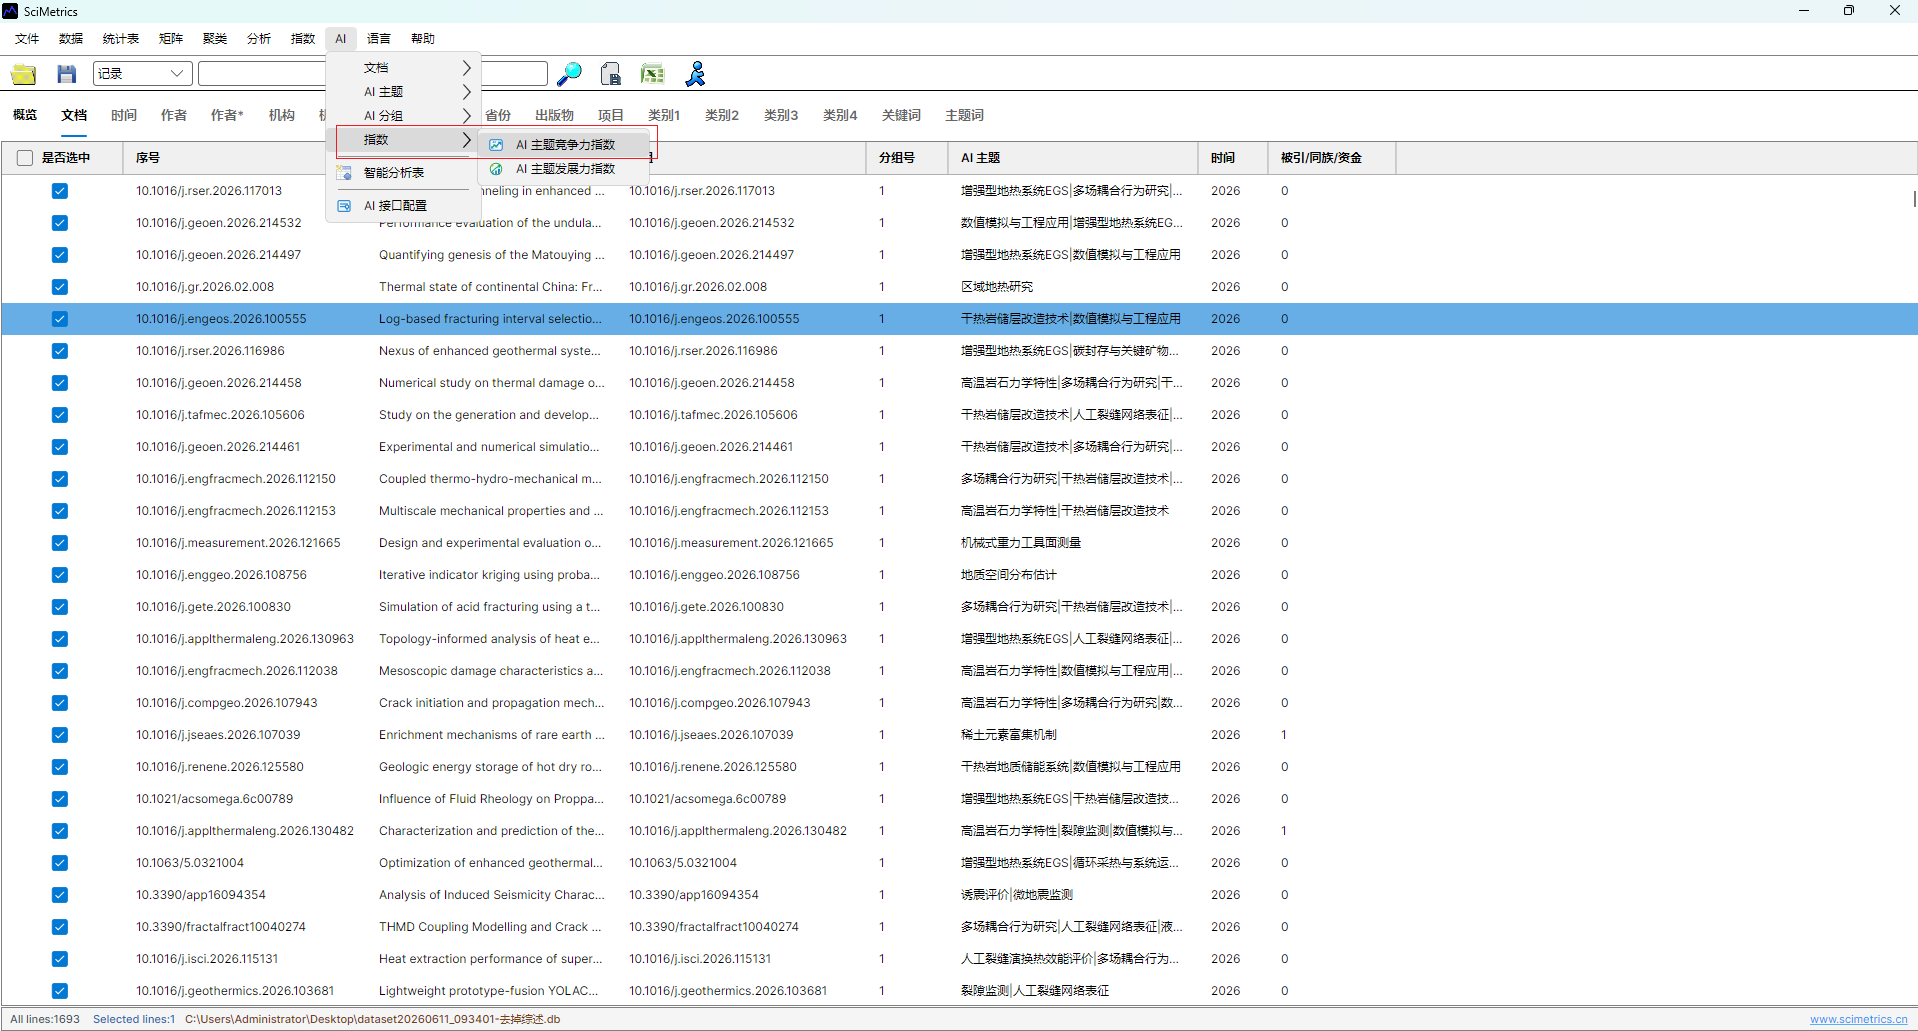
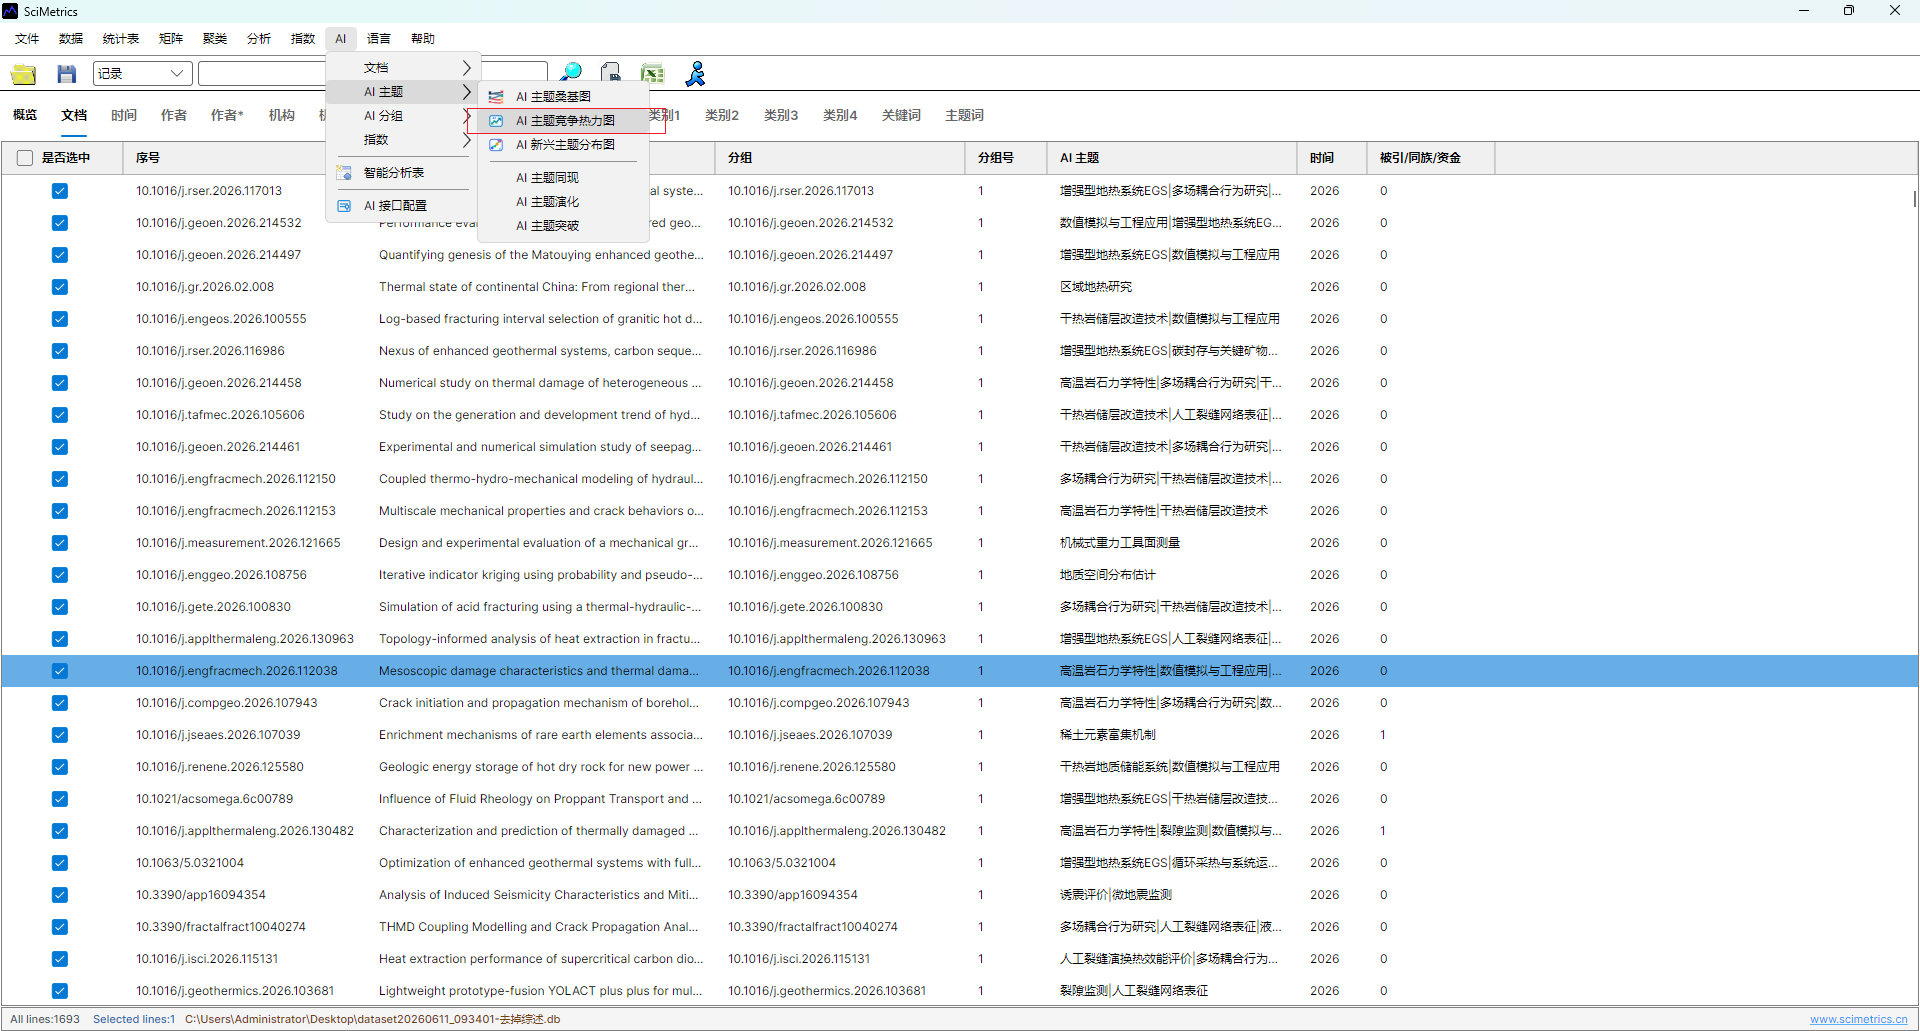
Interface Screenshots
The screenshots below are retained to verify menu entries, parameter settings, result views, and export locations.
AI Author Mapping
Match raw author records to a school, college, team, or expert roster for evidence-based services.
AI Author Mapping
AI author mapping matches raw author names from literature records to a school, college, team, or expert roster. It is designed for locating internal publications, distinguishing same-name authors, and preparing researcher-level service reports.
Typical Input
- A literature dataset with author or corresponding-author records.
- A roster that contains standard names, departments, colleges, or other disambiguation clues.
- Institution and title information in the source data whenever possible.
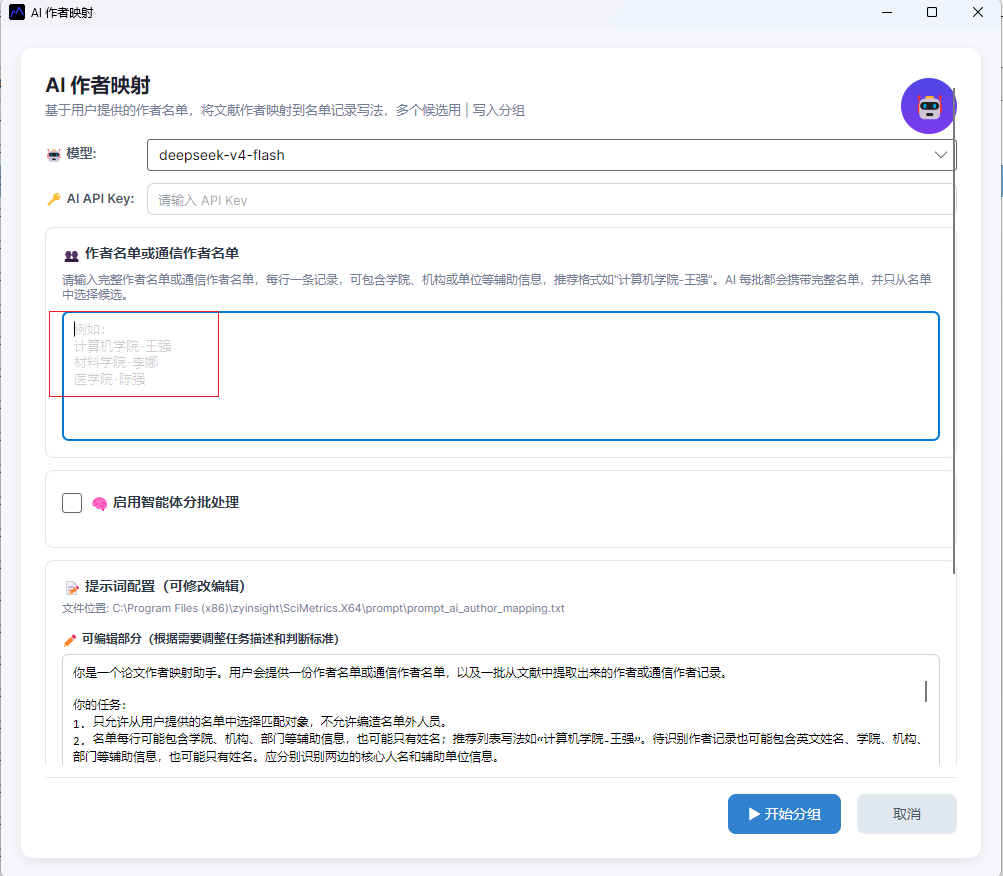
Workflow
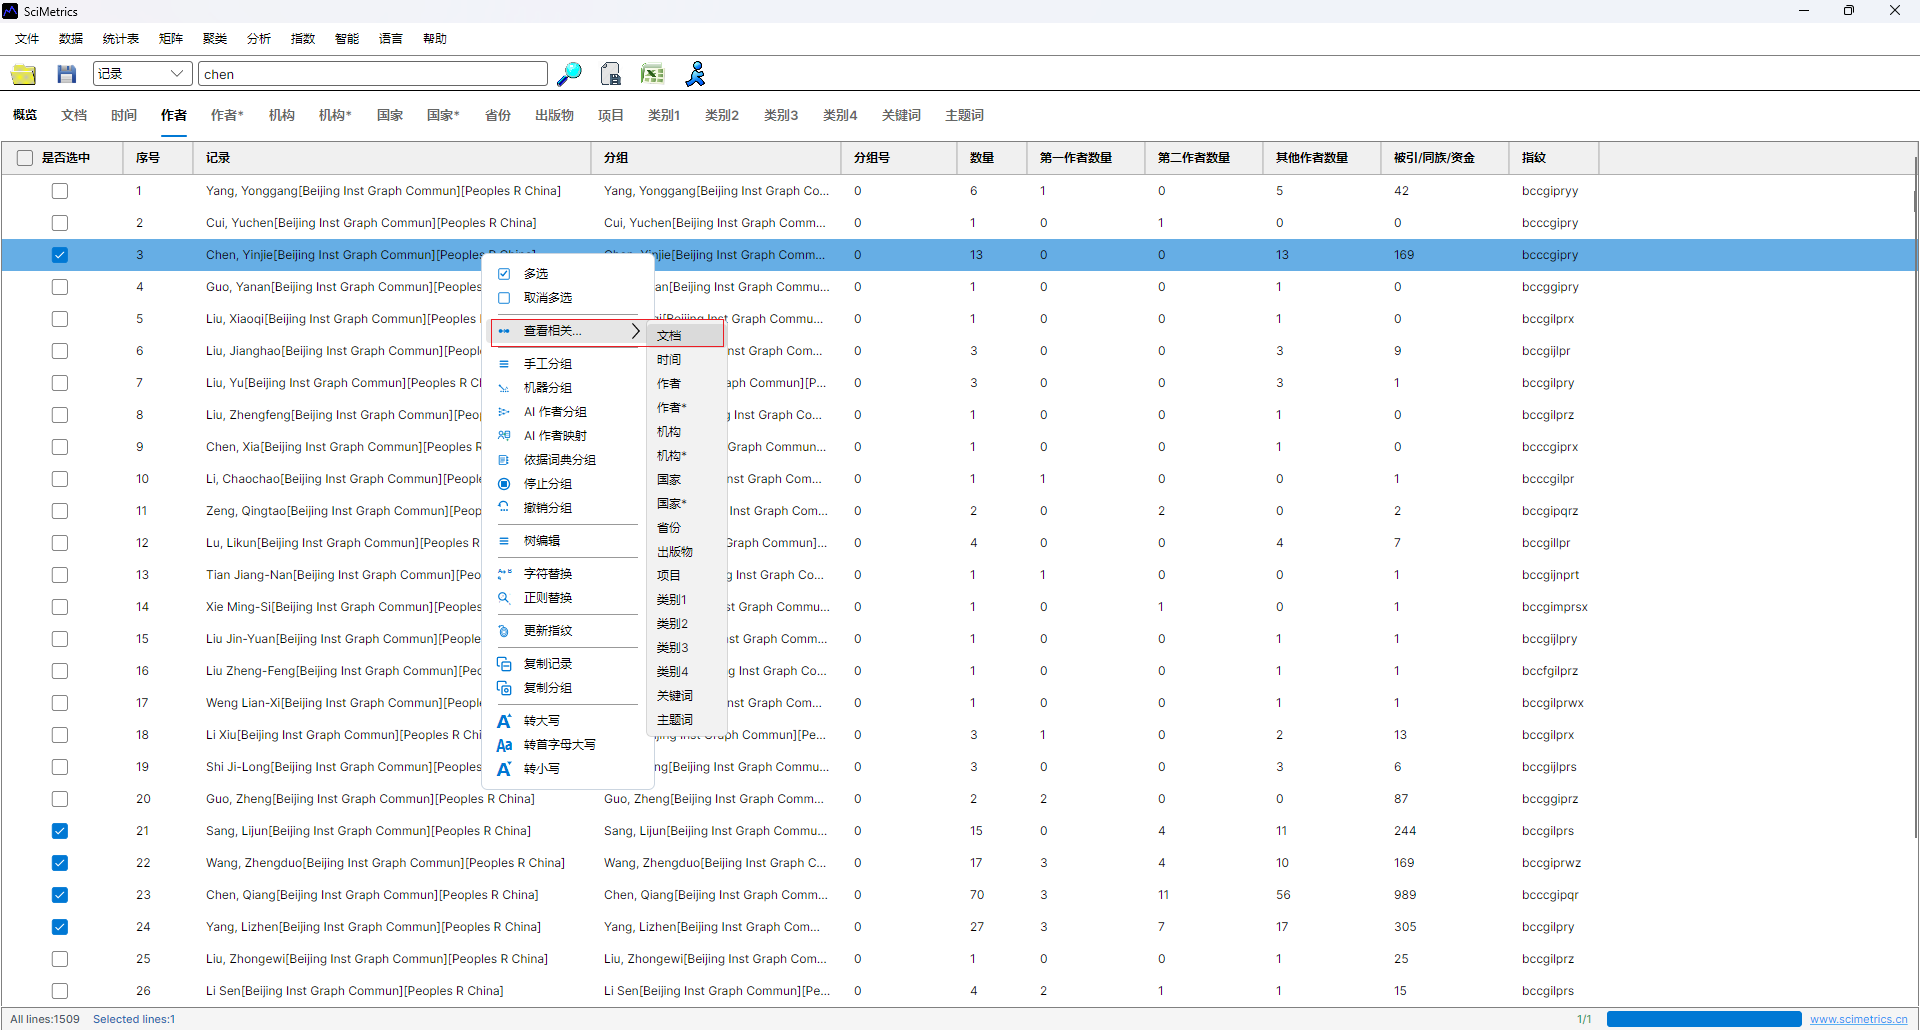
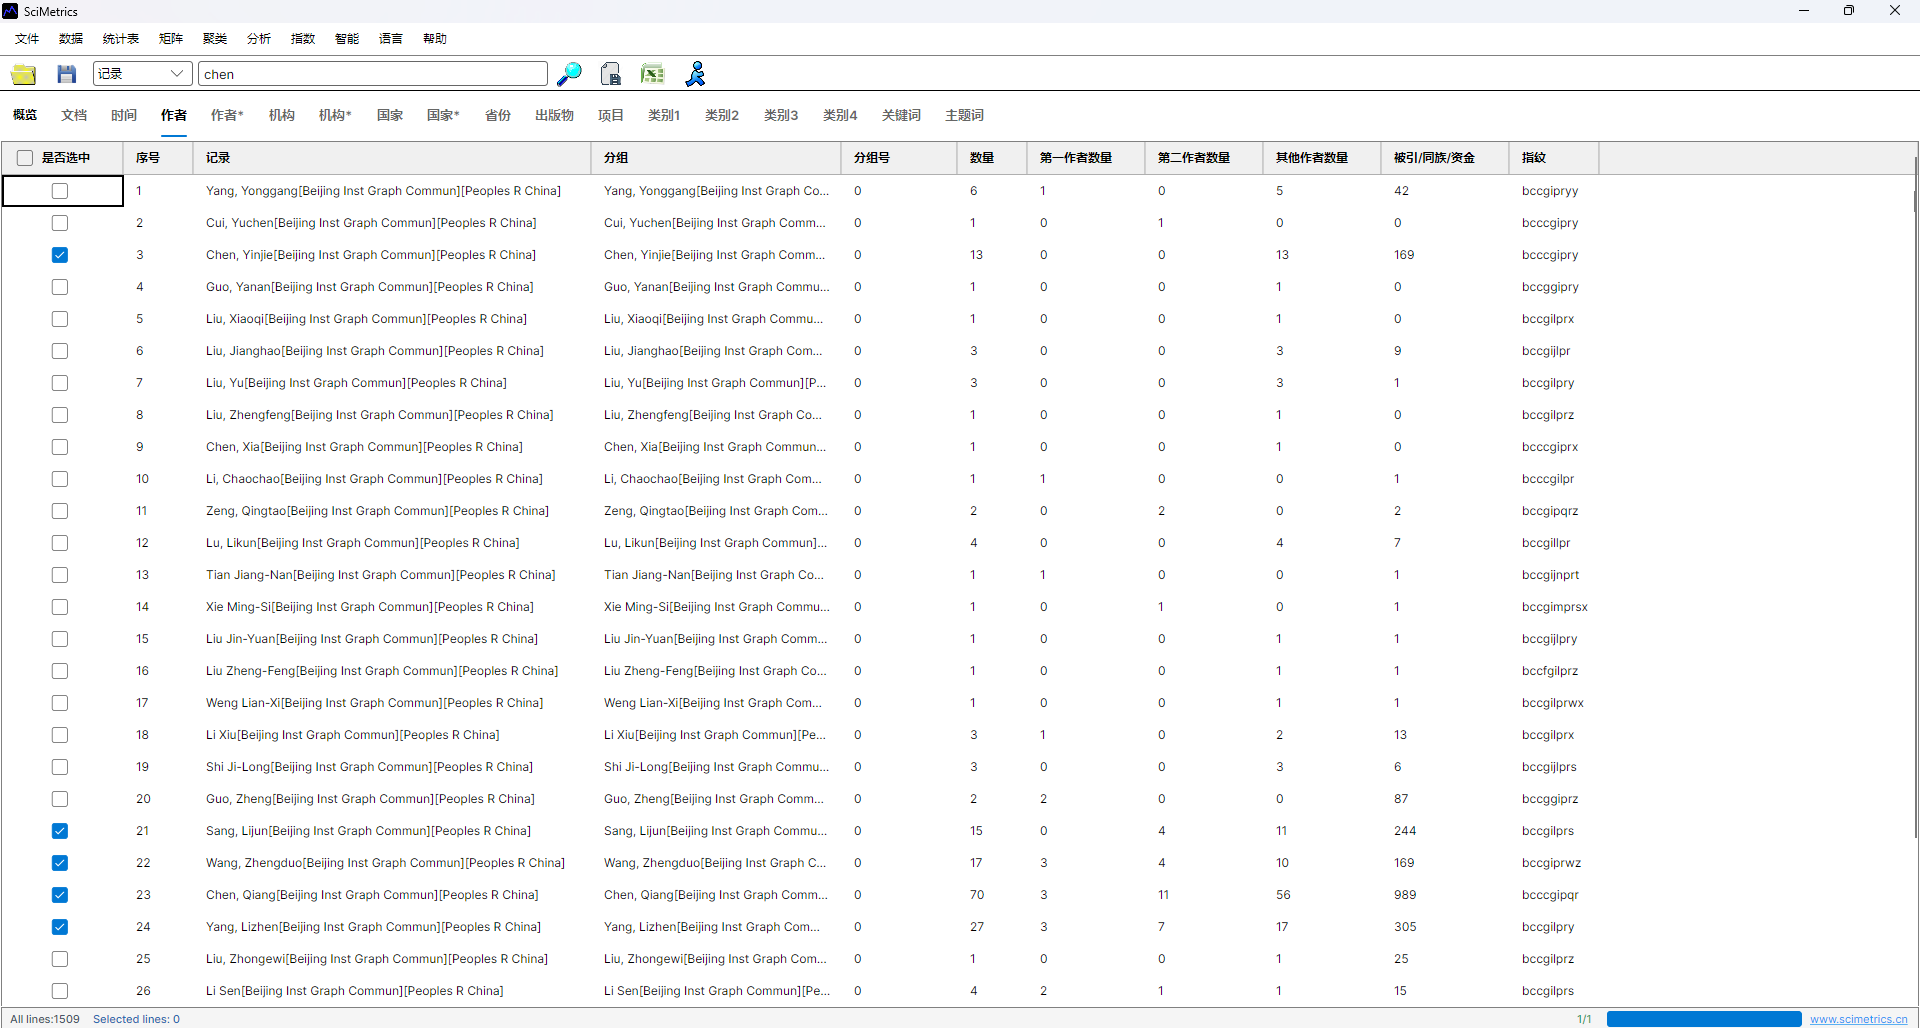
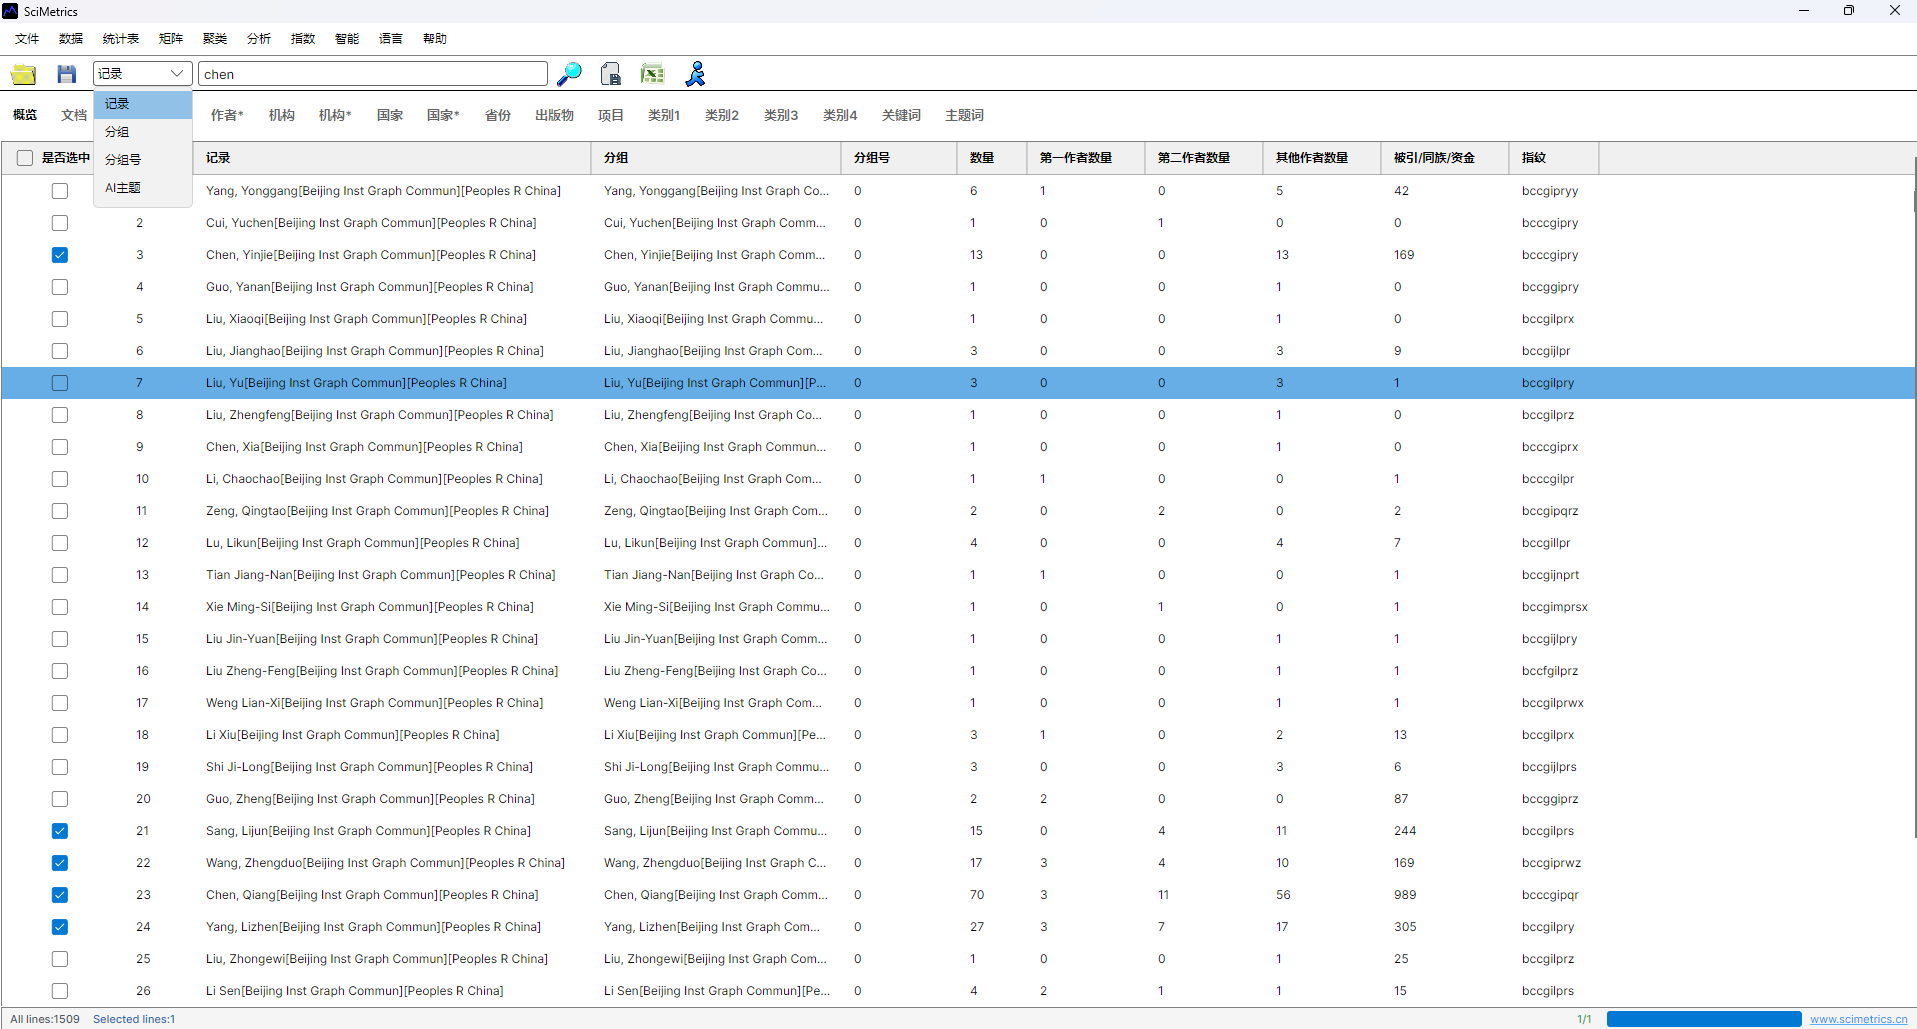
- Open the author table or corresponding-author table.
- Select the author records that need mapping.
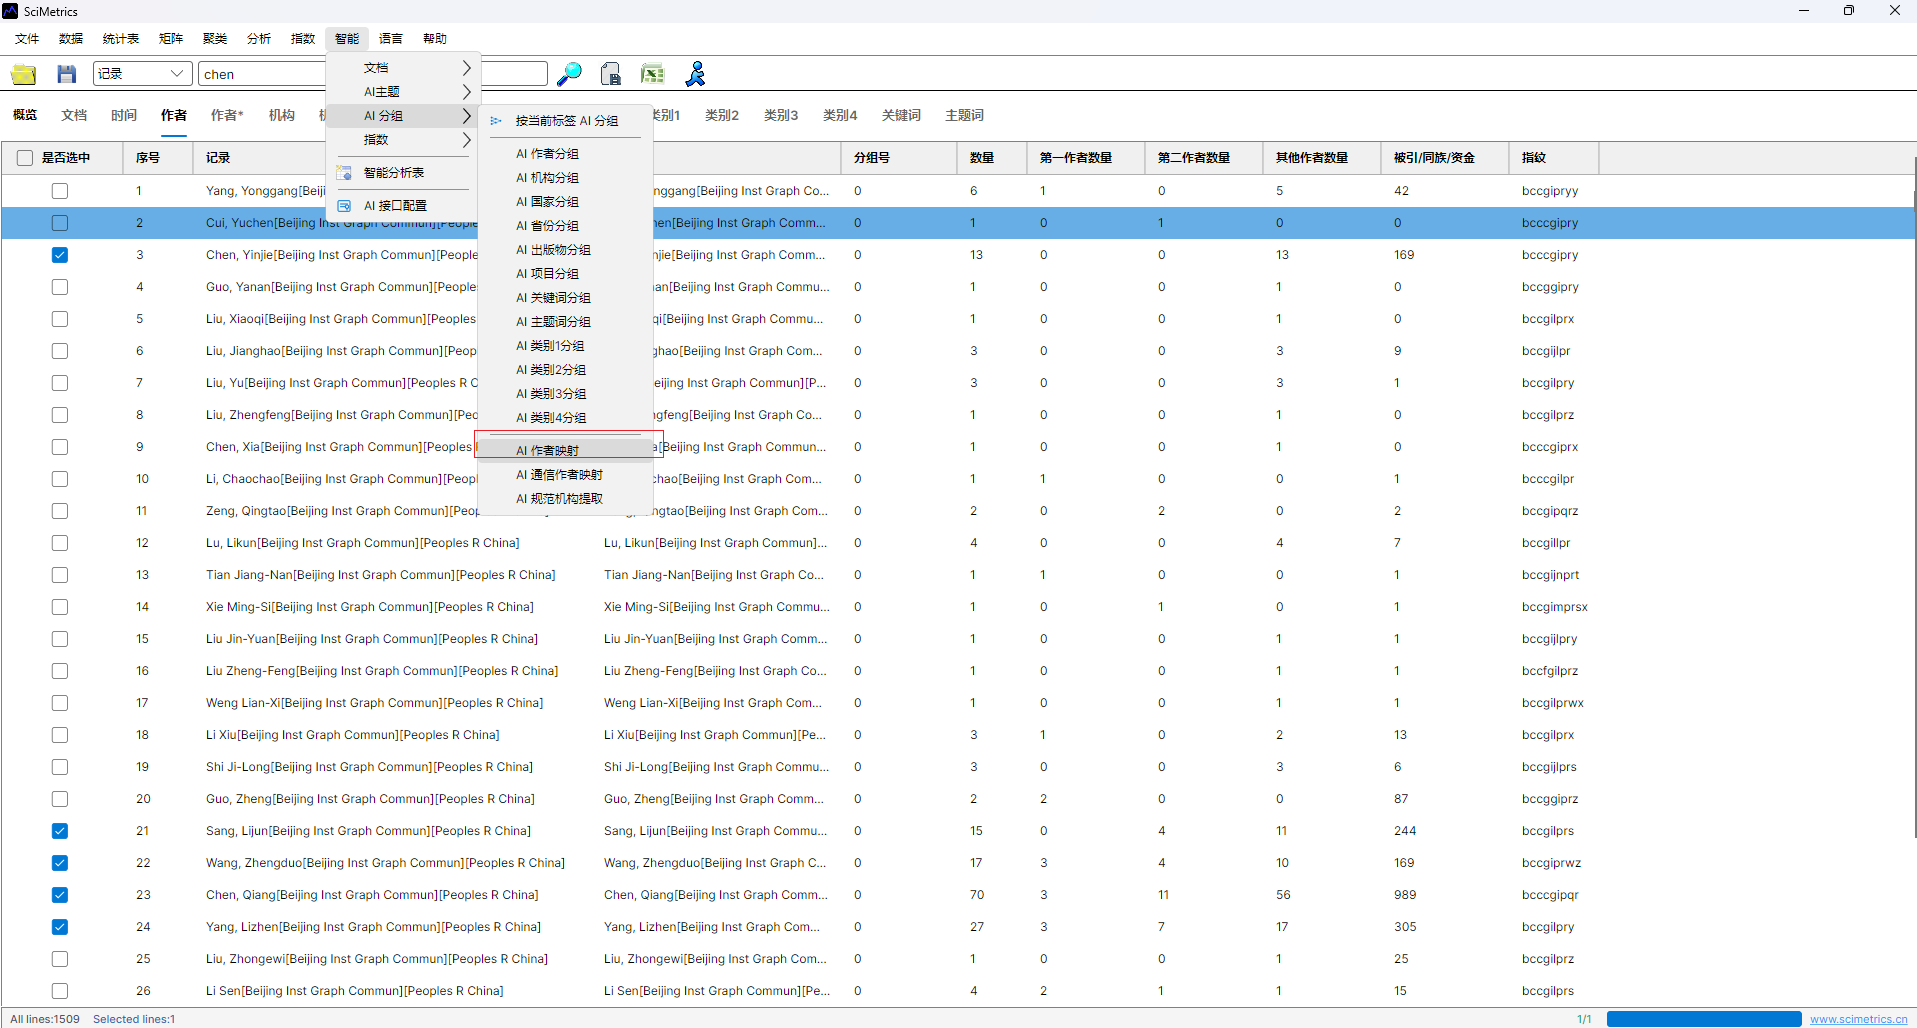
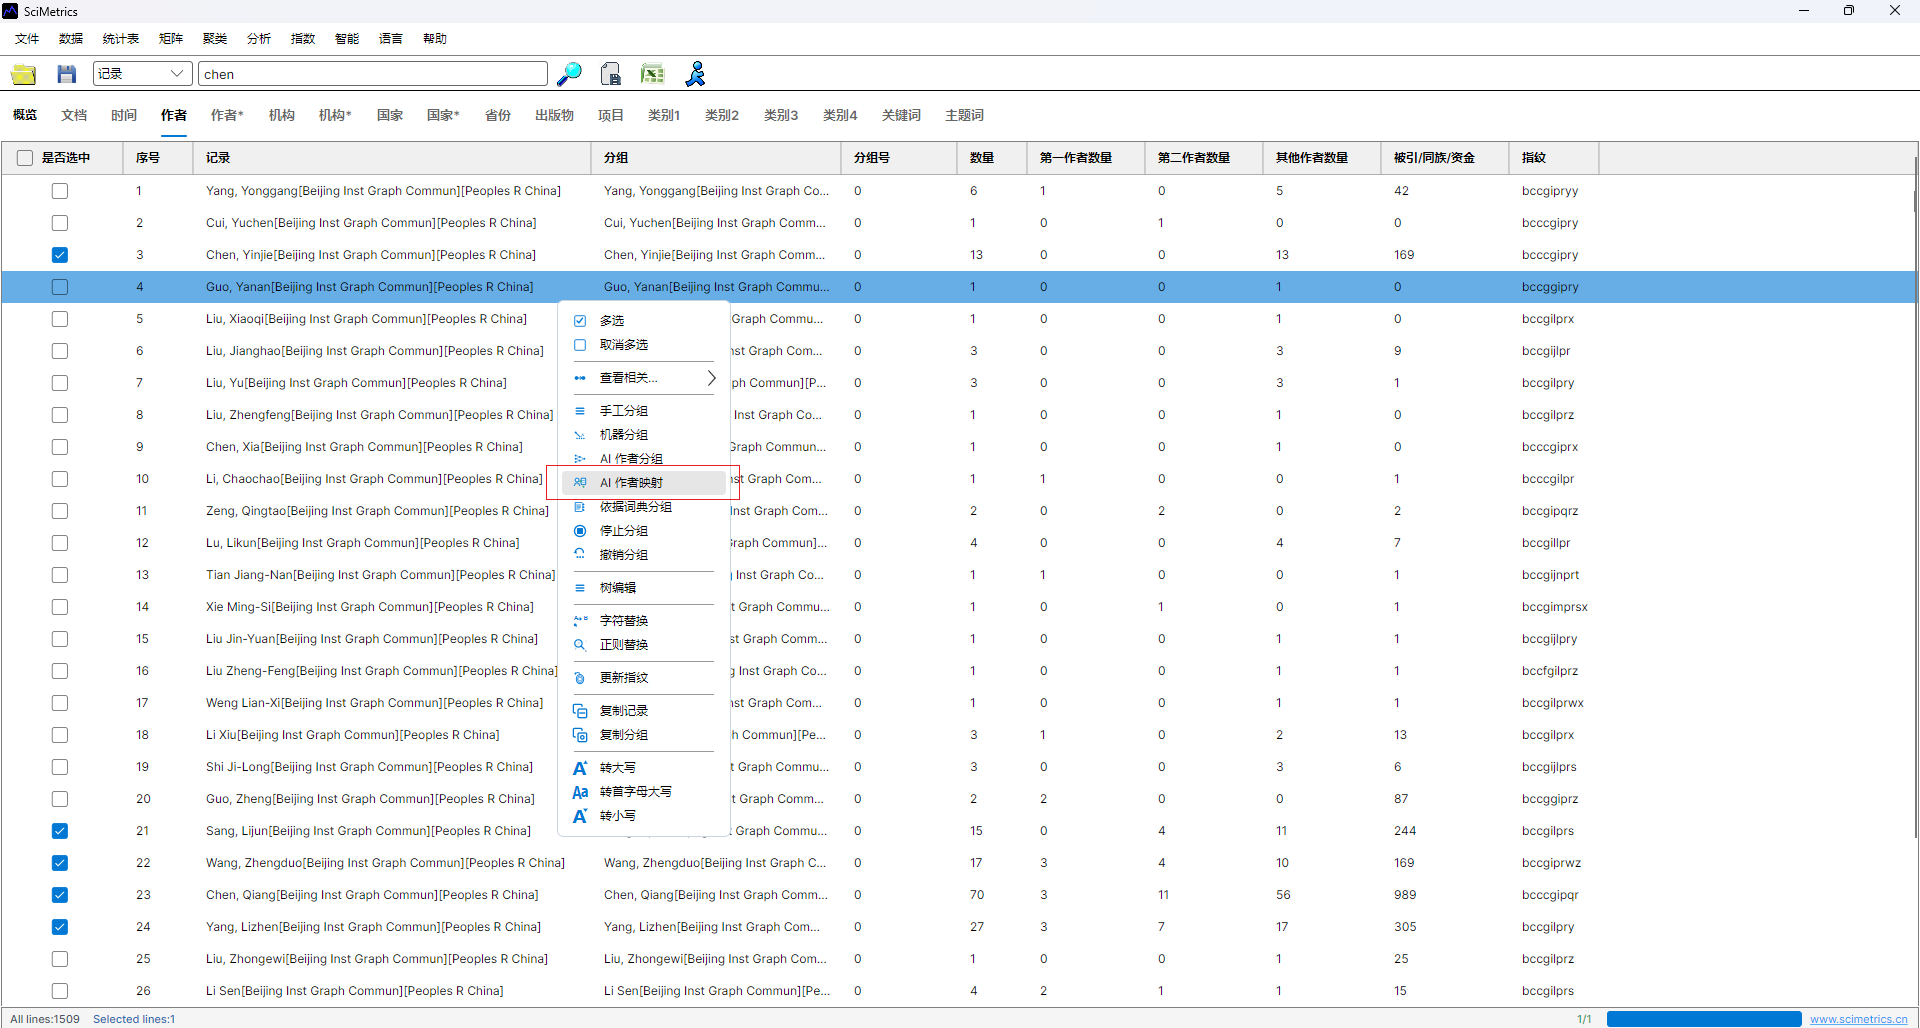
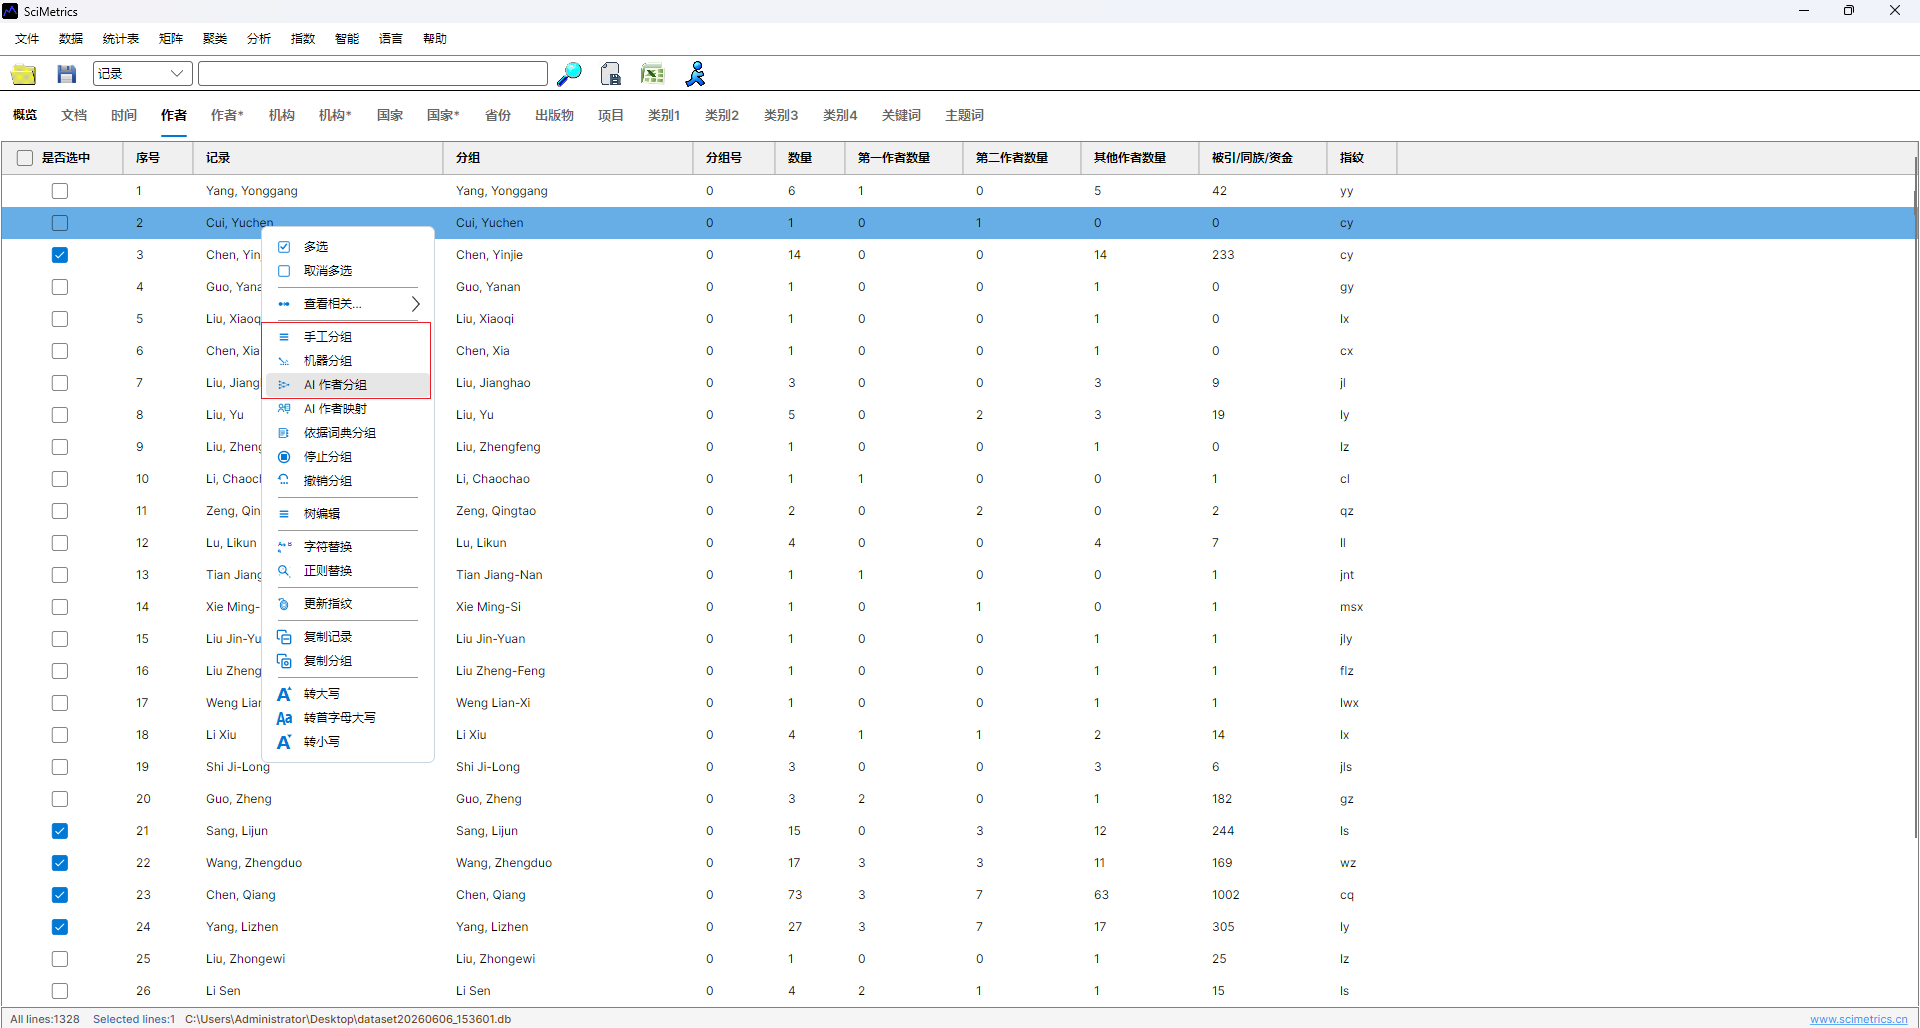
- Open
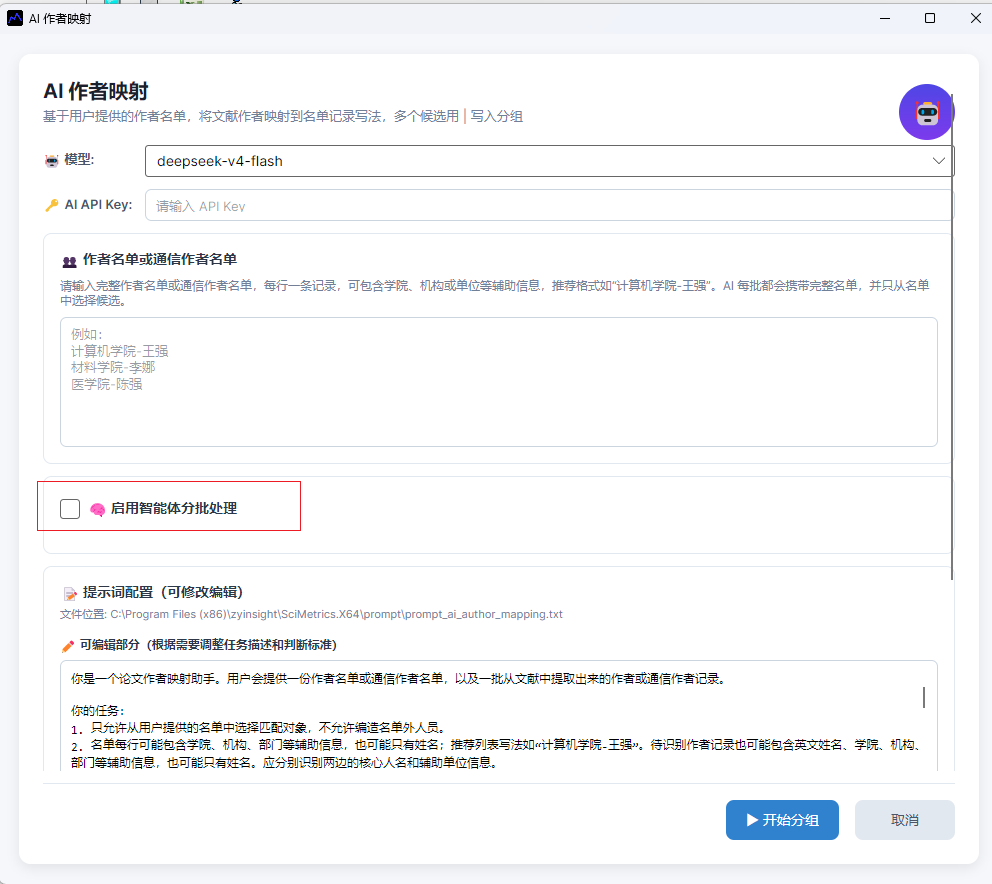
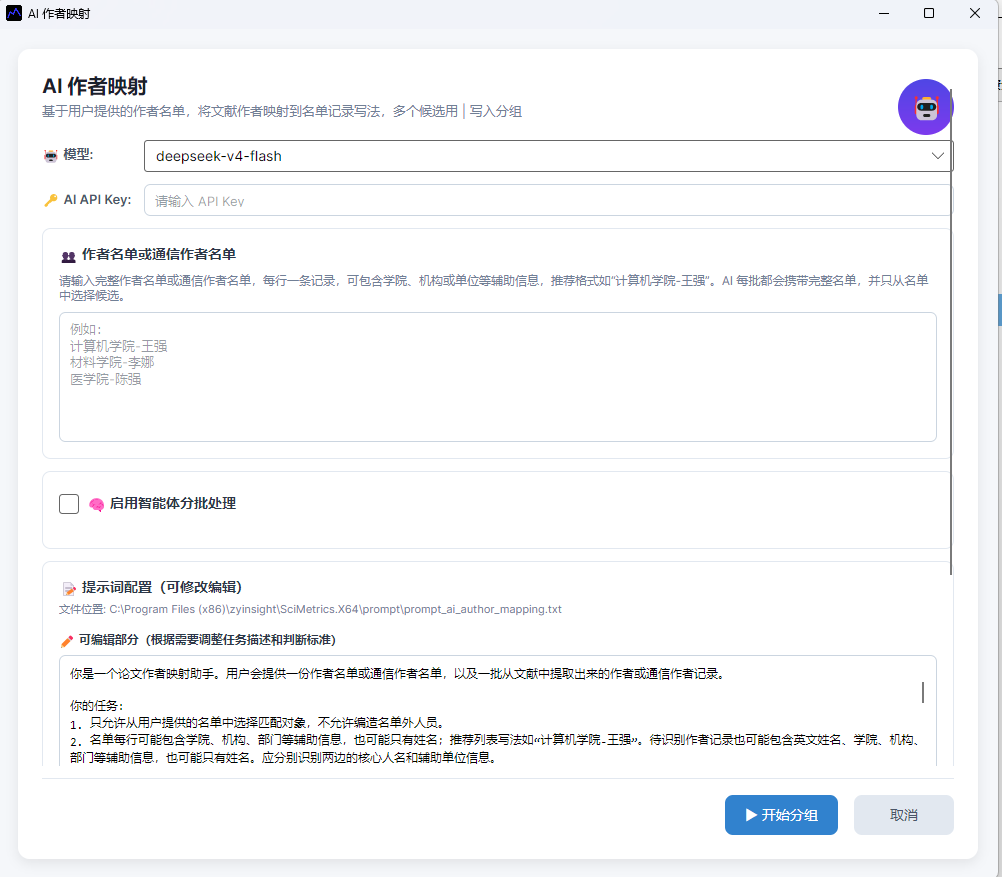
Intelligence -> AI Grouping -> AI Author Mapping, or use the author table right-click menu. - Select the AI model and API key.
- Paste the standard roster.
- Enable batching when many records are selected.
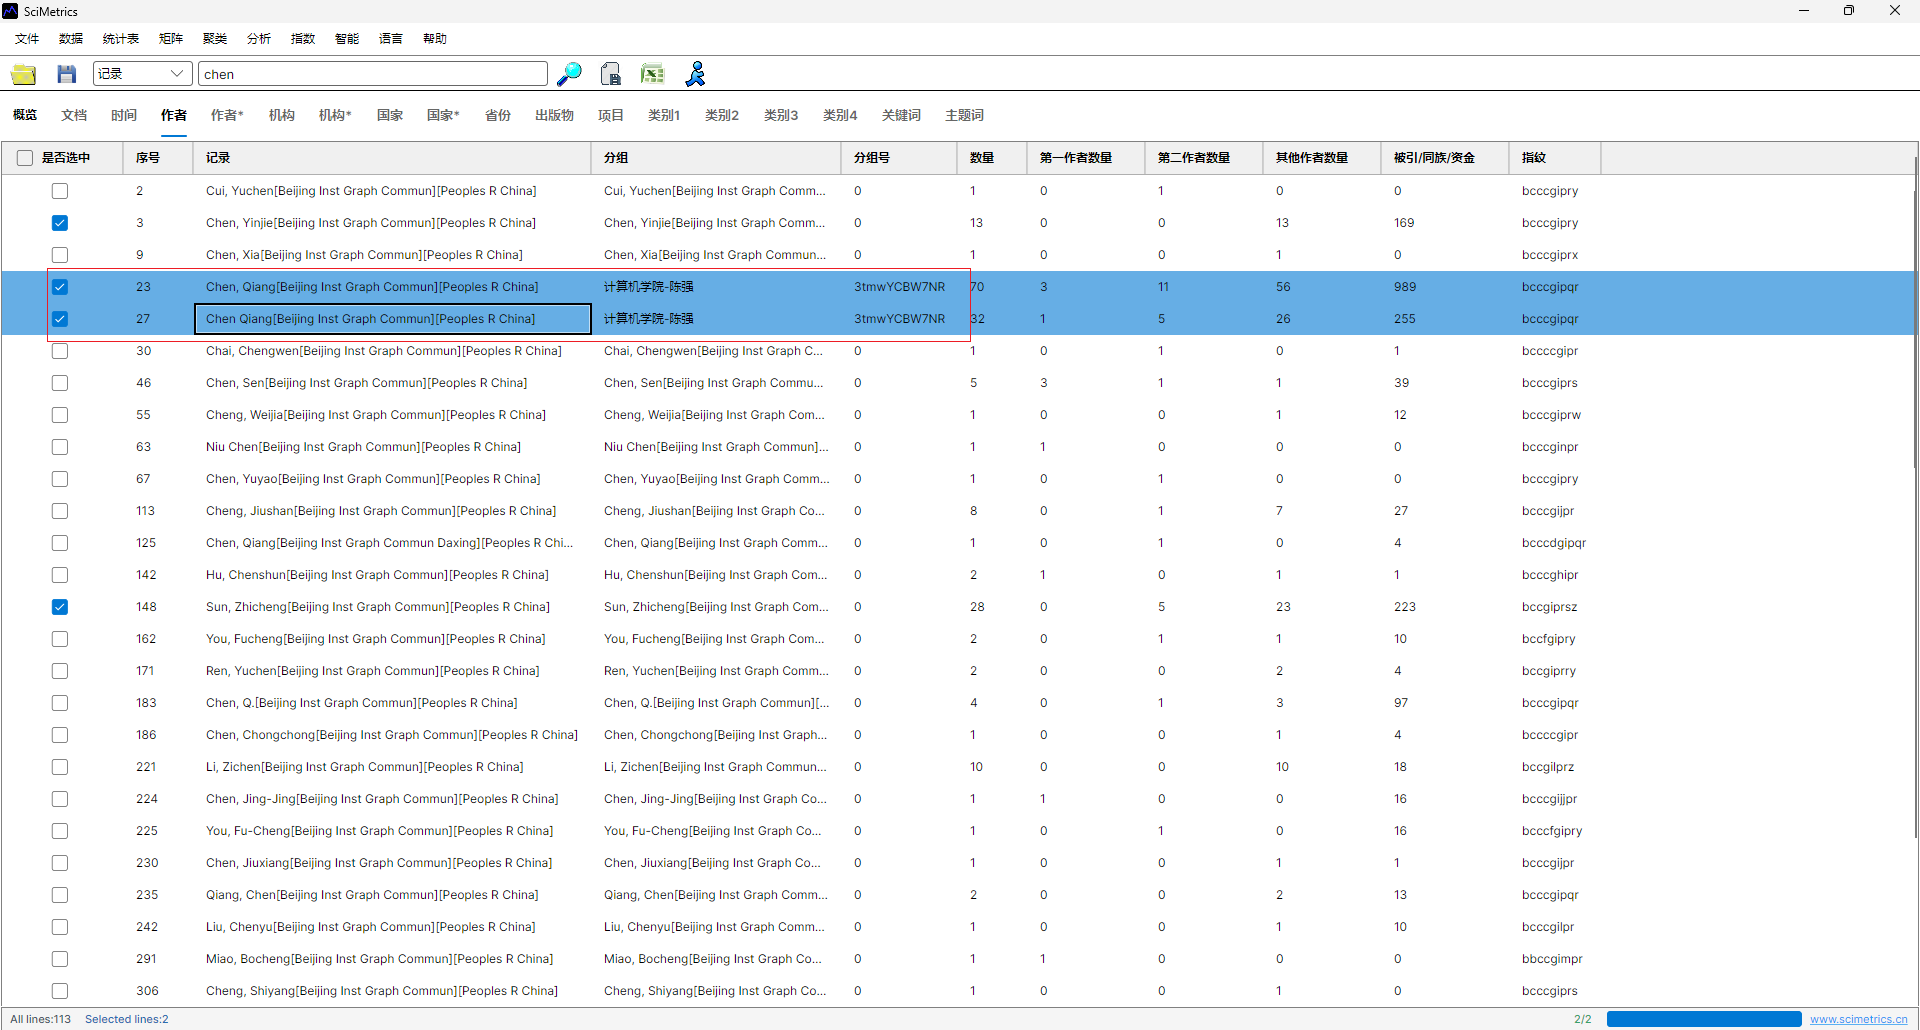
- Run the mapping and review the written-back fields.
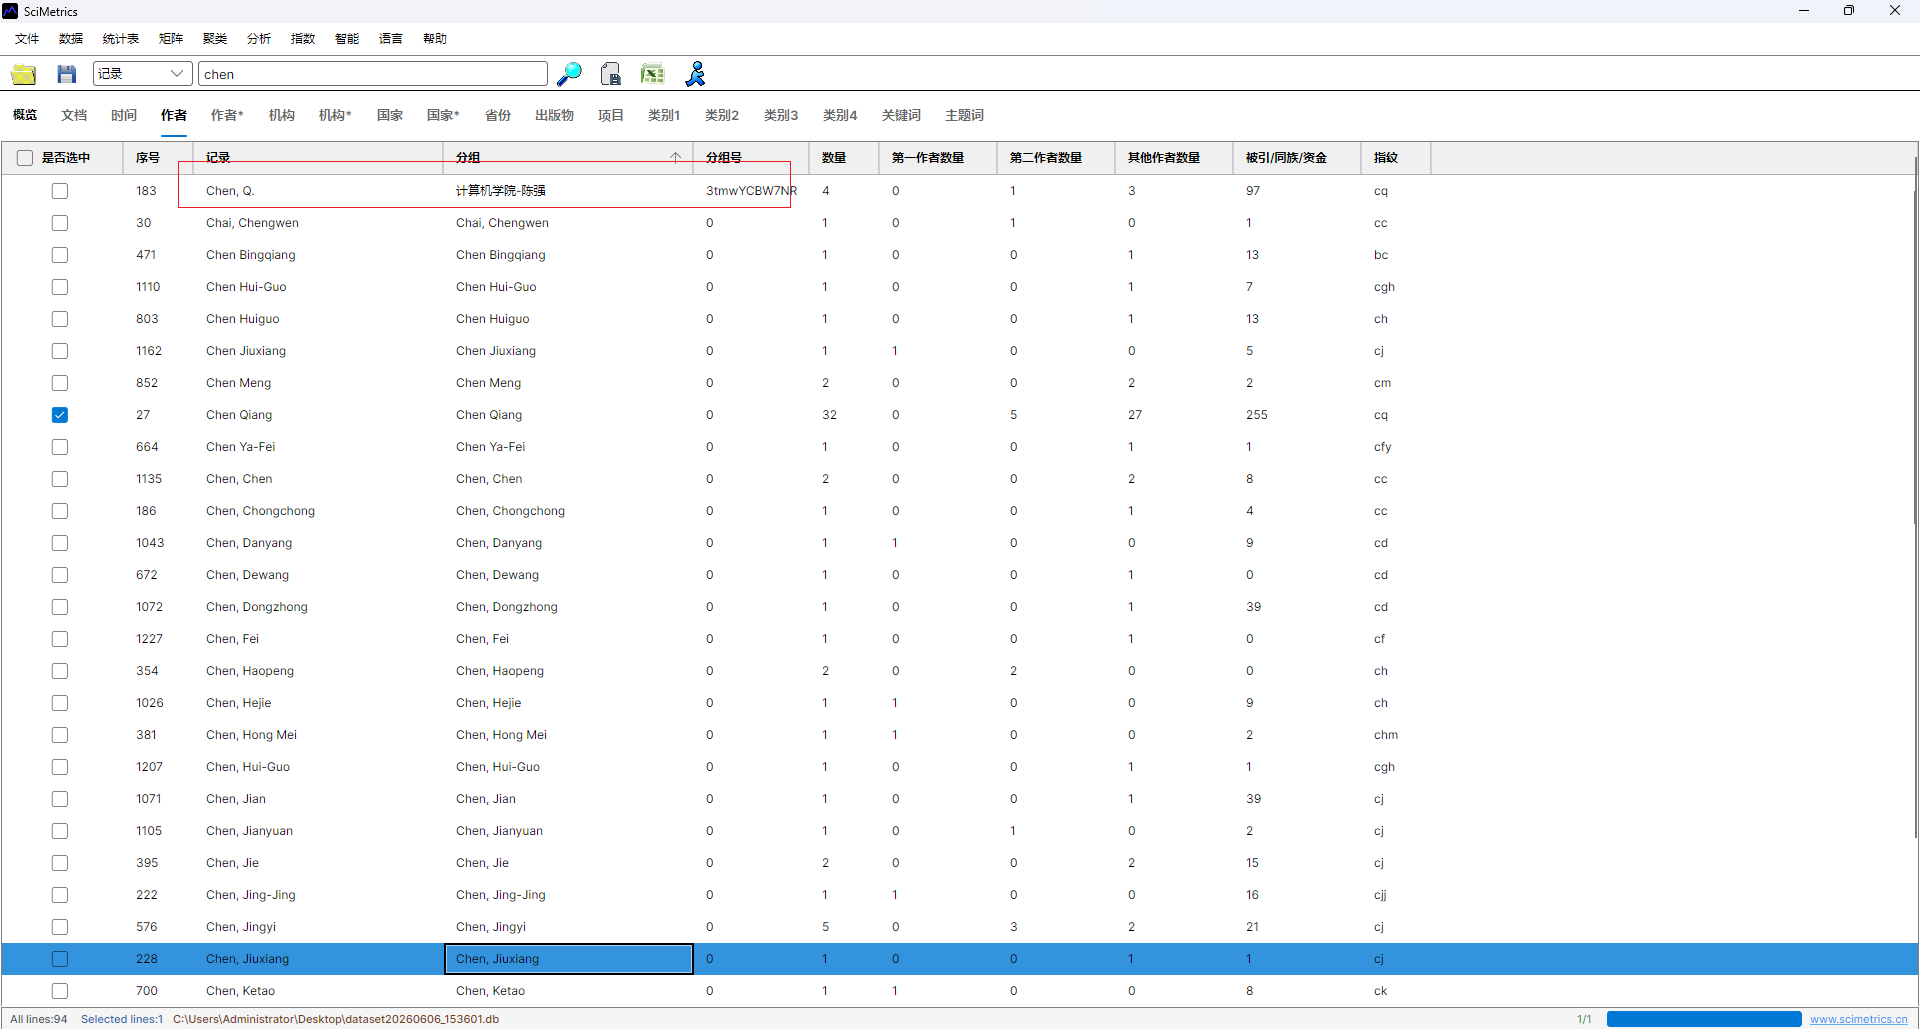
Result Fields
| Field | Meaning |
|---|---|
Record |
Raw author expression from the source data. |
Group |
Standard roster identity chosen by AI. |
GroupId |
Mapping status, usually including matched, ambiguous, or model information. |
ParId |
Parent grouping information. |
Review Guidance
AI mapping improves efficiency, but author ownership should still be reviewed before formal delivery. Prioritize records with multiple candidates, short initials, missing institution data, same-name teachers, affiliated hospitals, joint appointments, or cross-college collaborations.
After review, use the Group field to locate publications, summarize output by college or teacher, and export evidence lists for service reports.
Interface Screenshots
The screenshots below are retained to verify menu entries, parameter settings, result views, and export locations.
AI Problem-Method Recognition
Extract problem, method, result, and contribution structures from papers.
AI Problem-Method Recognition (PMRC)
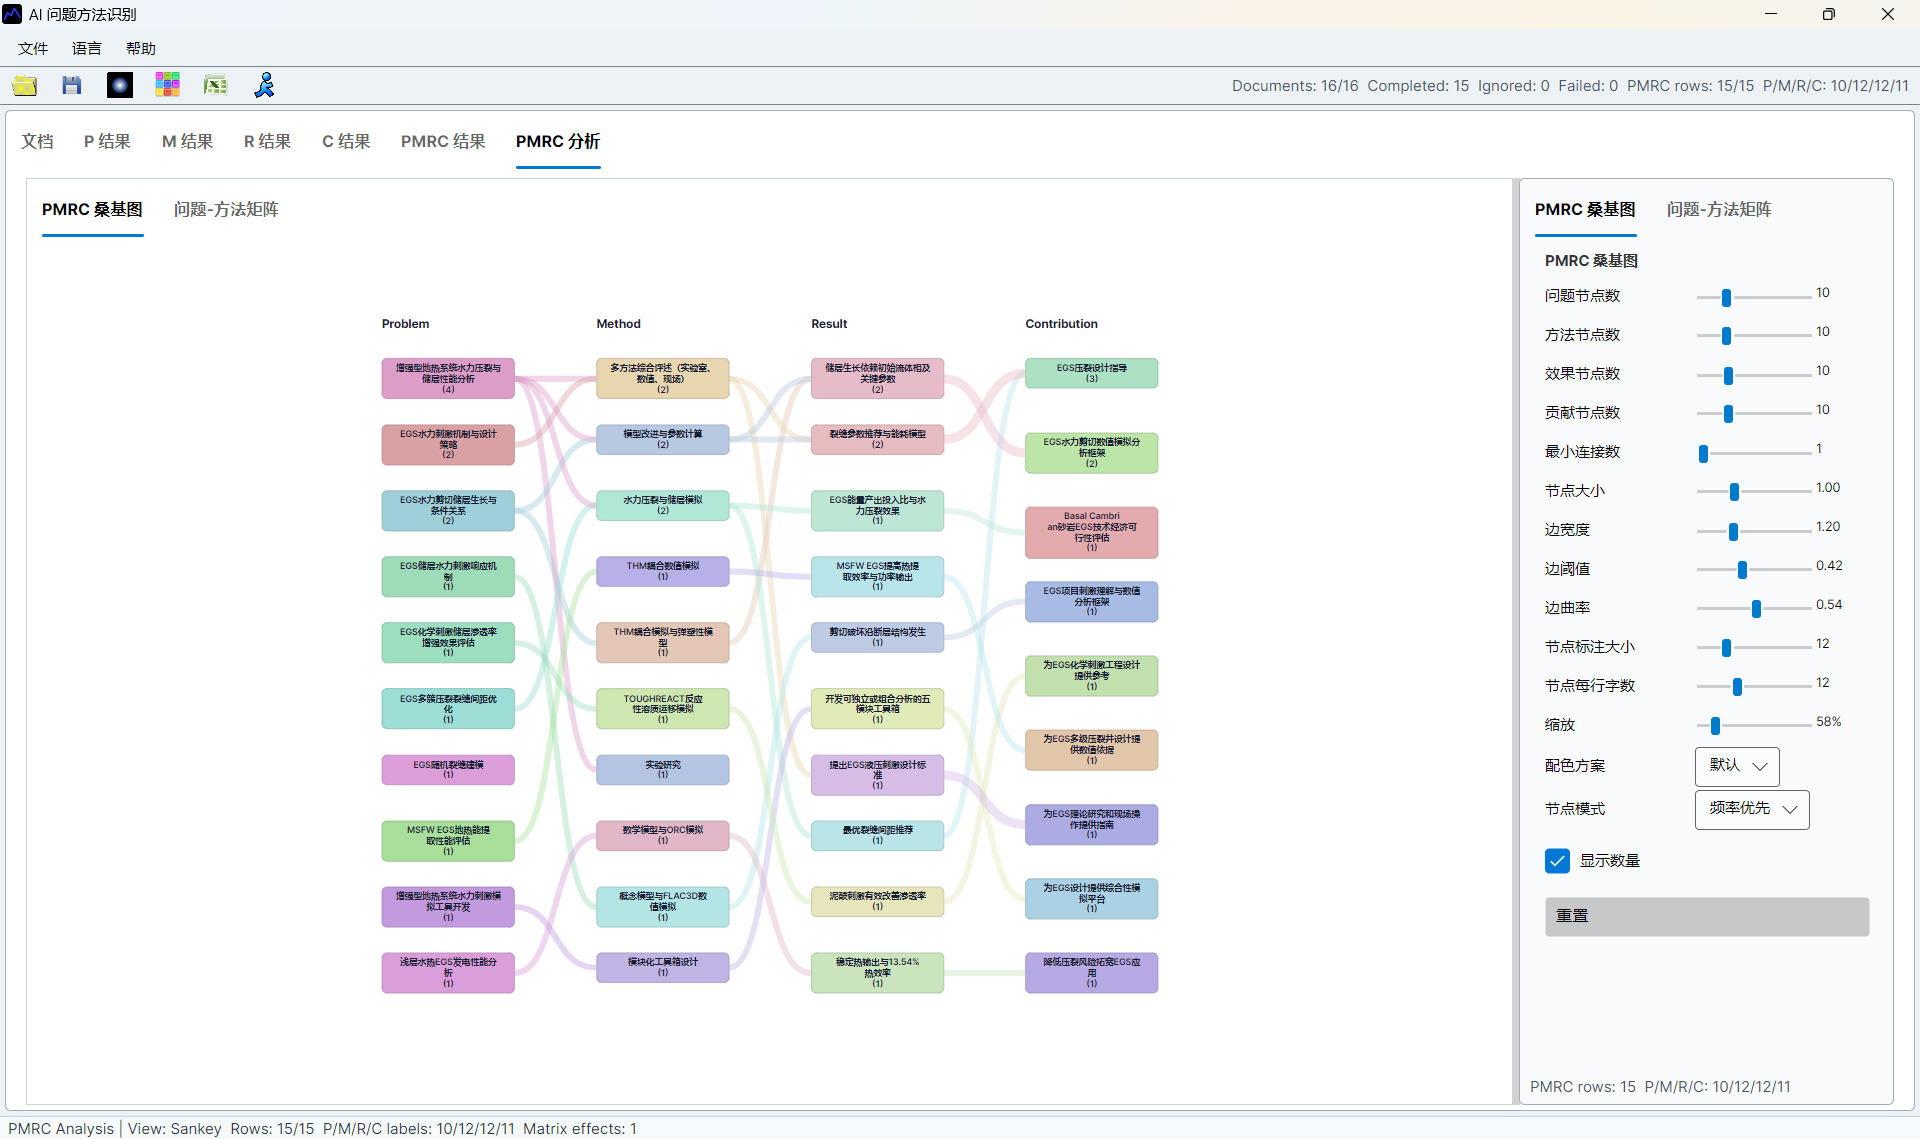
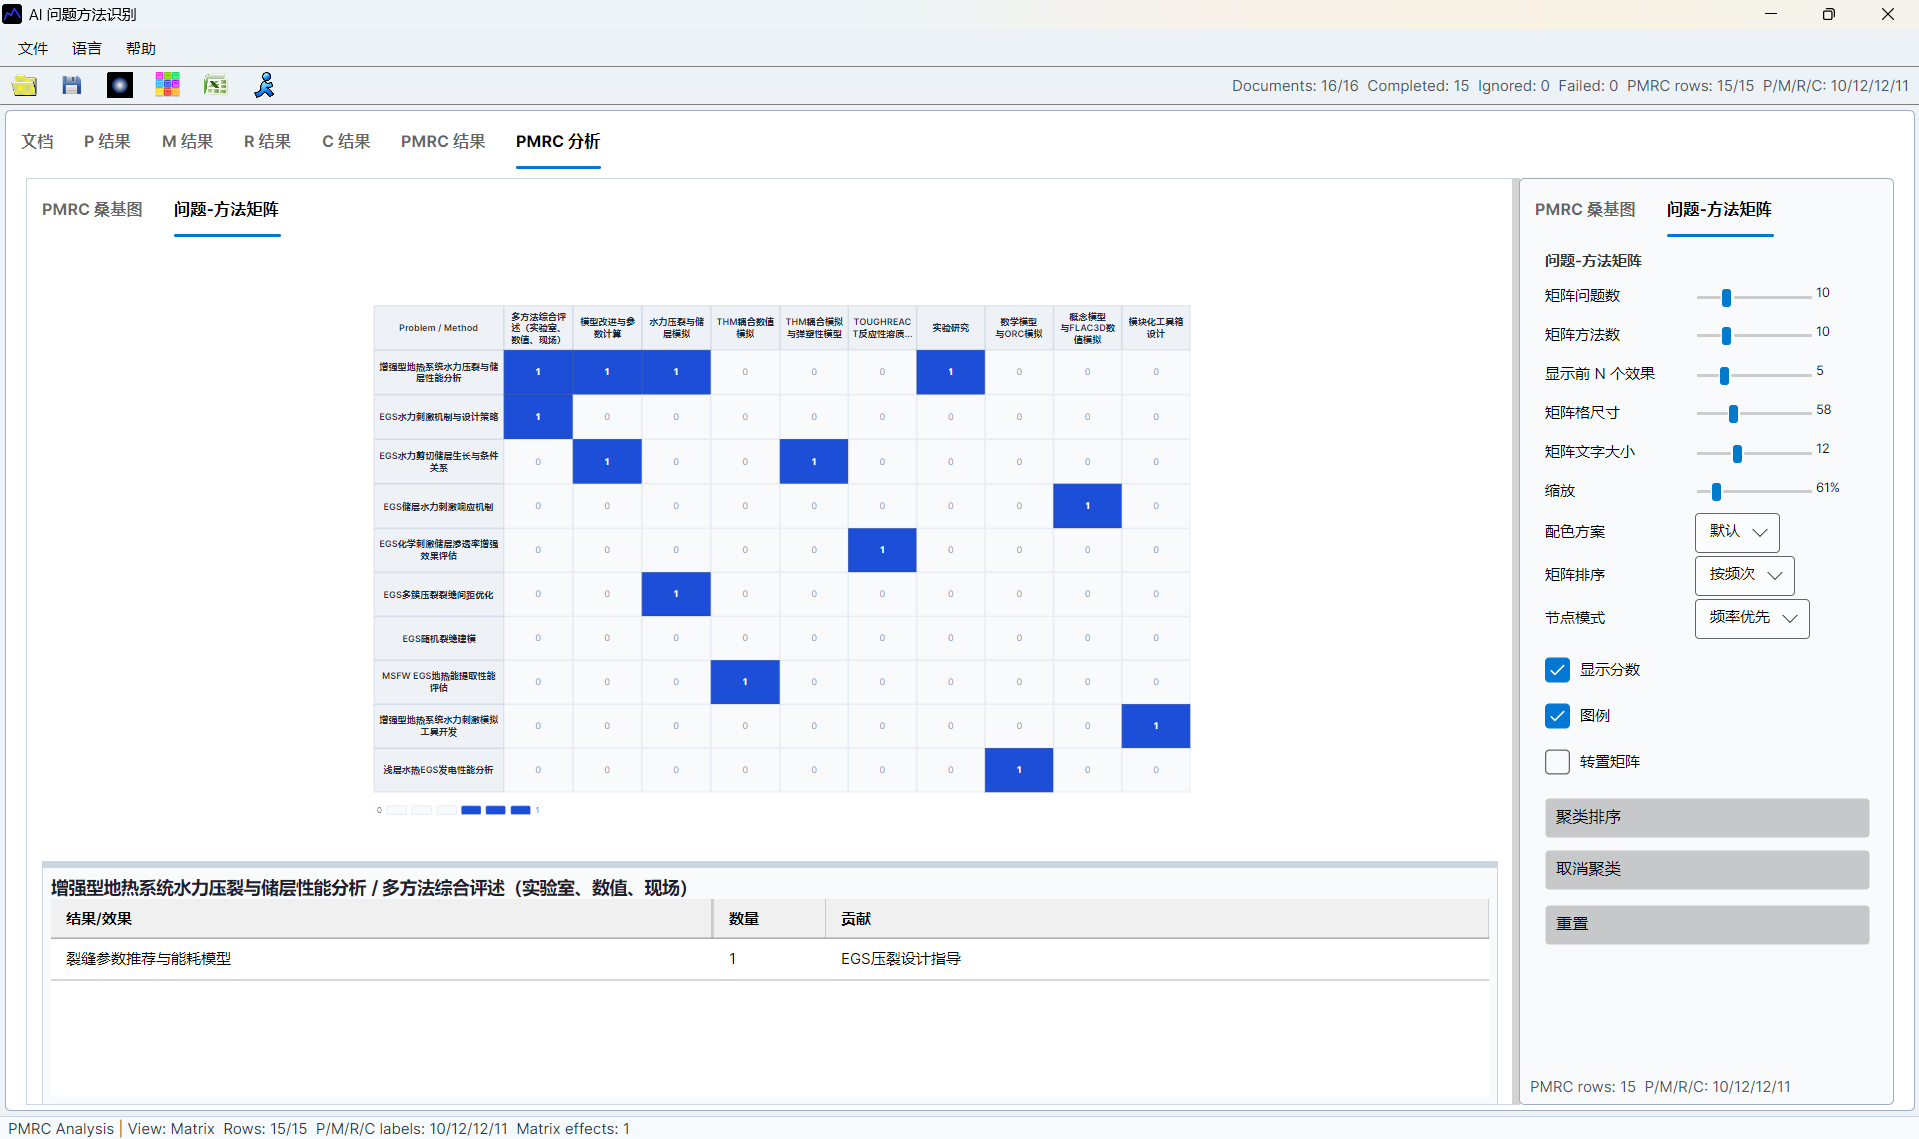
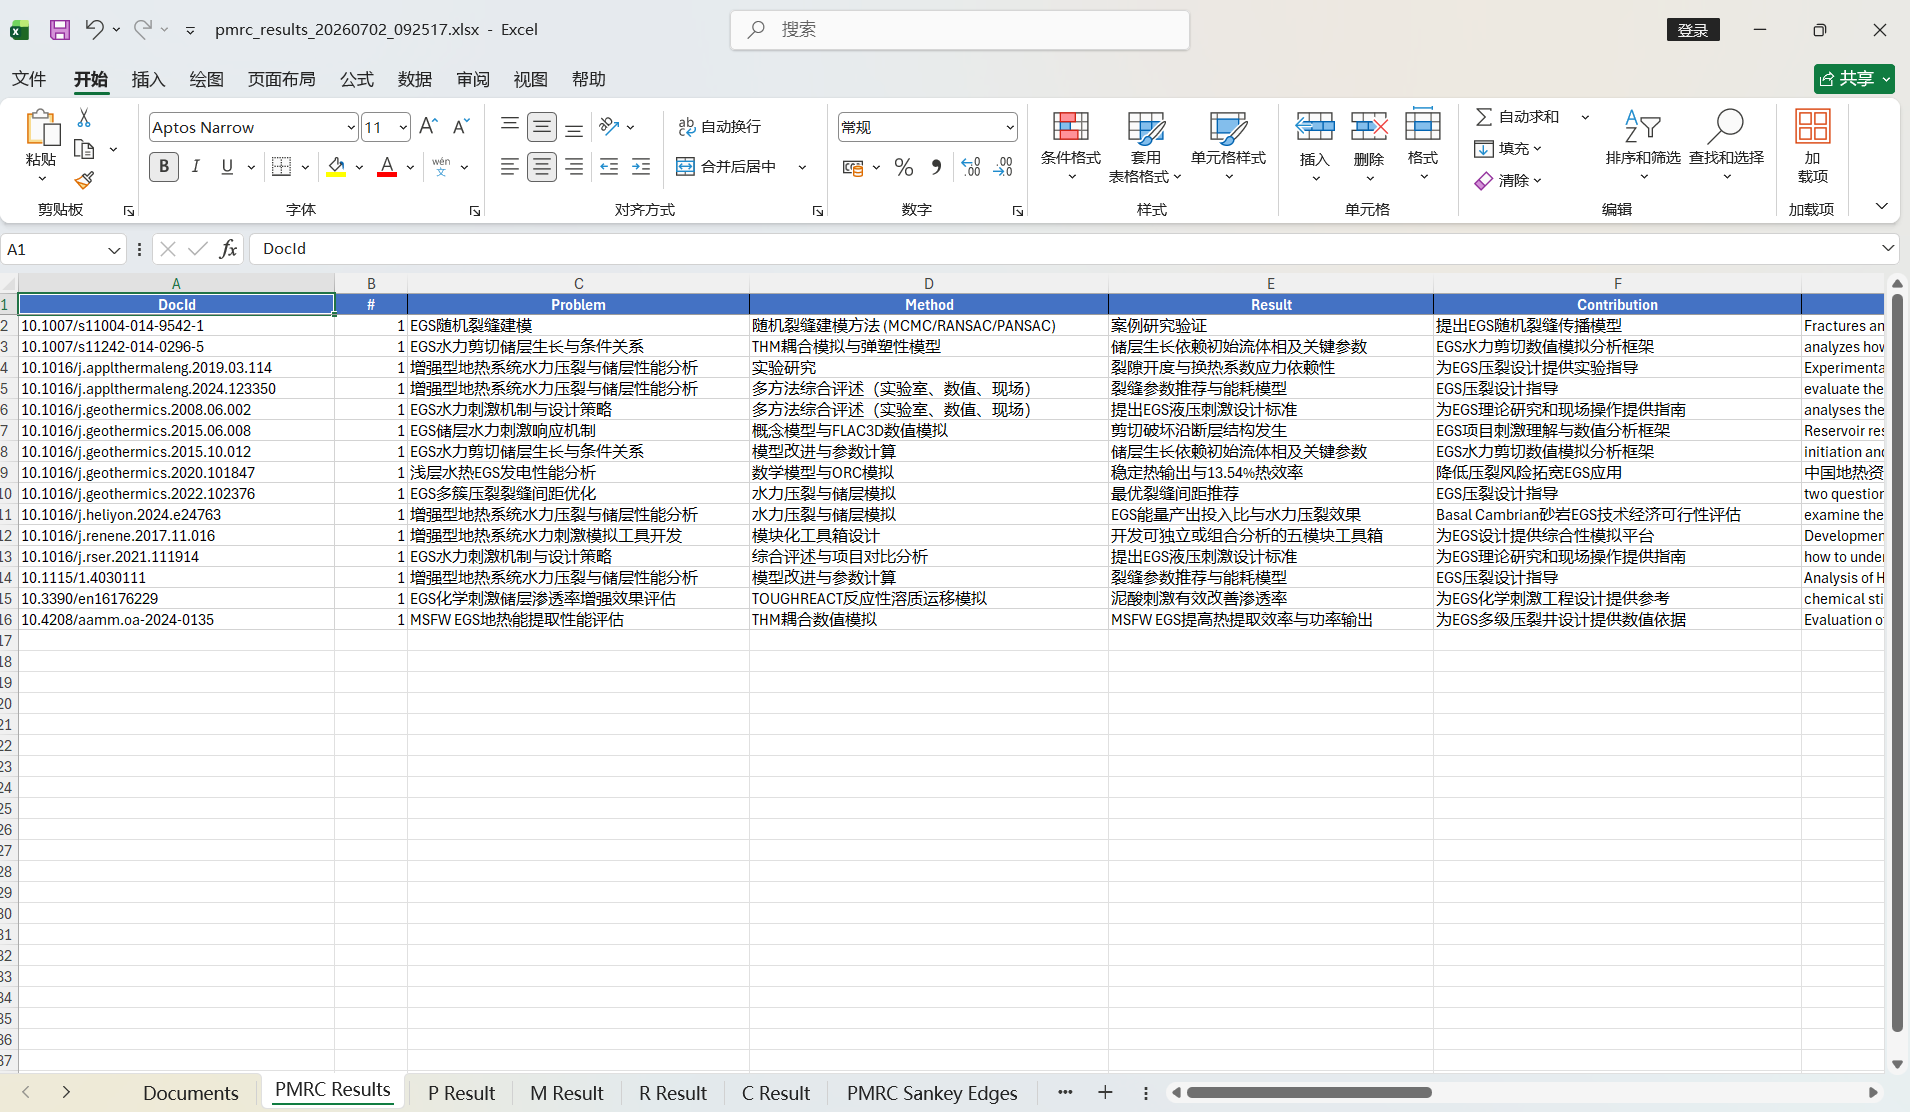
PMRC recognition extracts structured research logic from papers: problem, method, result, and contribution. It is different from topic labeling because it focuses on what problem a paper solves, how it solves it, what result it obtains, and what contribution it claims.
When To Use It
- Build a problem-method matrix for a research field.
- Discover common methods used to solve a class of problems.
- Identify gaps between research questions and available methods.
- Prepare structured evidence for review, consultation, or subject service reports.
Open The Window
Use one of the following entries:
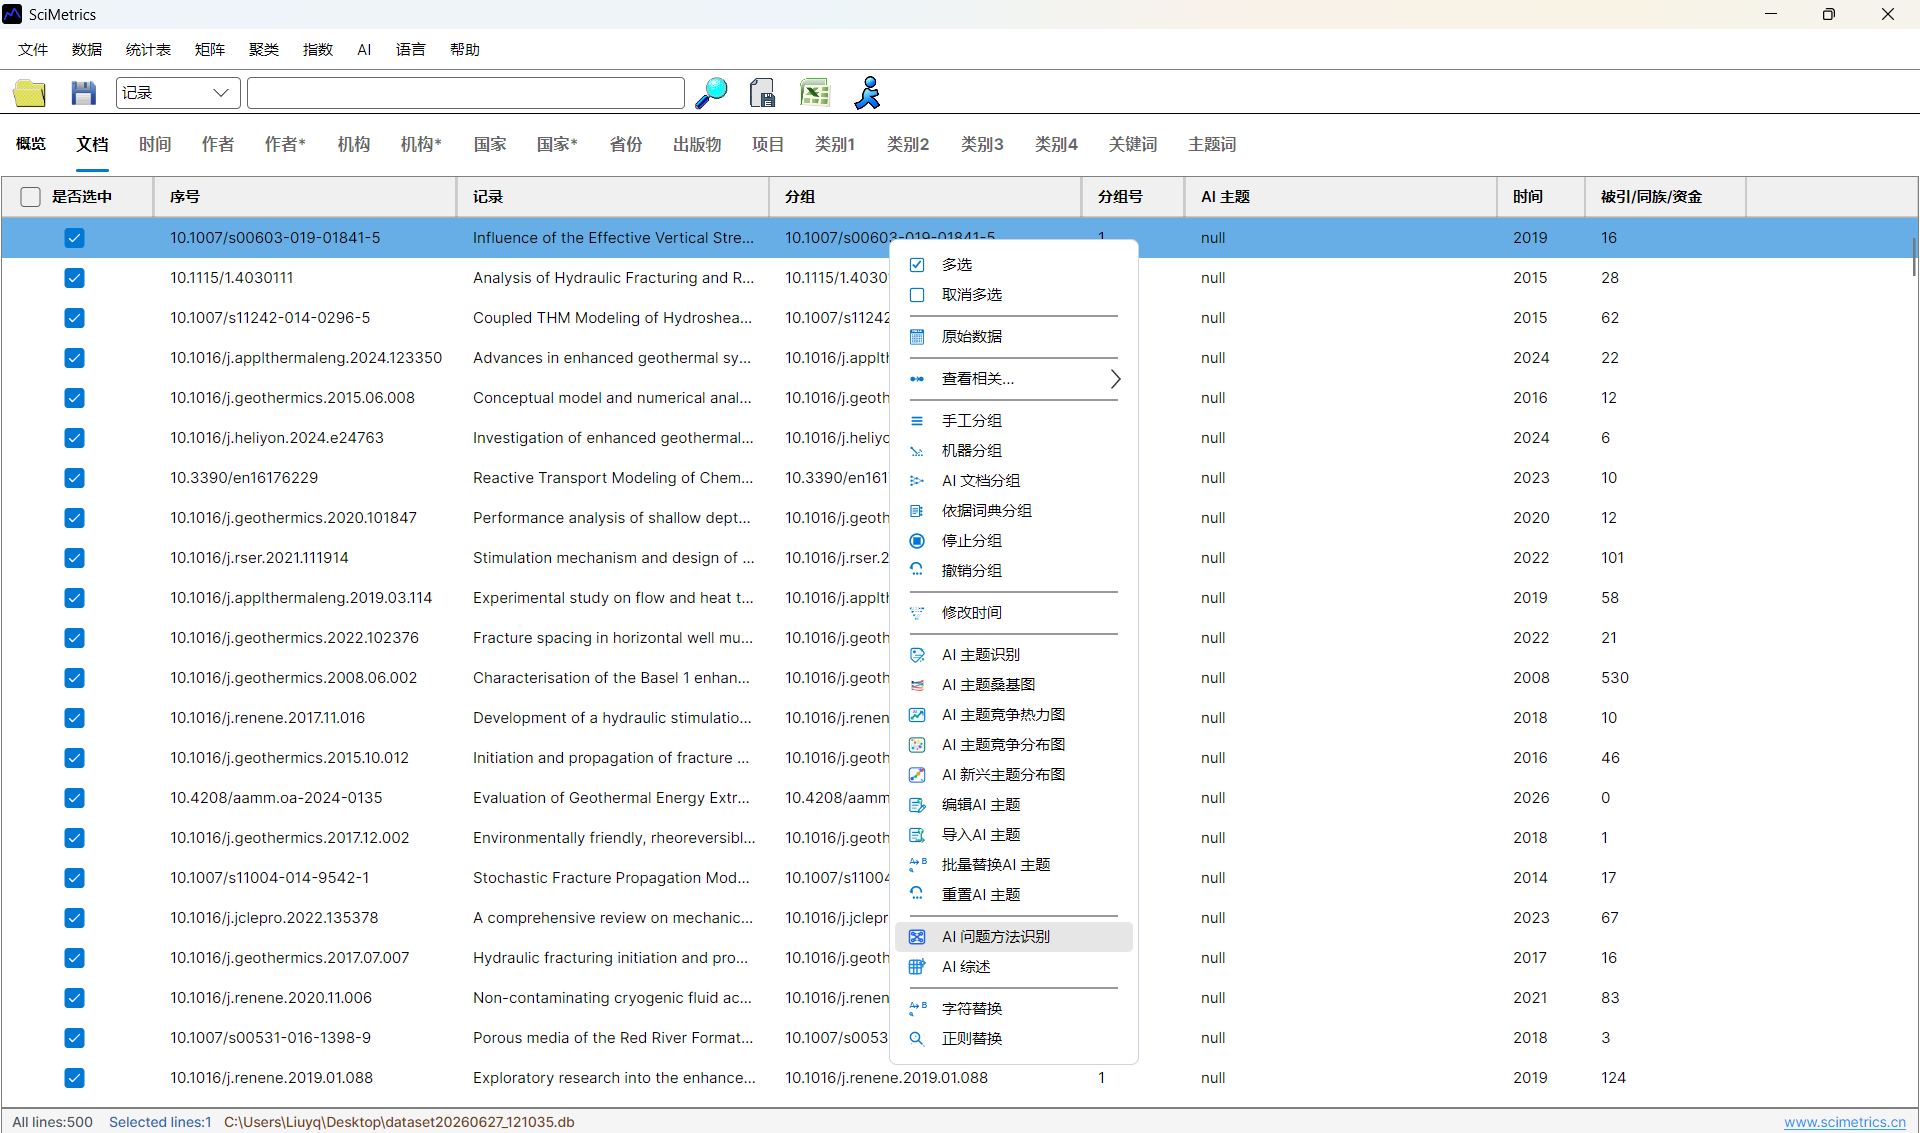
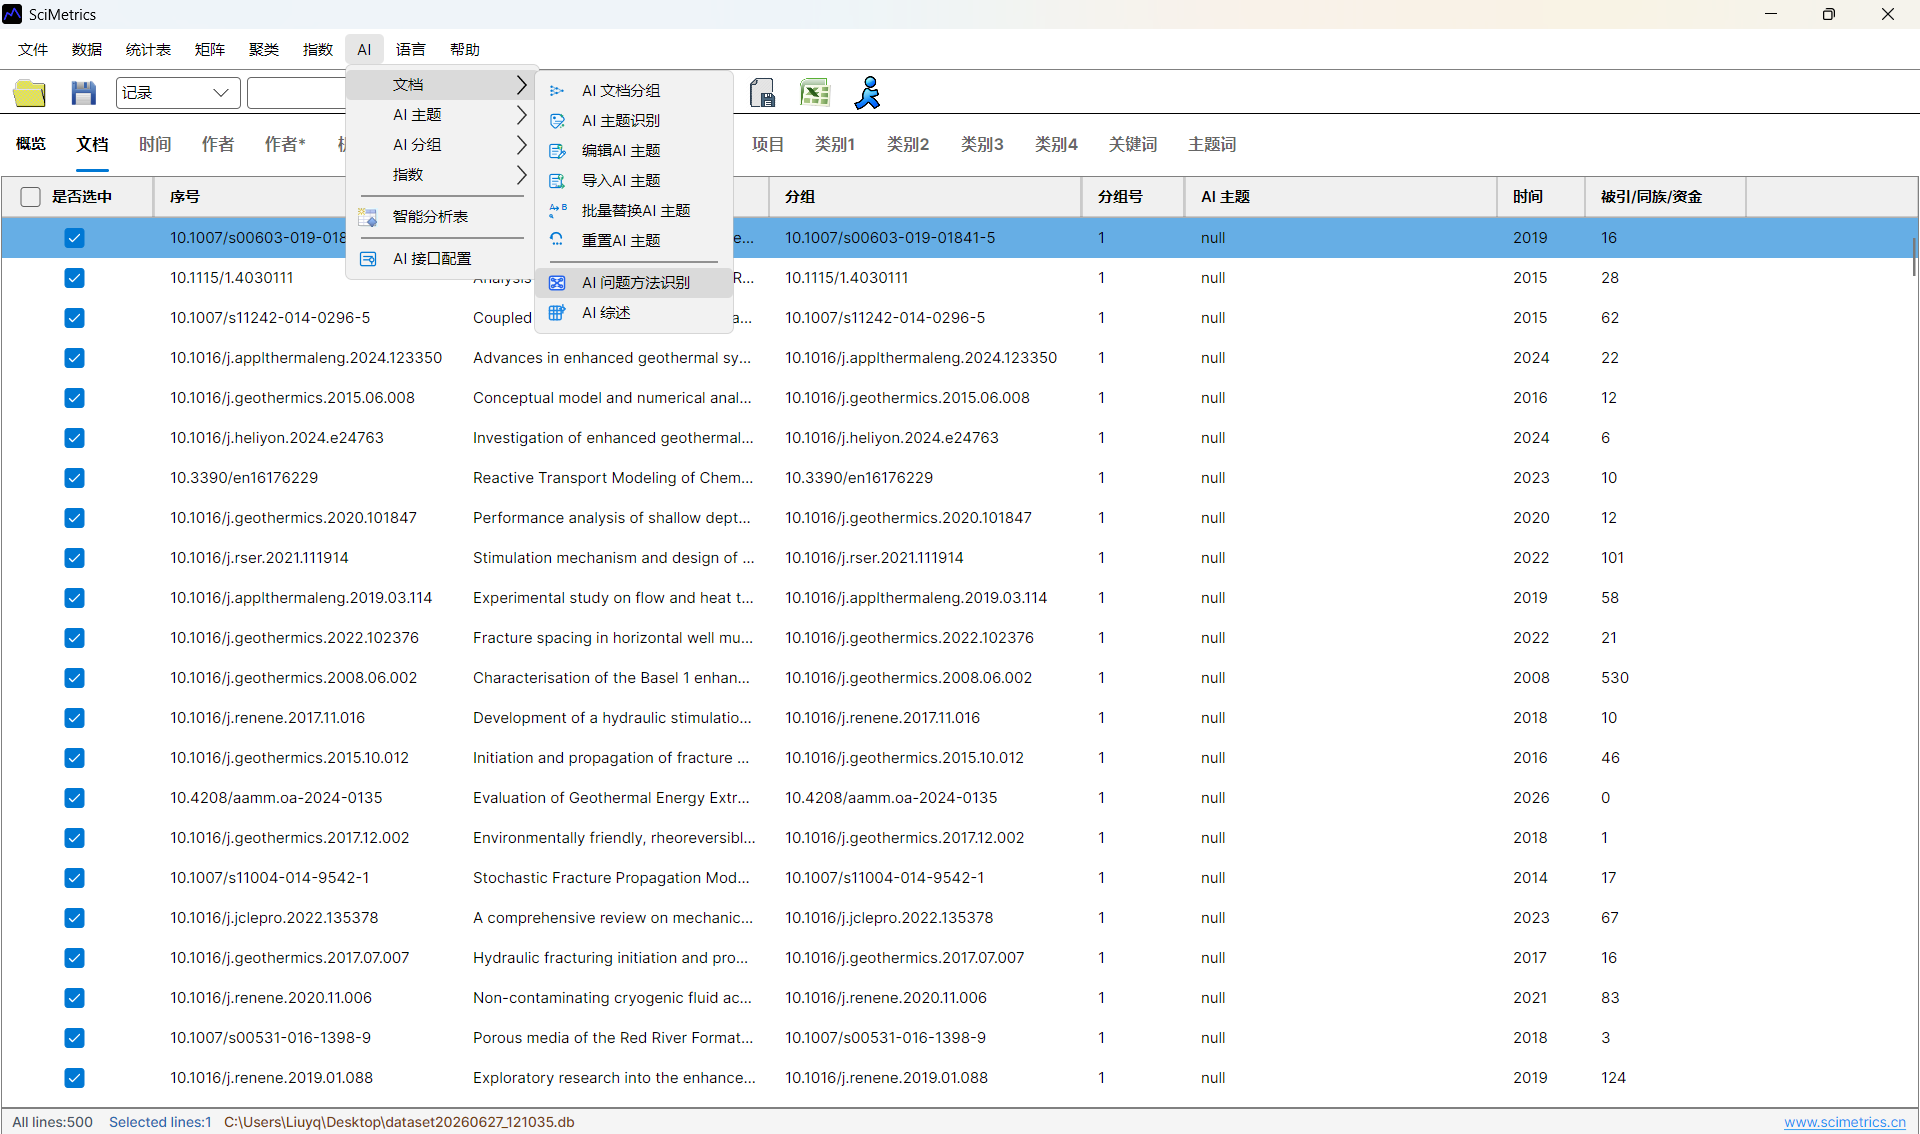
AI -> AI Problem-Method Recognition- Right-click selected papers in the document table and open the PMRC function.
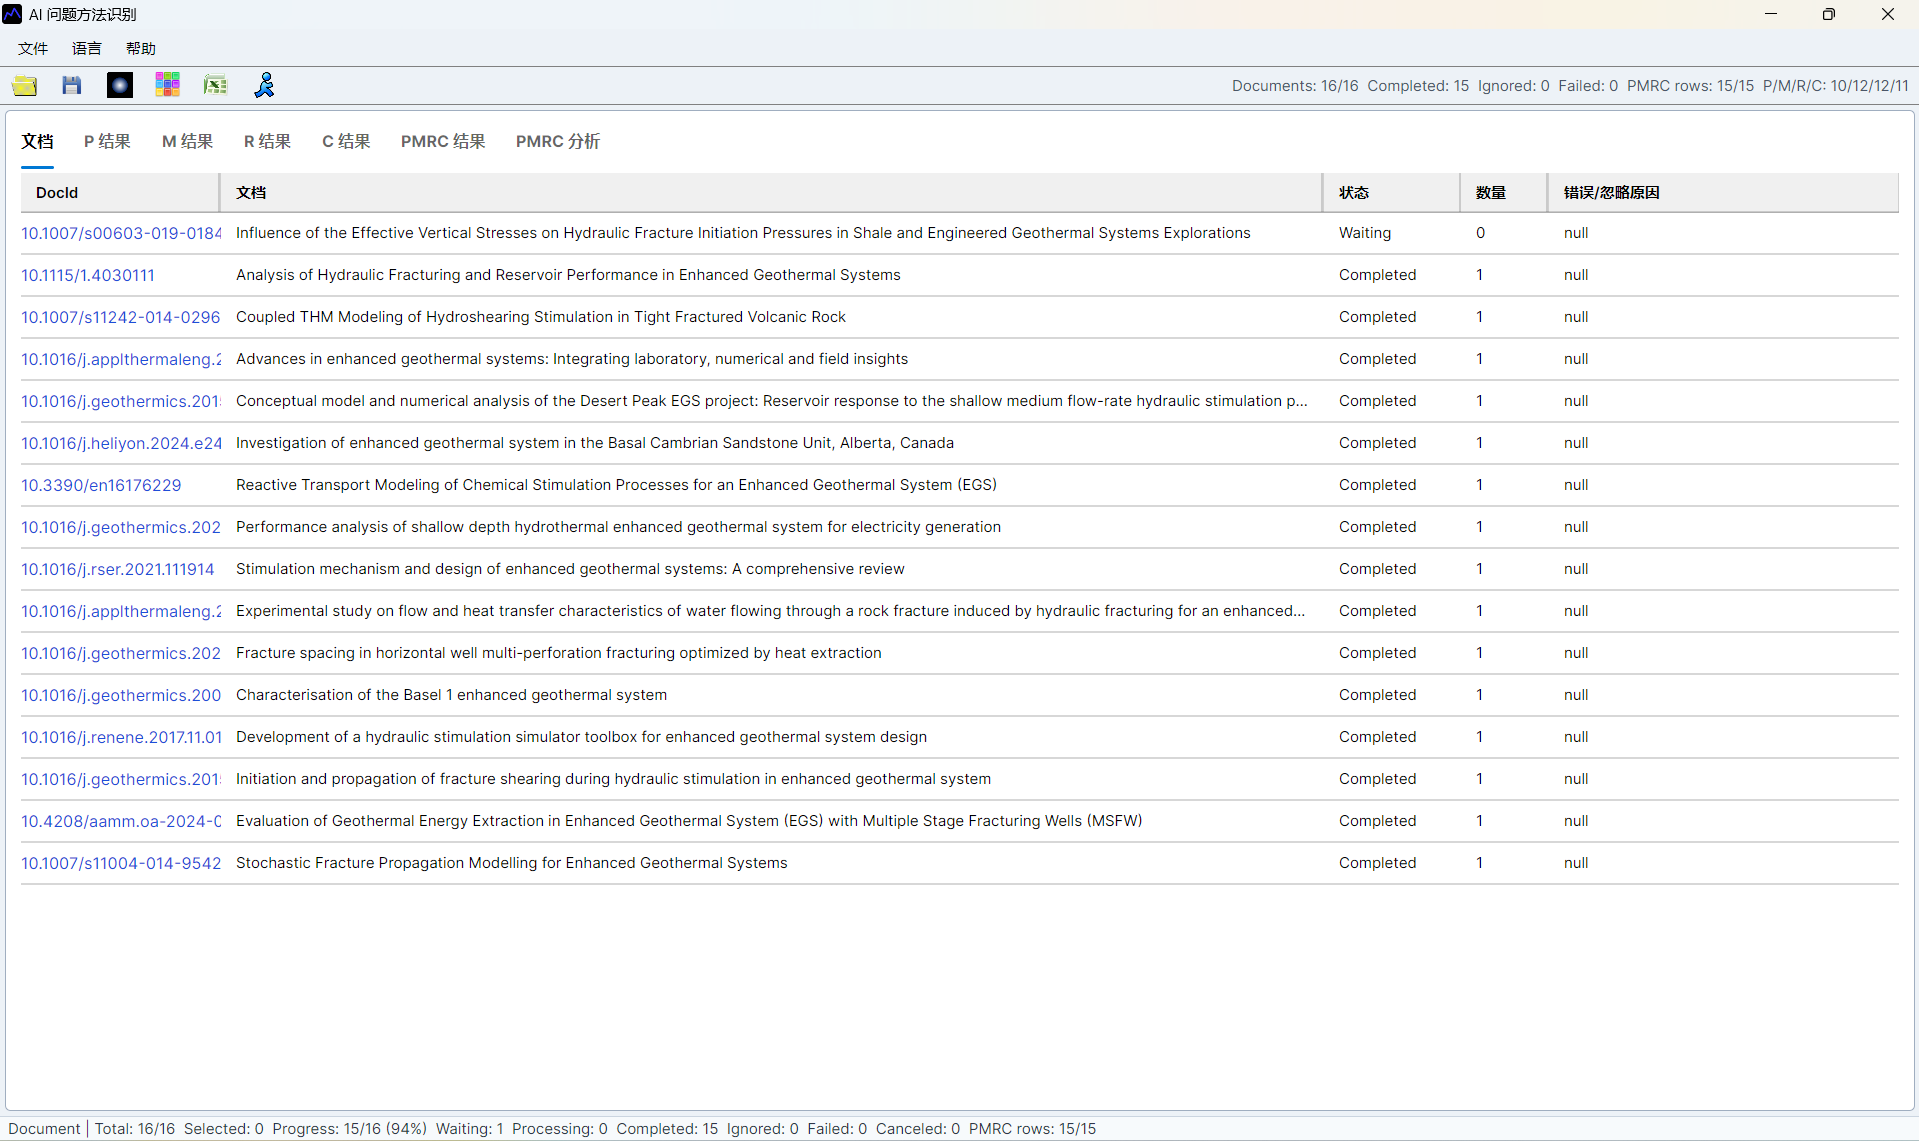
The window includes document status, P results, M results, R results, C results, PMRC results, and PMRC analysis tabs.
Configure Recognition
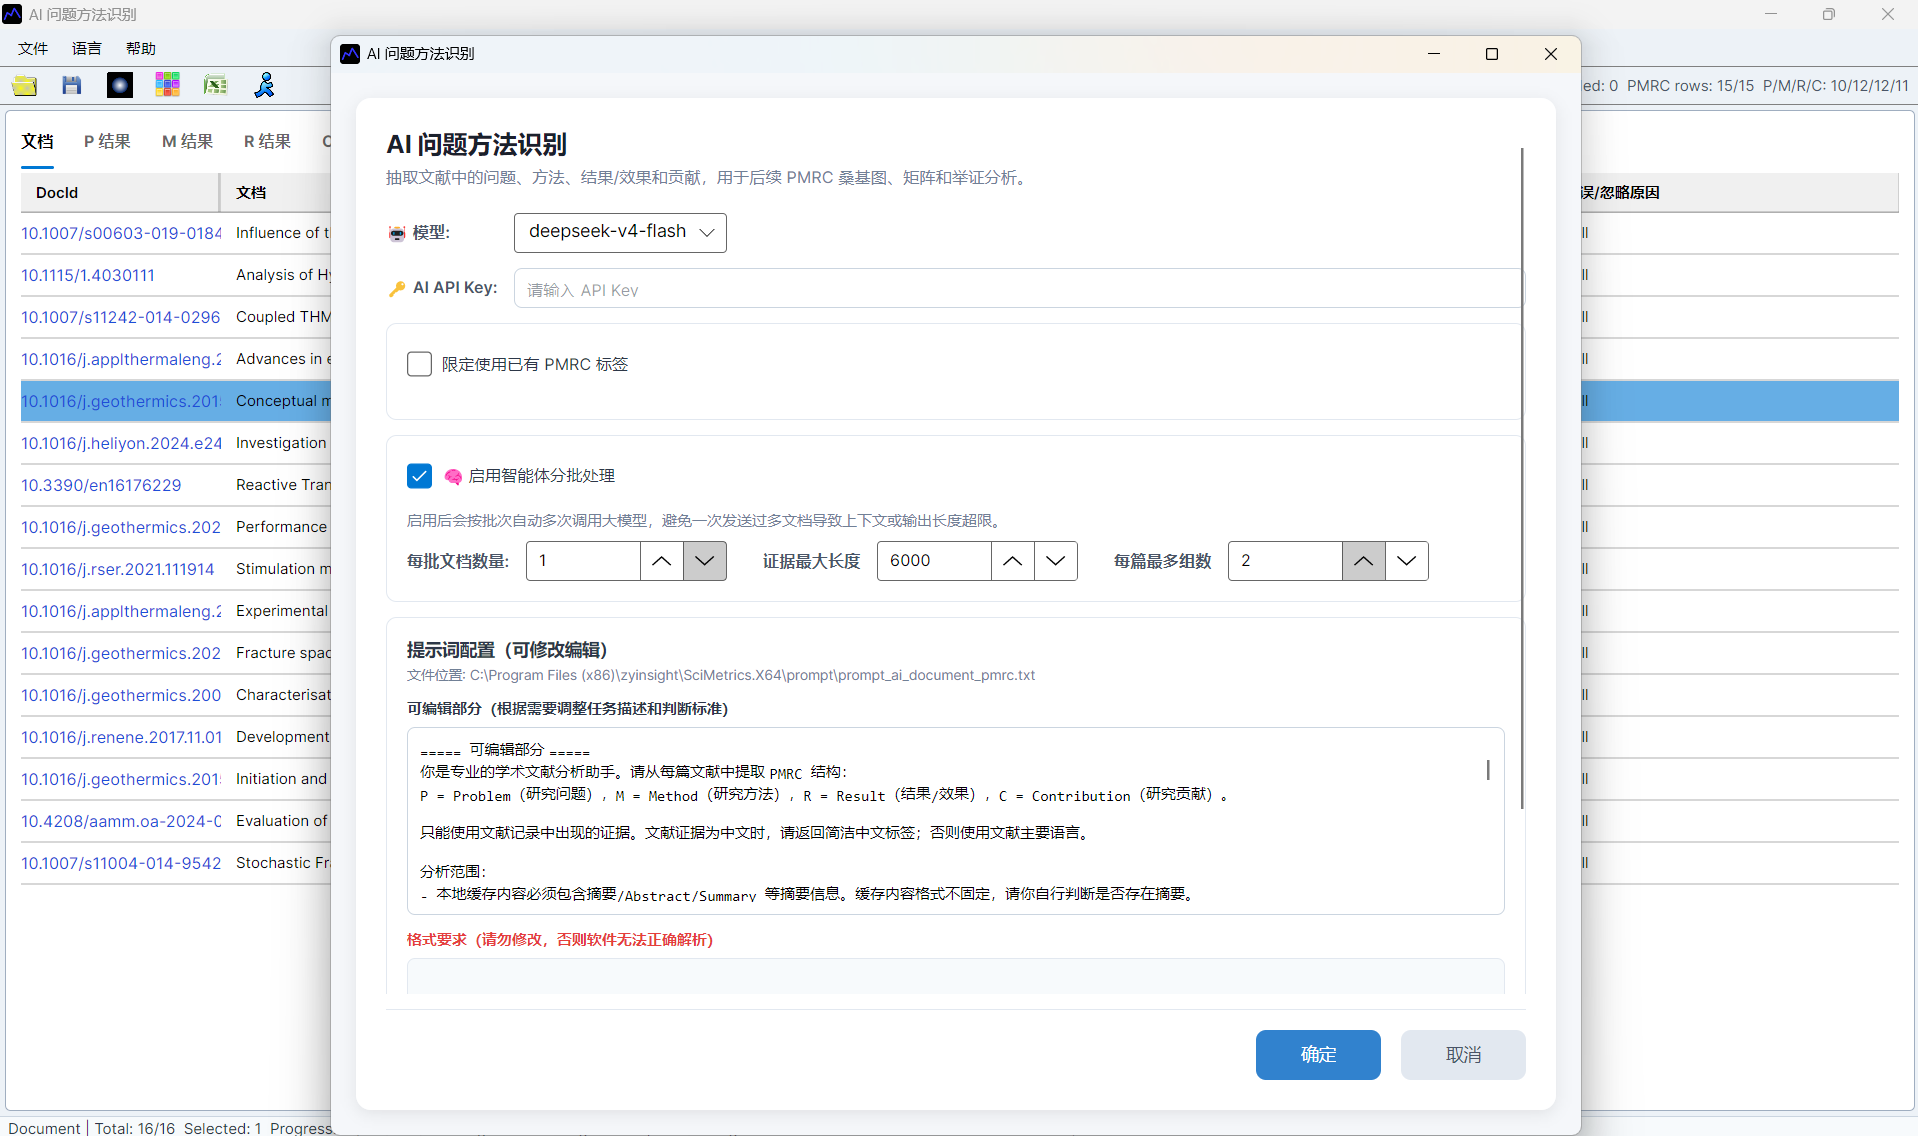
Right-click the document table and choose Start Recognition. Configure the model, API key, batching, evidence length, maximum PMRC groups per paper, and prompt language. Chinese environments use Chinese prompts; other environments use English prompts.
For stable output, require specific problems and explicit methods. Avoid broad labels such as generic experiment, empirical analysis, or method study unless the abstract contains concrete evidence.
Review And Re-run
Documents without abstracts, review articles, and papers without clear problem-method evidence may be ignored. Failed or low-quality records can be re-run after adjusting prompts, batch size, or evidence length.
Use PMRC outputs with topic and competitiveness views when you need to explain not only which direction is active, but also what technical problems and methods drive that direction.
Interface Screenshots
The screenshots below are retained to verify menu entries, parameter settings, result views, and export locations.
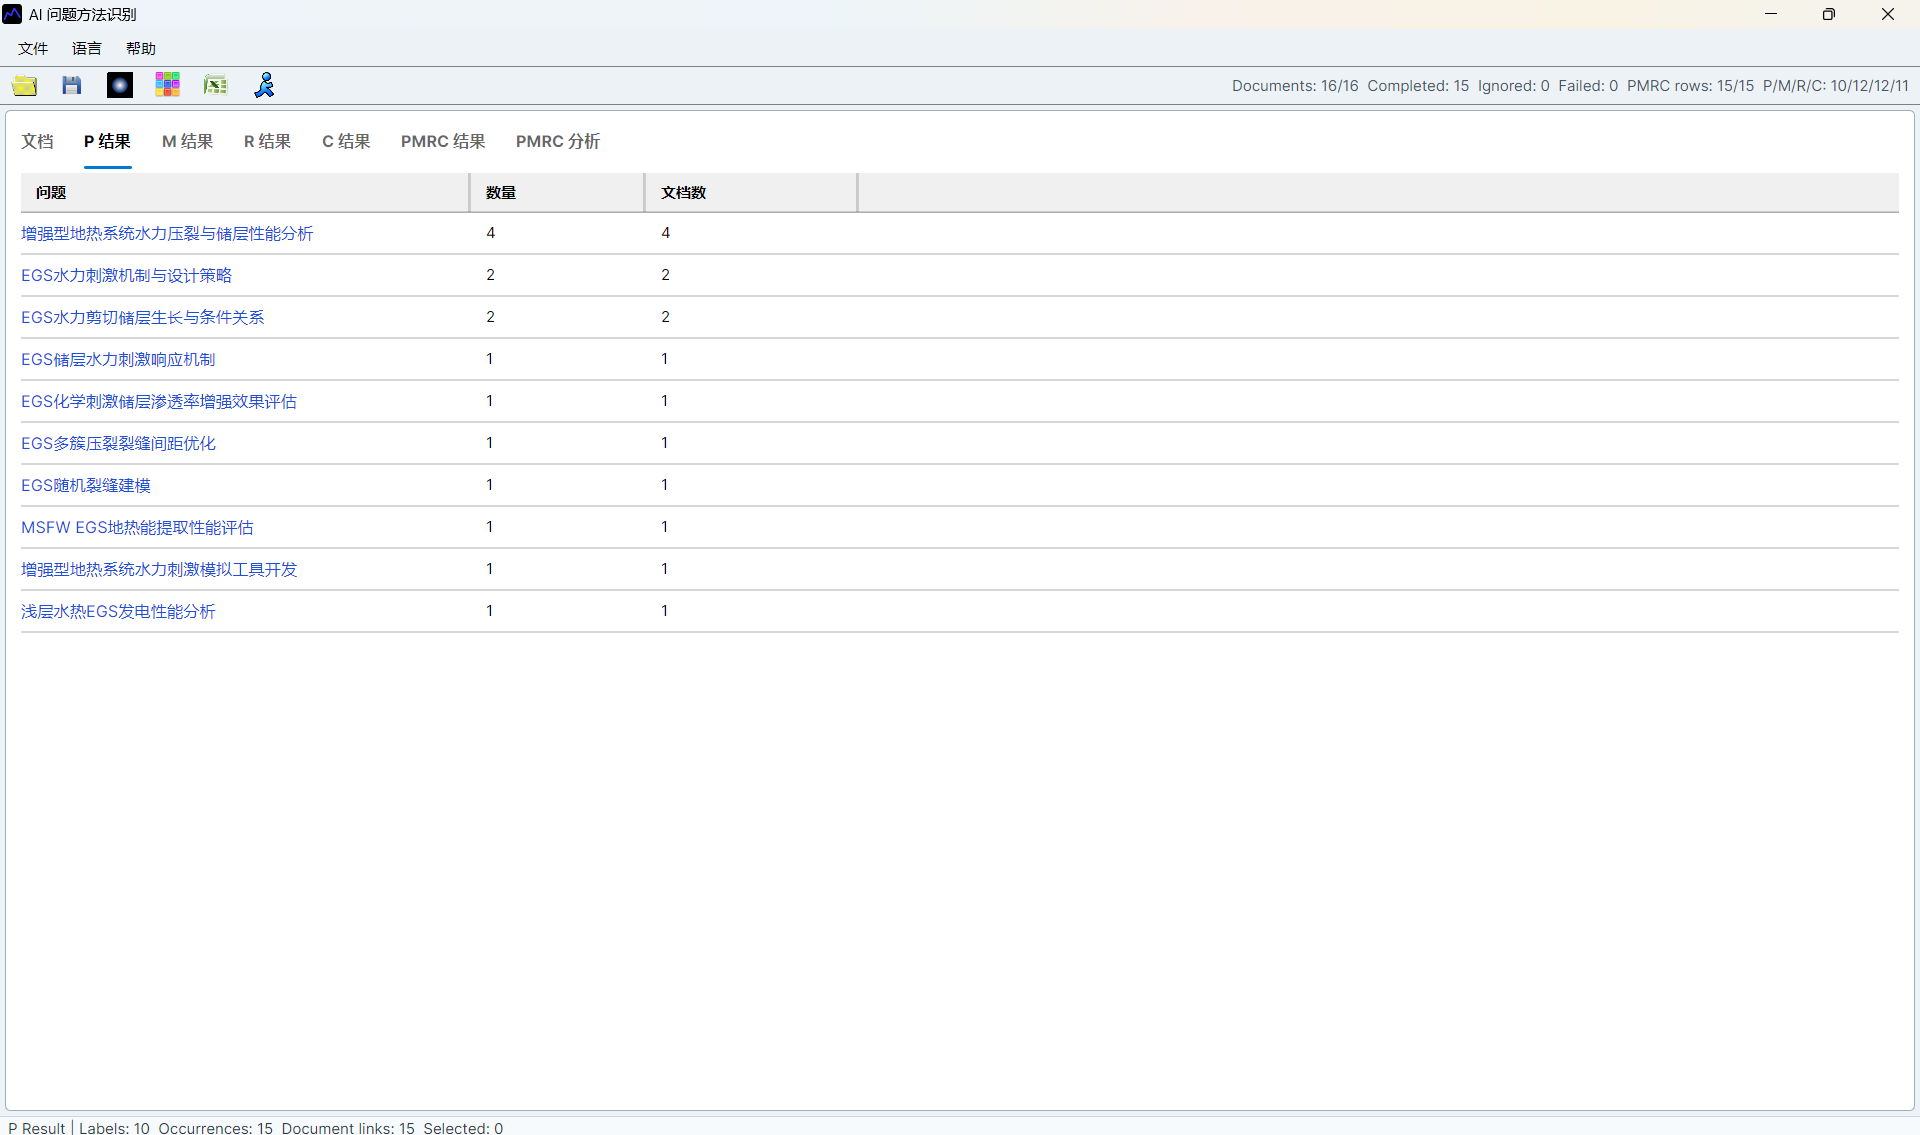
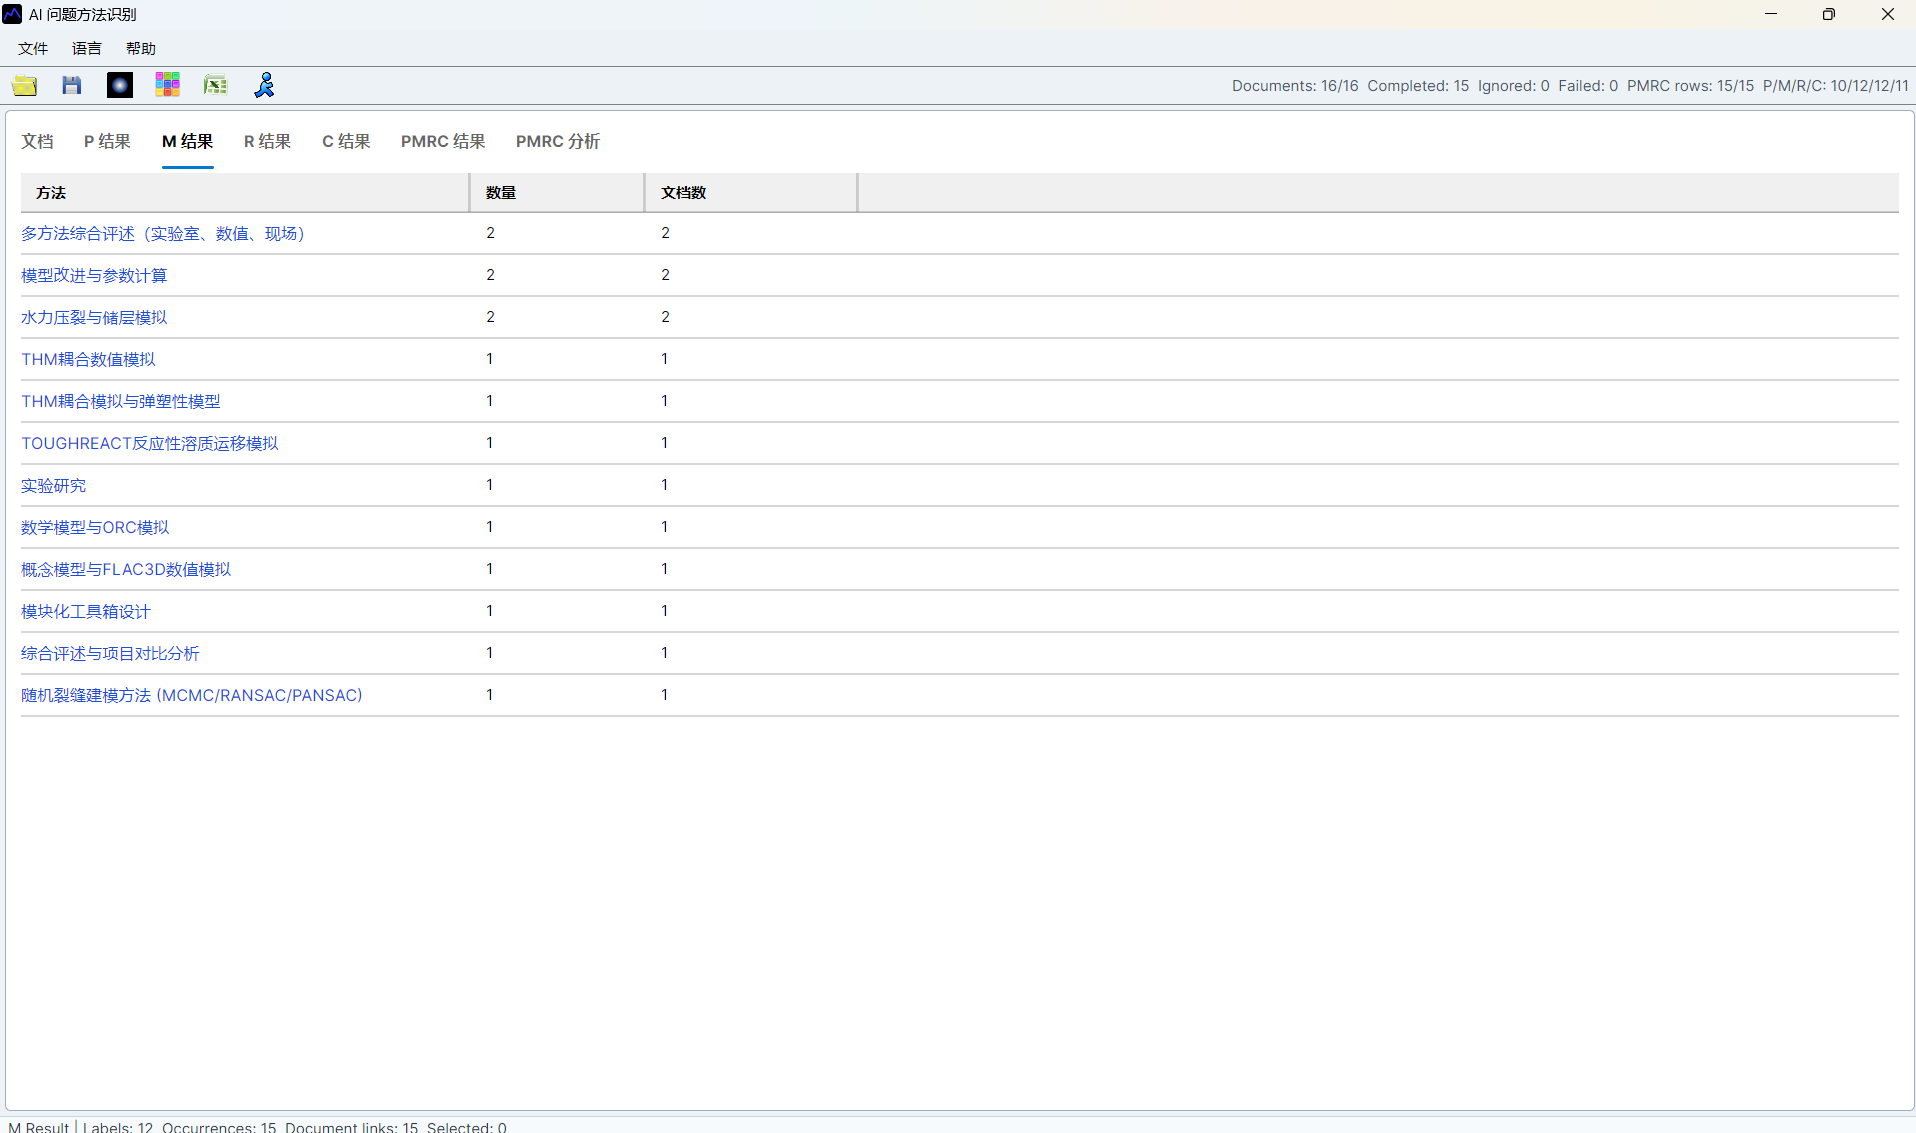
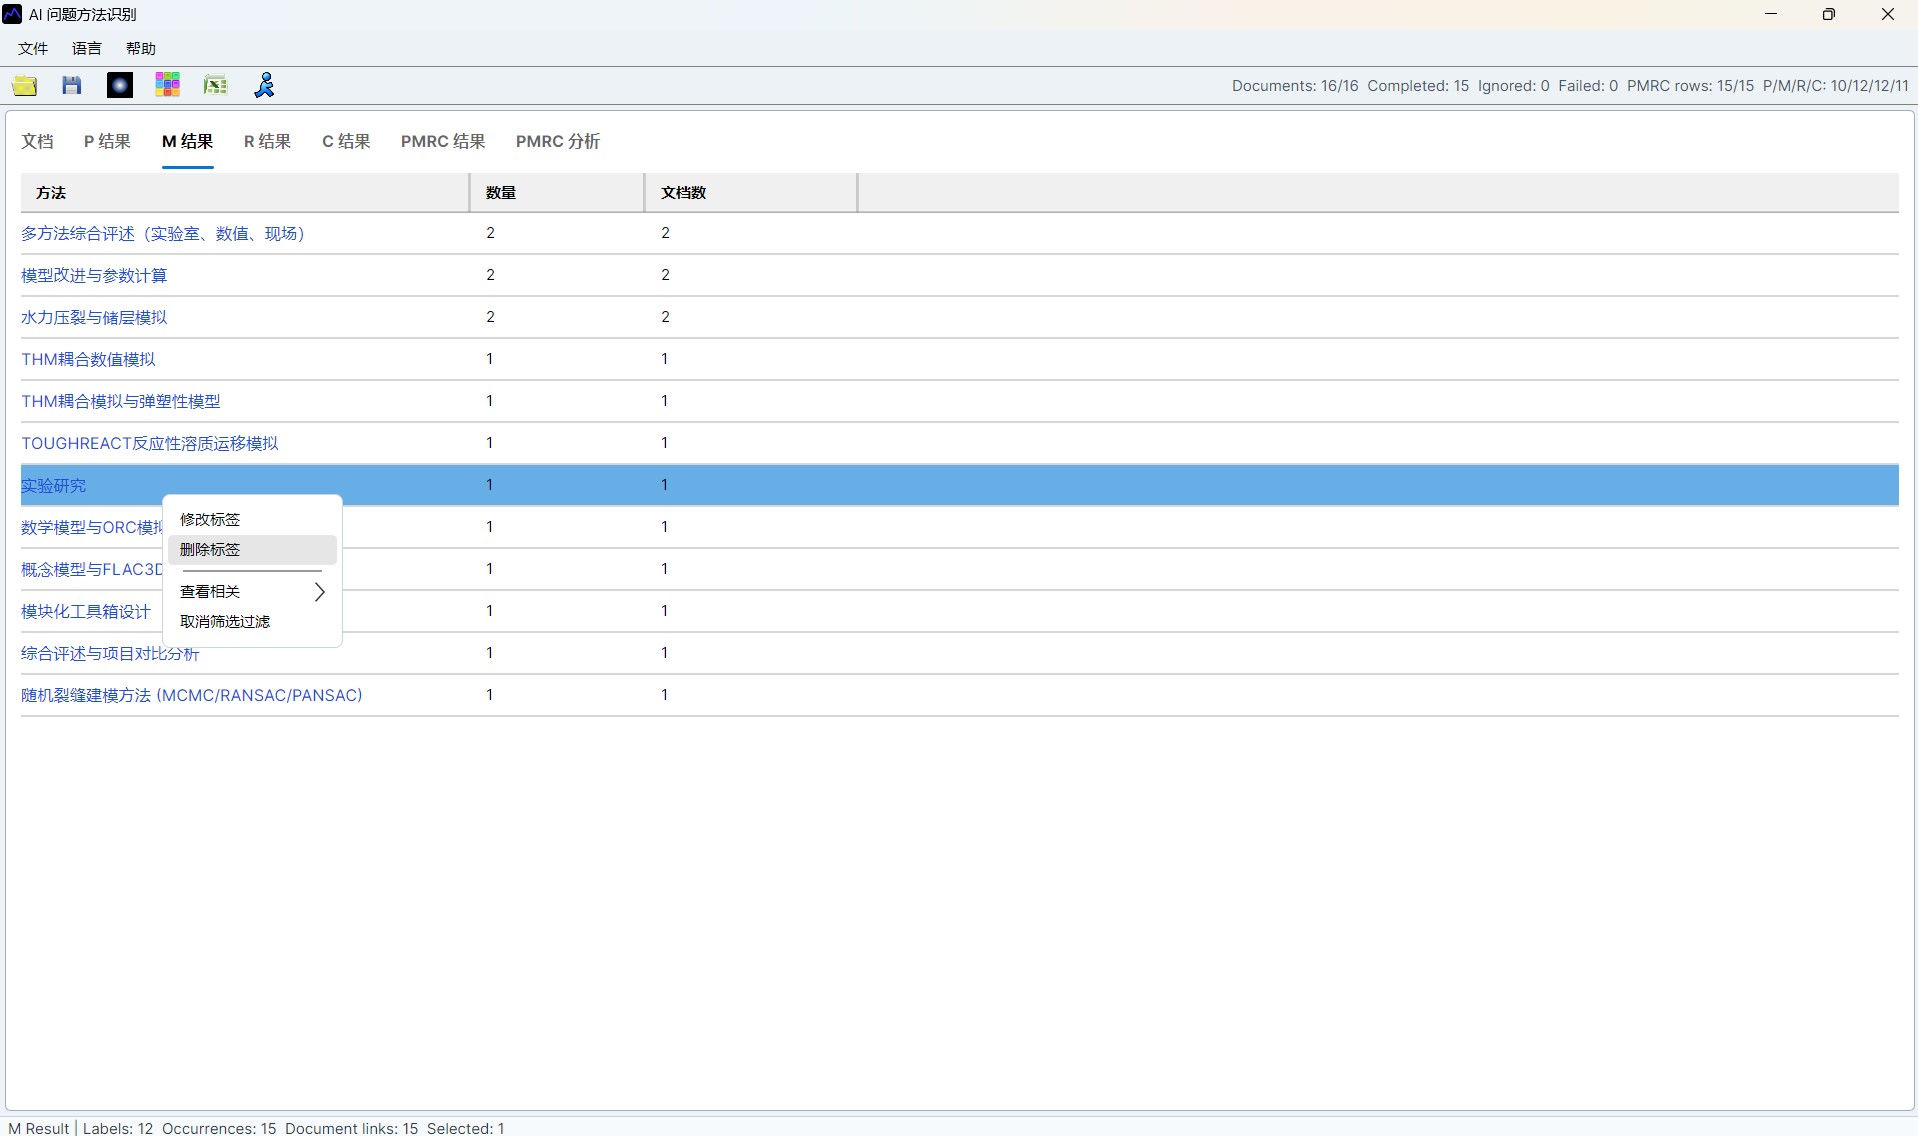
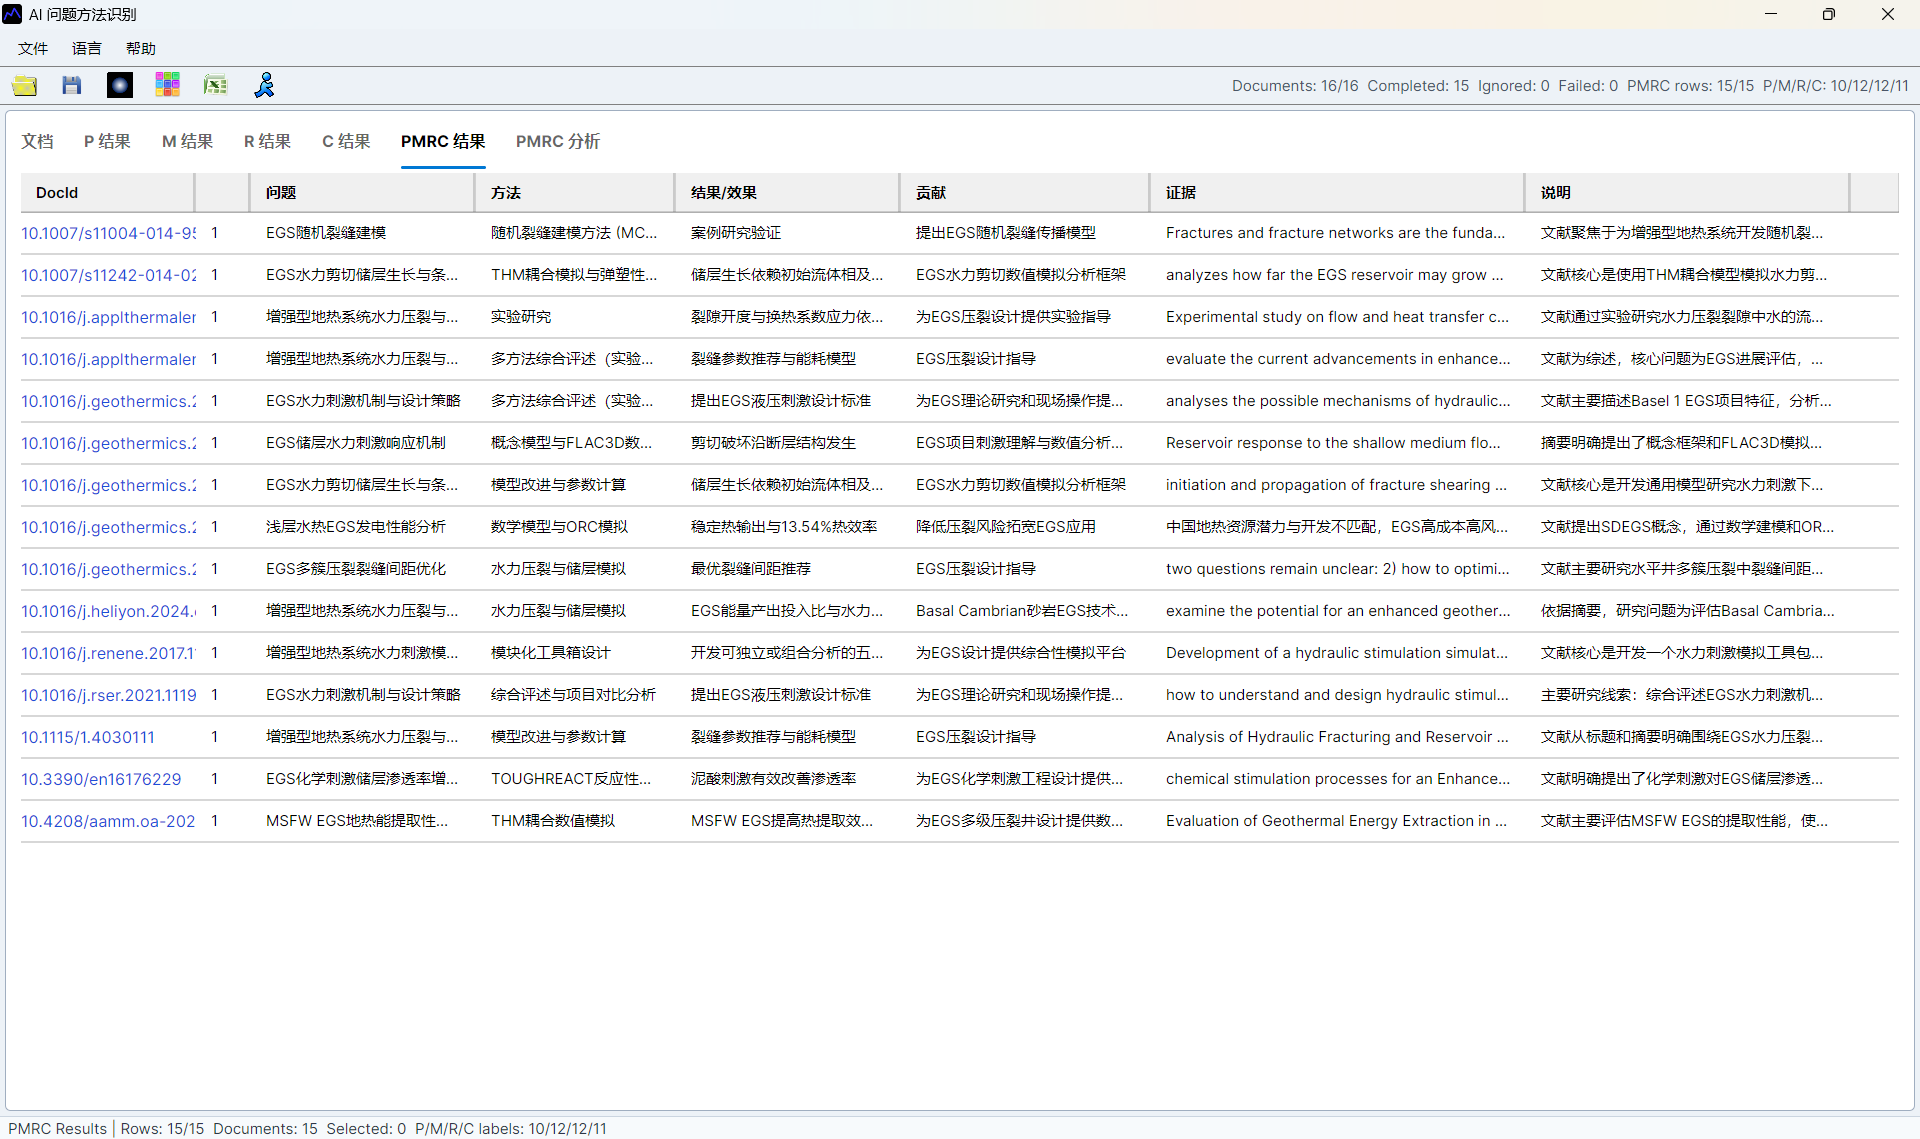
Simulated ESI Index
Find authors, institutions, and subject directions close to a local simulated Top 1% threshold.
Simulated ESI Index And Heatmap
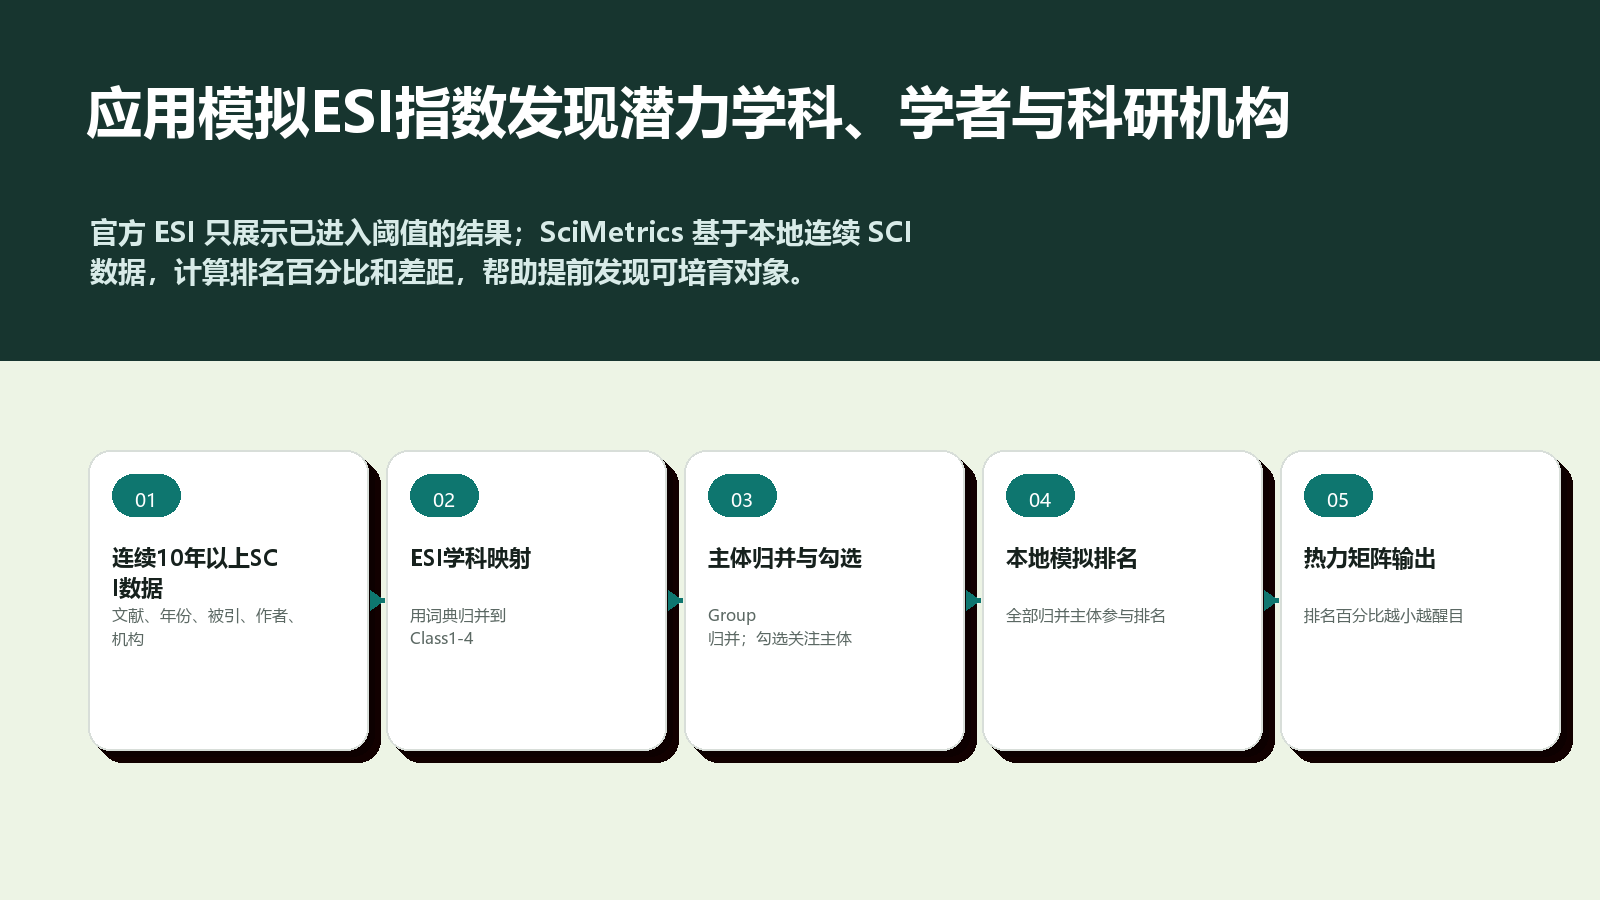
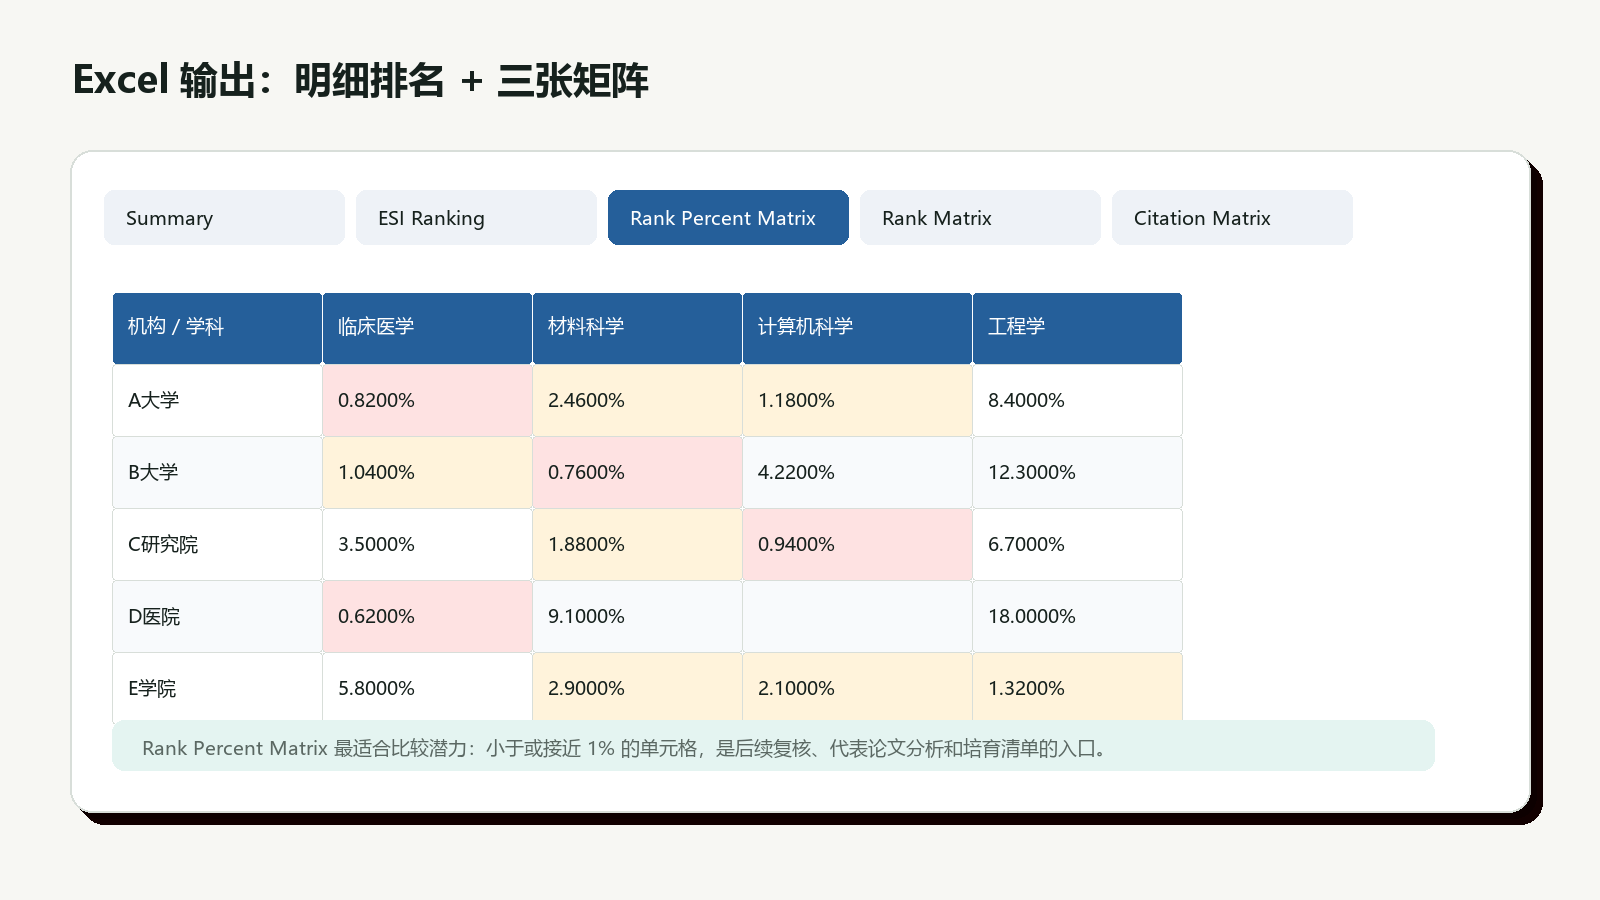
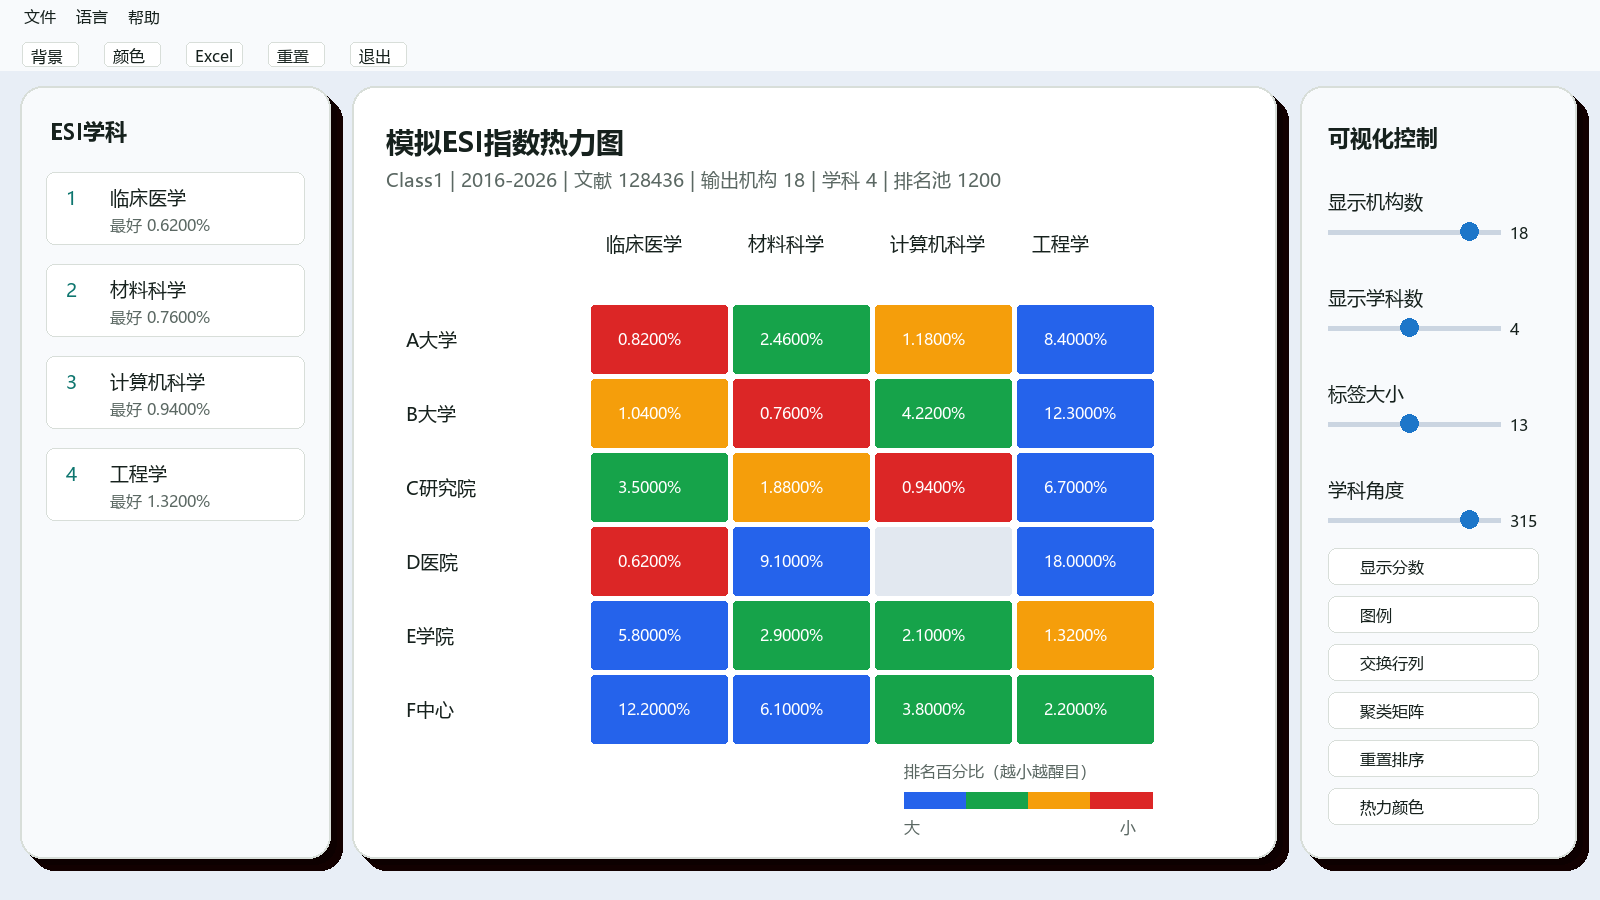
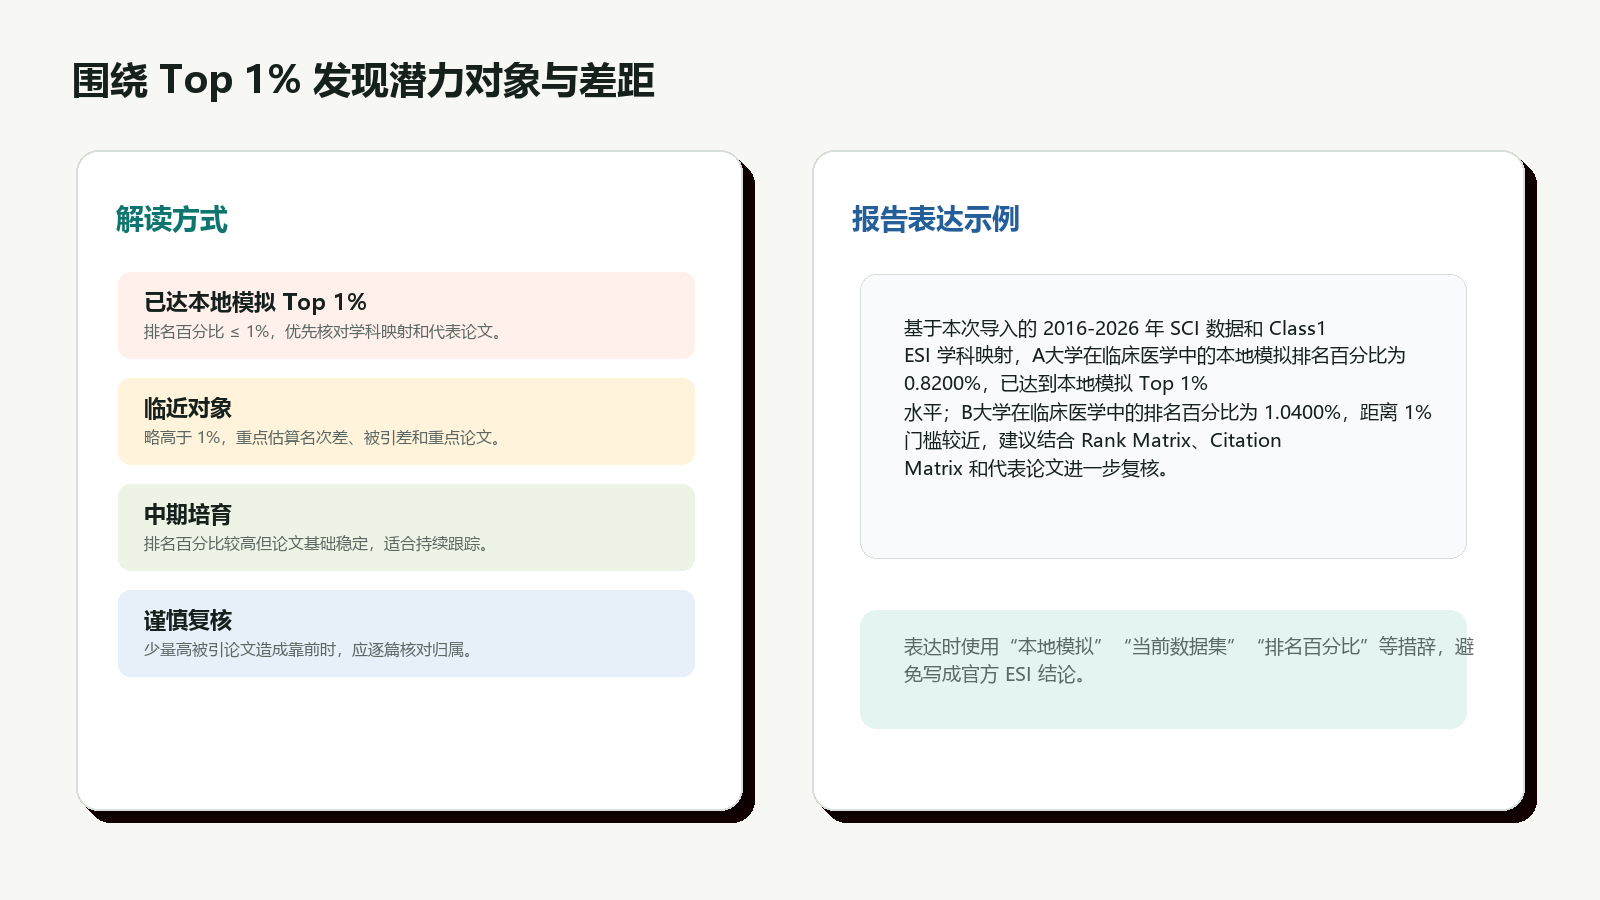
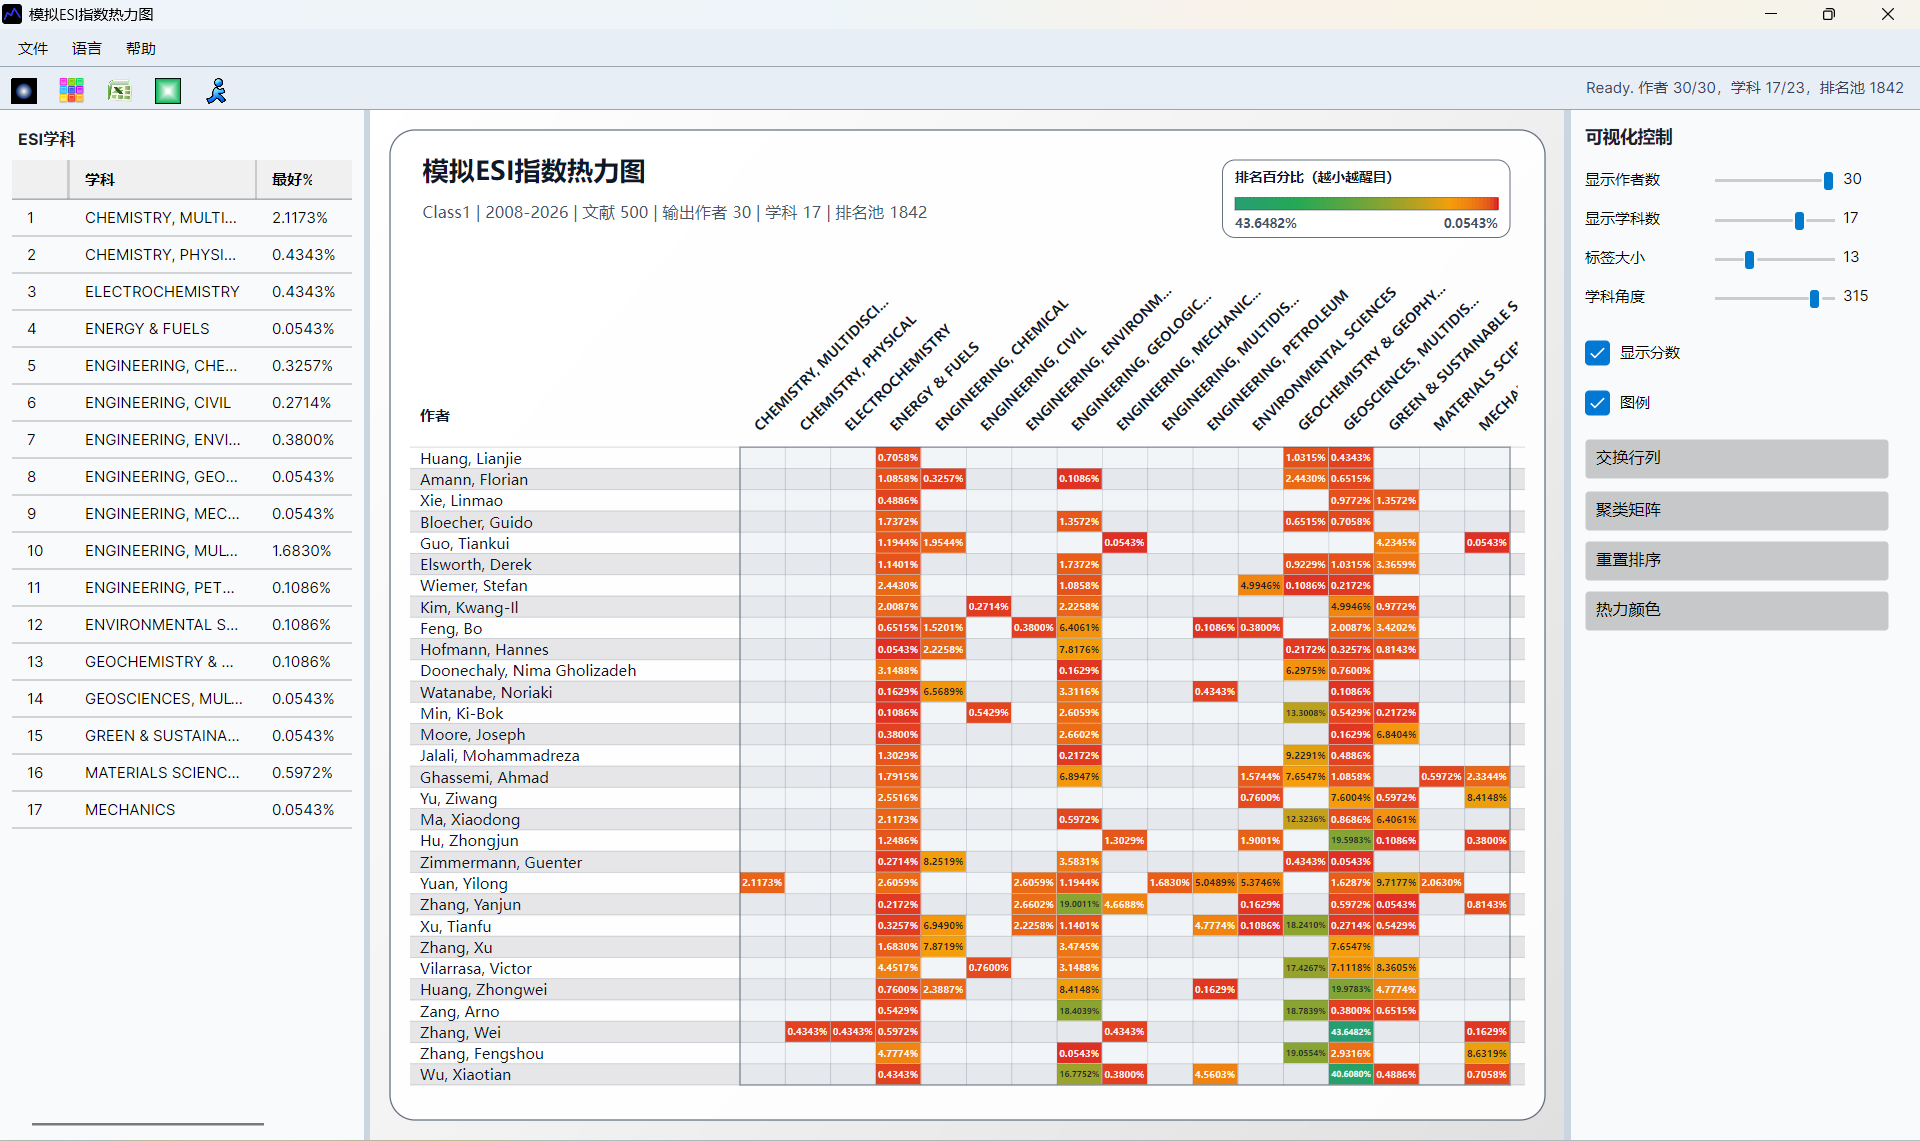
The simulated ESI index helps users discover authors, institutions, and subject directions that are close to a Top 1% threshold within the current local dataset. It is a local analytical model and is not the official Clarivate ESI ranking.
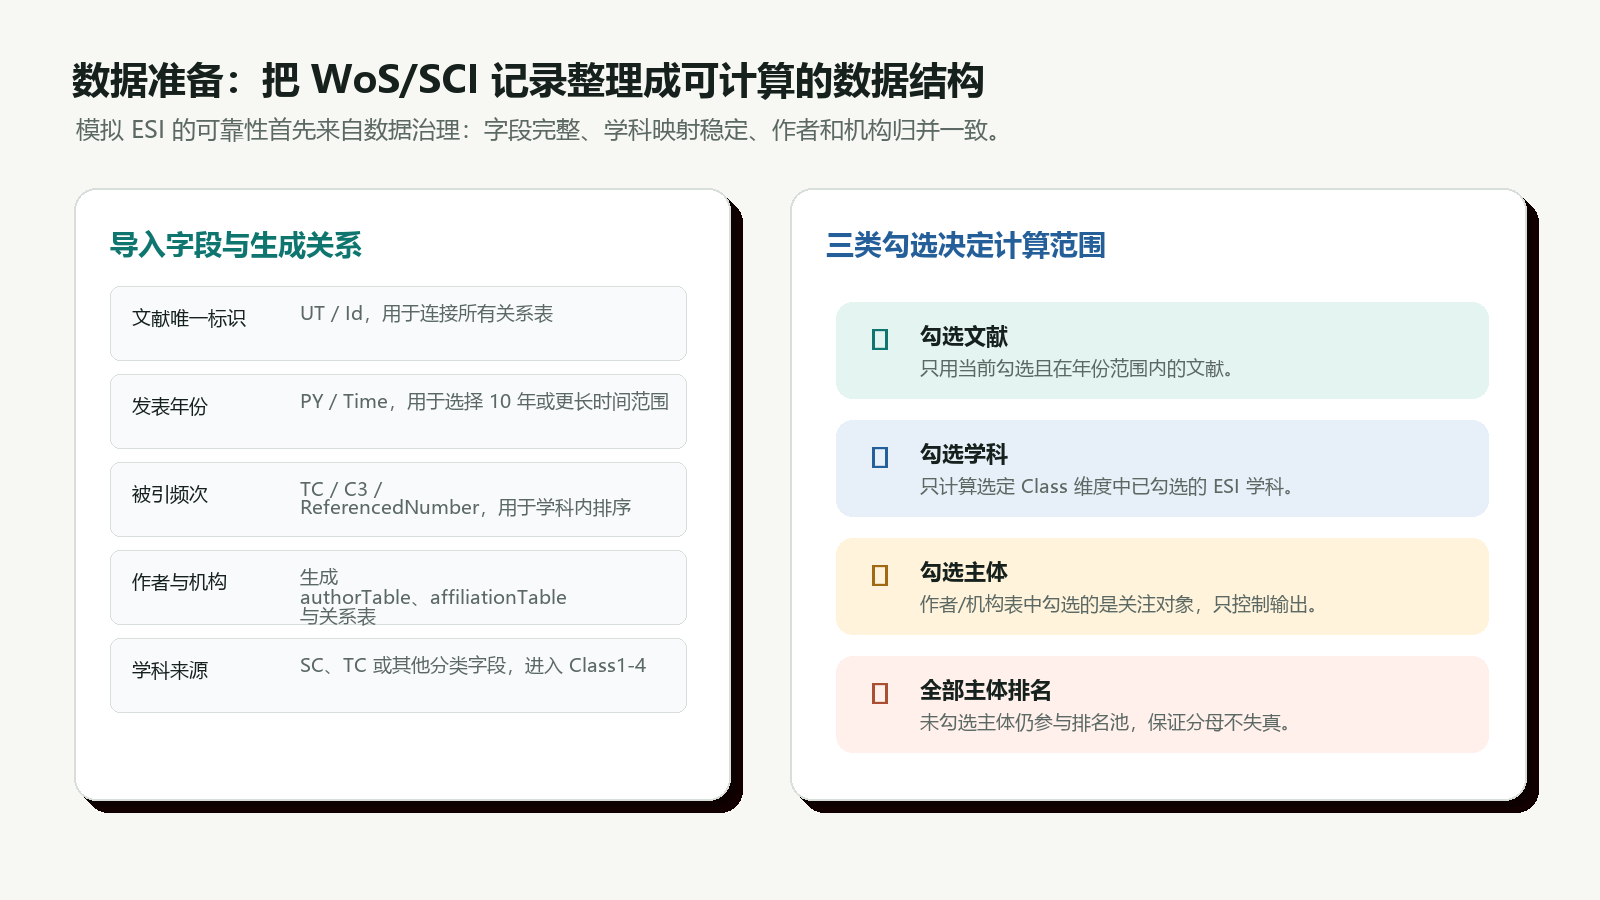
Data Requirements
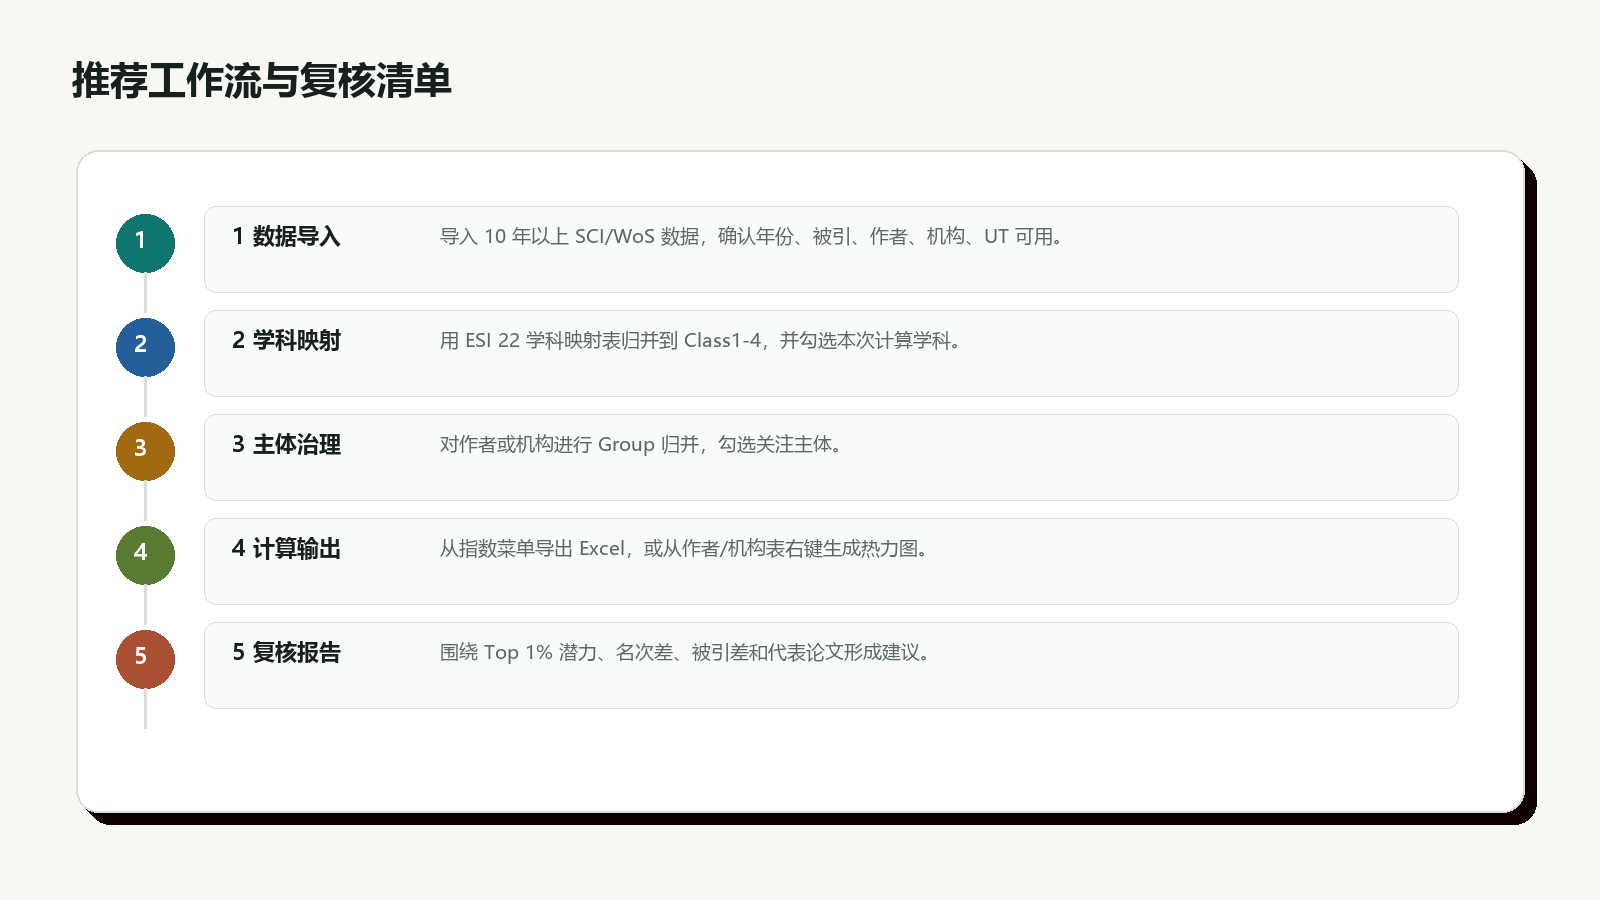
- Continuous WoS or SCI records, preferably covering around ten years or more.
- Publication year, citation count, document type, subject category, institution, and author fields.
- ESI subject mapping from WoS subject categories to ESI classes.
- Cleaned author and institution names.
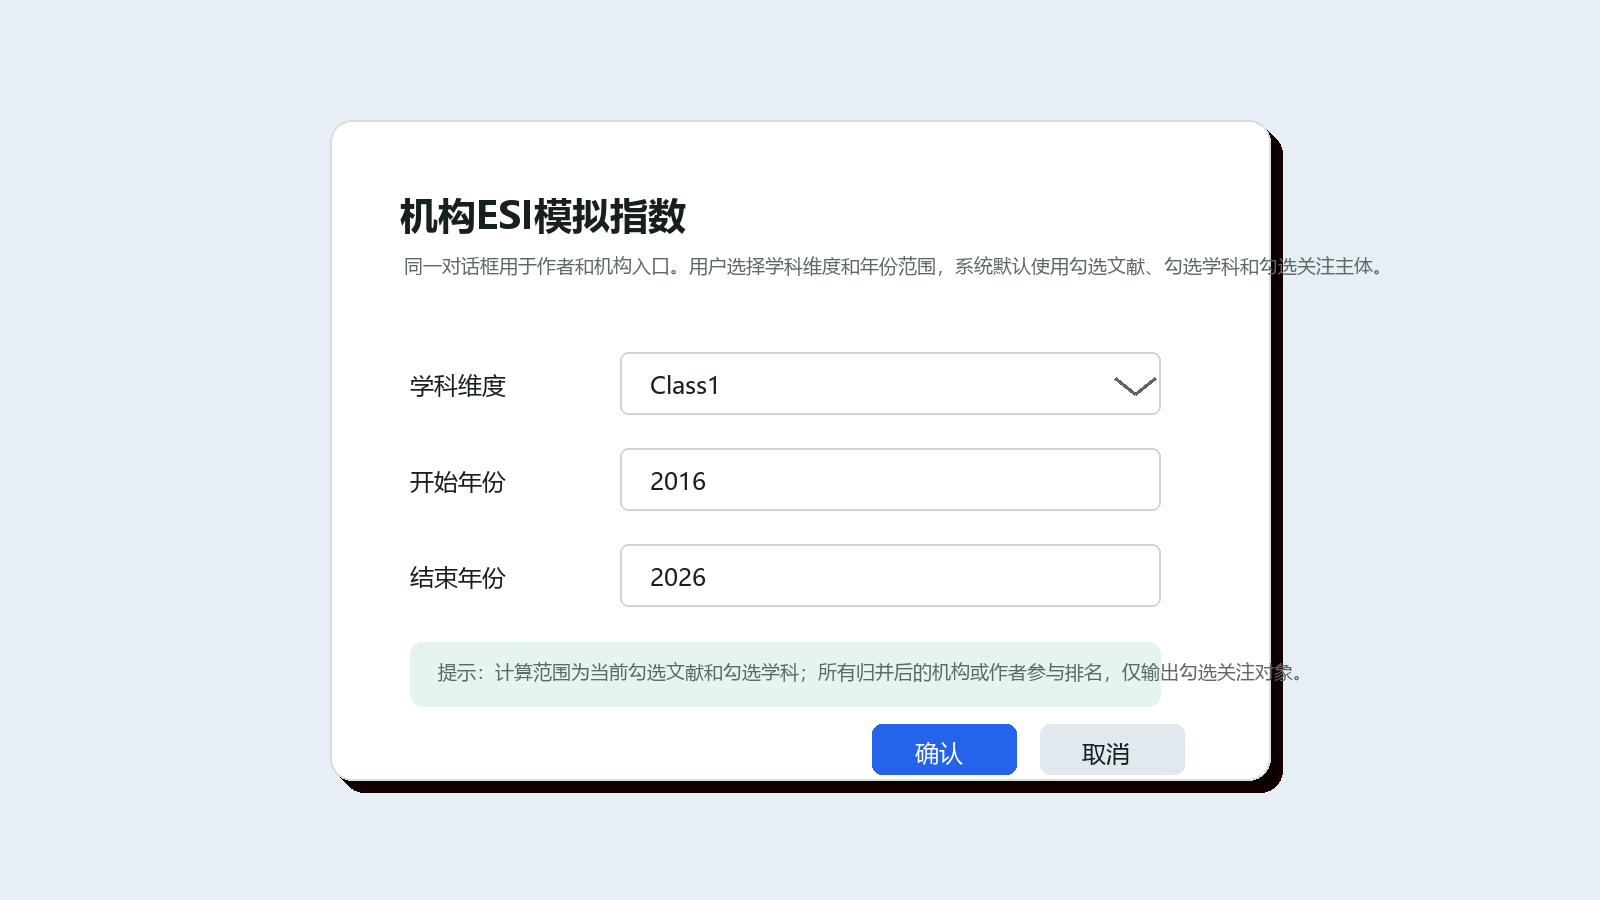
Calculation Scope
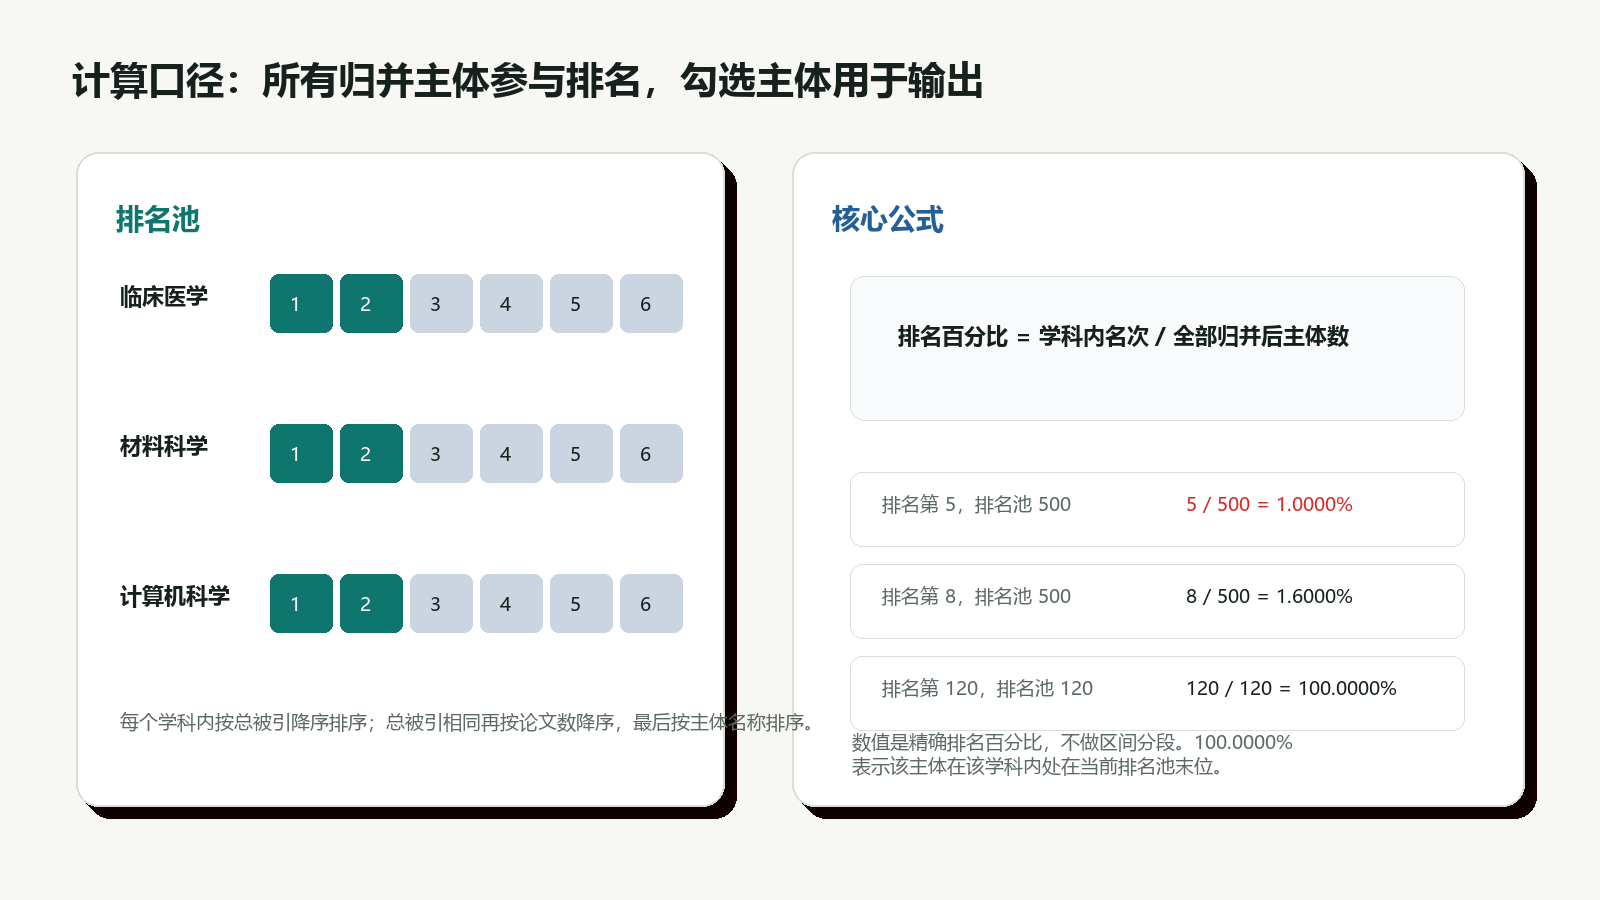
The model ranks authors or institutions within the current dataset, selected years, selected subject classes, and current merge rules. The ranking percentage indicates relative position in that local pool.
Use the result to find:
- Subjects close to a simulated Top 1% threshold.
- Authors or institutions with near-threshold performance.
- Gaps between a candidate and the local boundary.
- High-cited papers that may explain the gap.
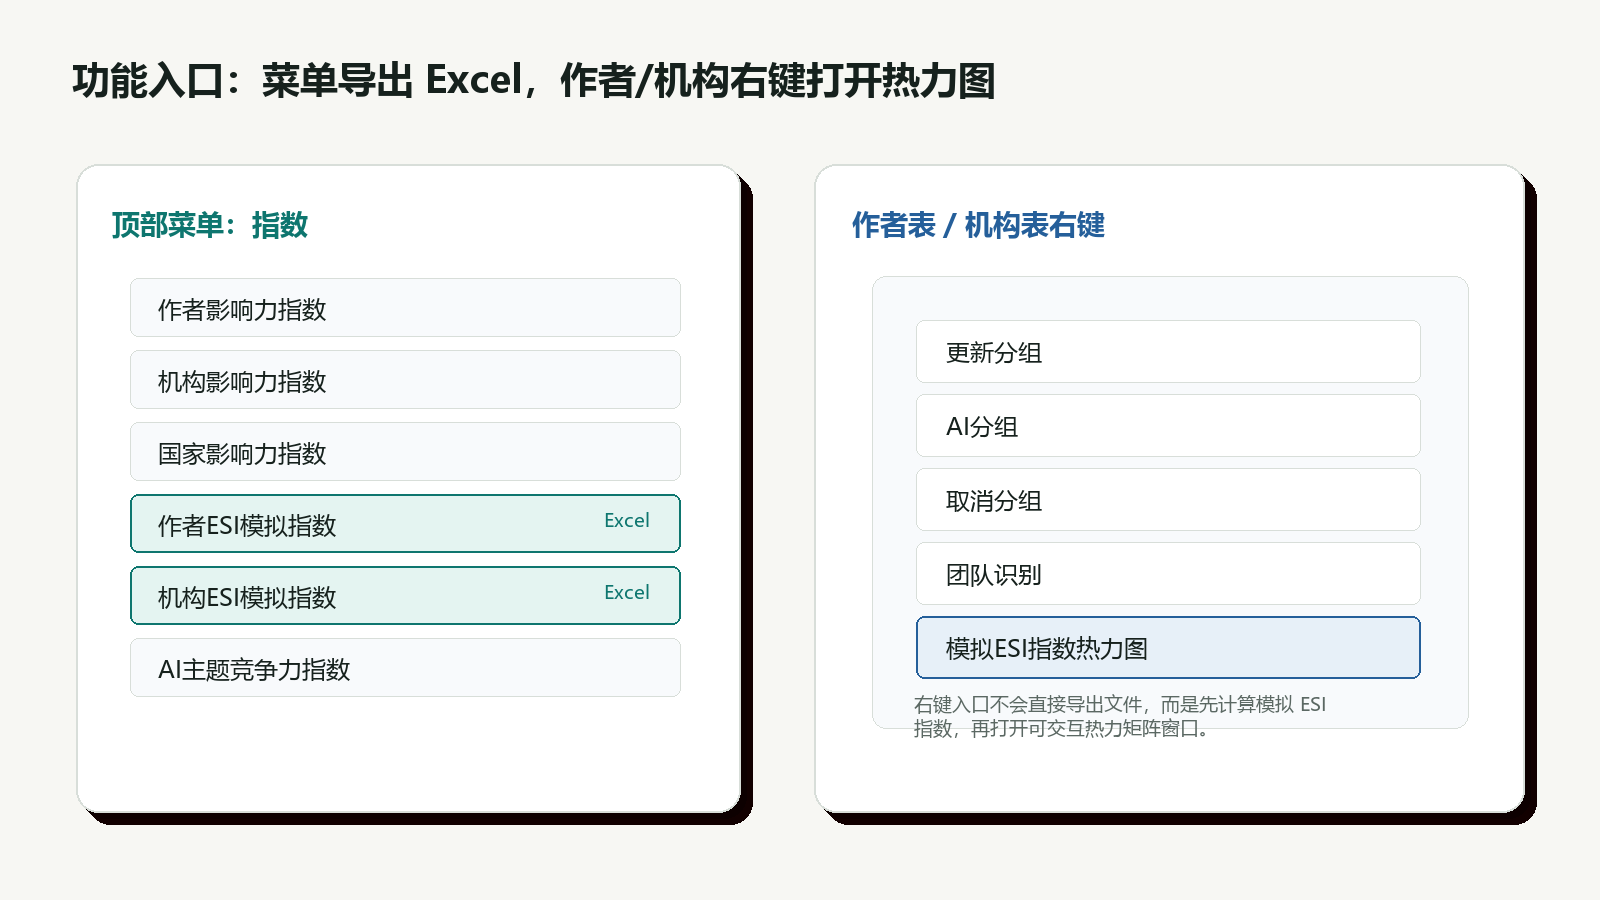
Entries And Outputs
| Entry | Object | Output |
|---|---|---|
Index -> Author Simulated ESI Index |
Authors | Excel indicator table |
Index -> Institution Simulated ESI Index |
Institutions | Excel indicator table |
| Author table right-click heatmap | Authors | Heatmap, Excel, SVG |
| Institution table right-click heatmap | Institutions | Heatmap, Excel, SVG |
Interpretation
A ranking percentage at or below 1% means the object is already very strong in the local pool. A value slightly above 1% can indicate a near-threshold object worth tracking. Always check the paper count, citation count, subject mapping, and merge quality before using the result in formal decisions.
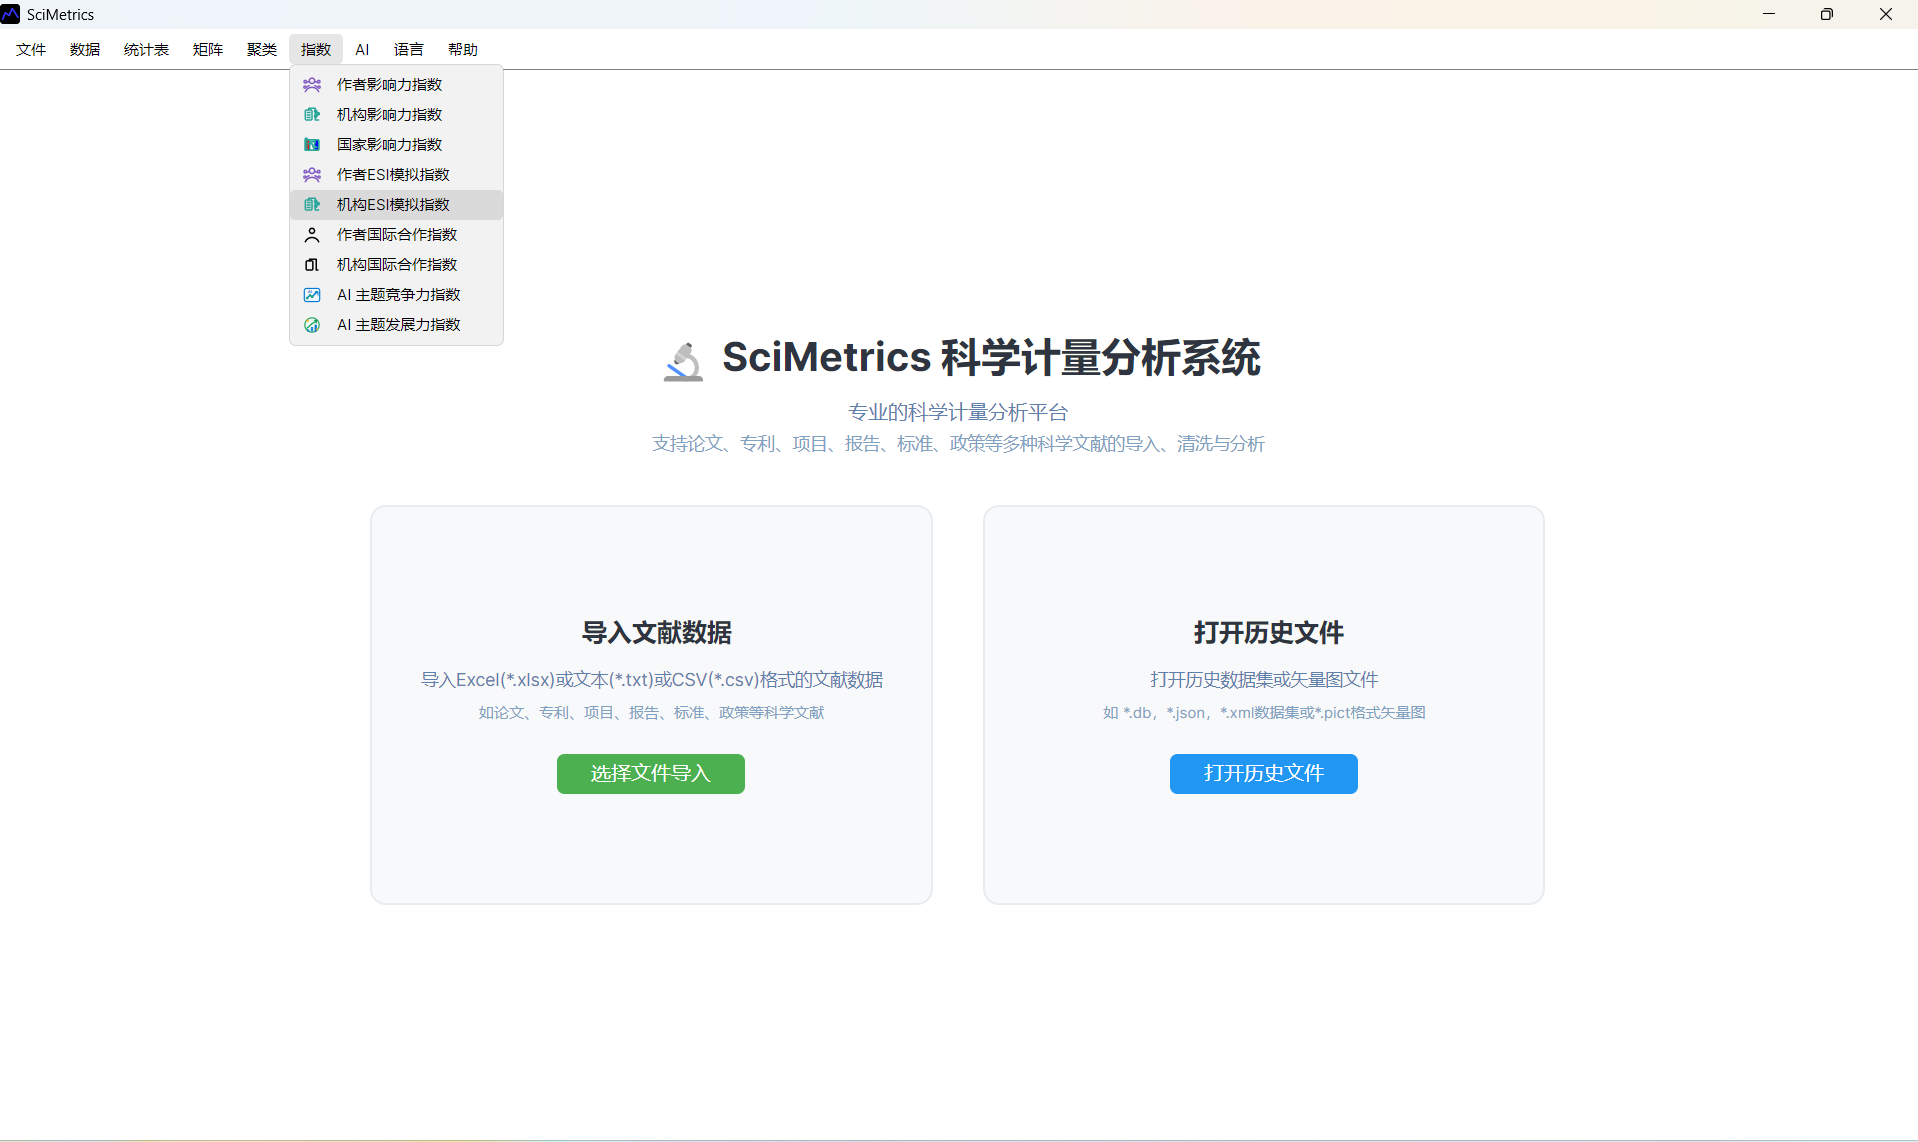
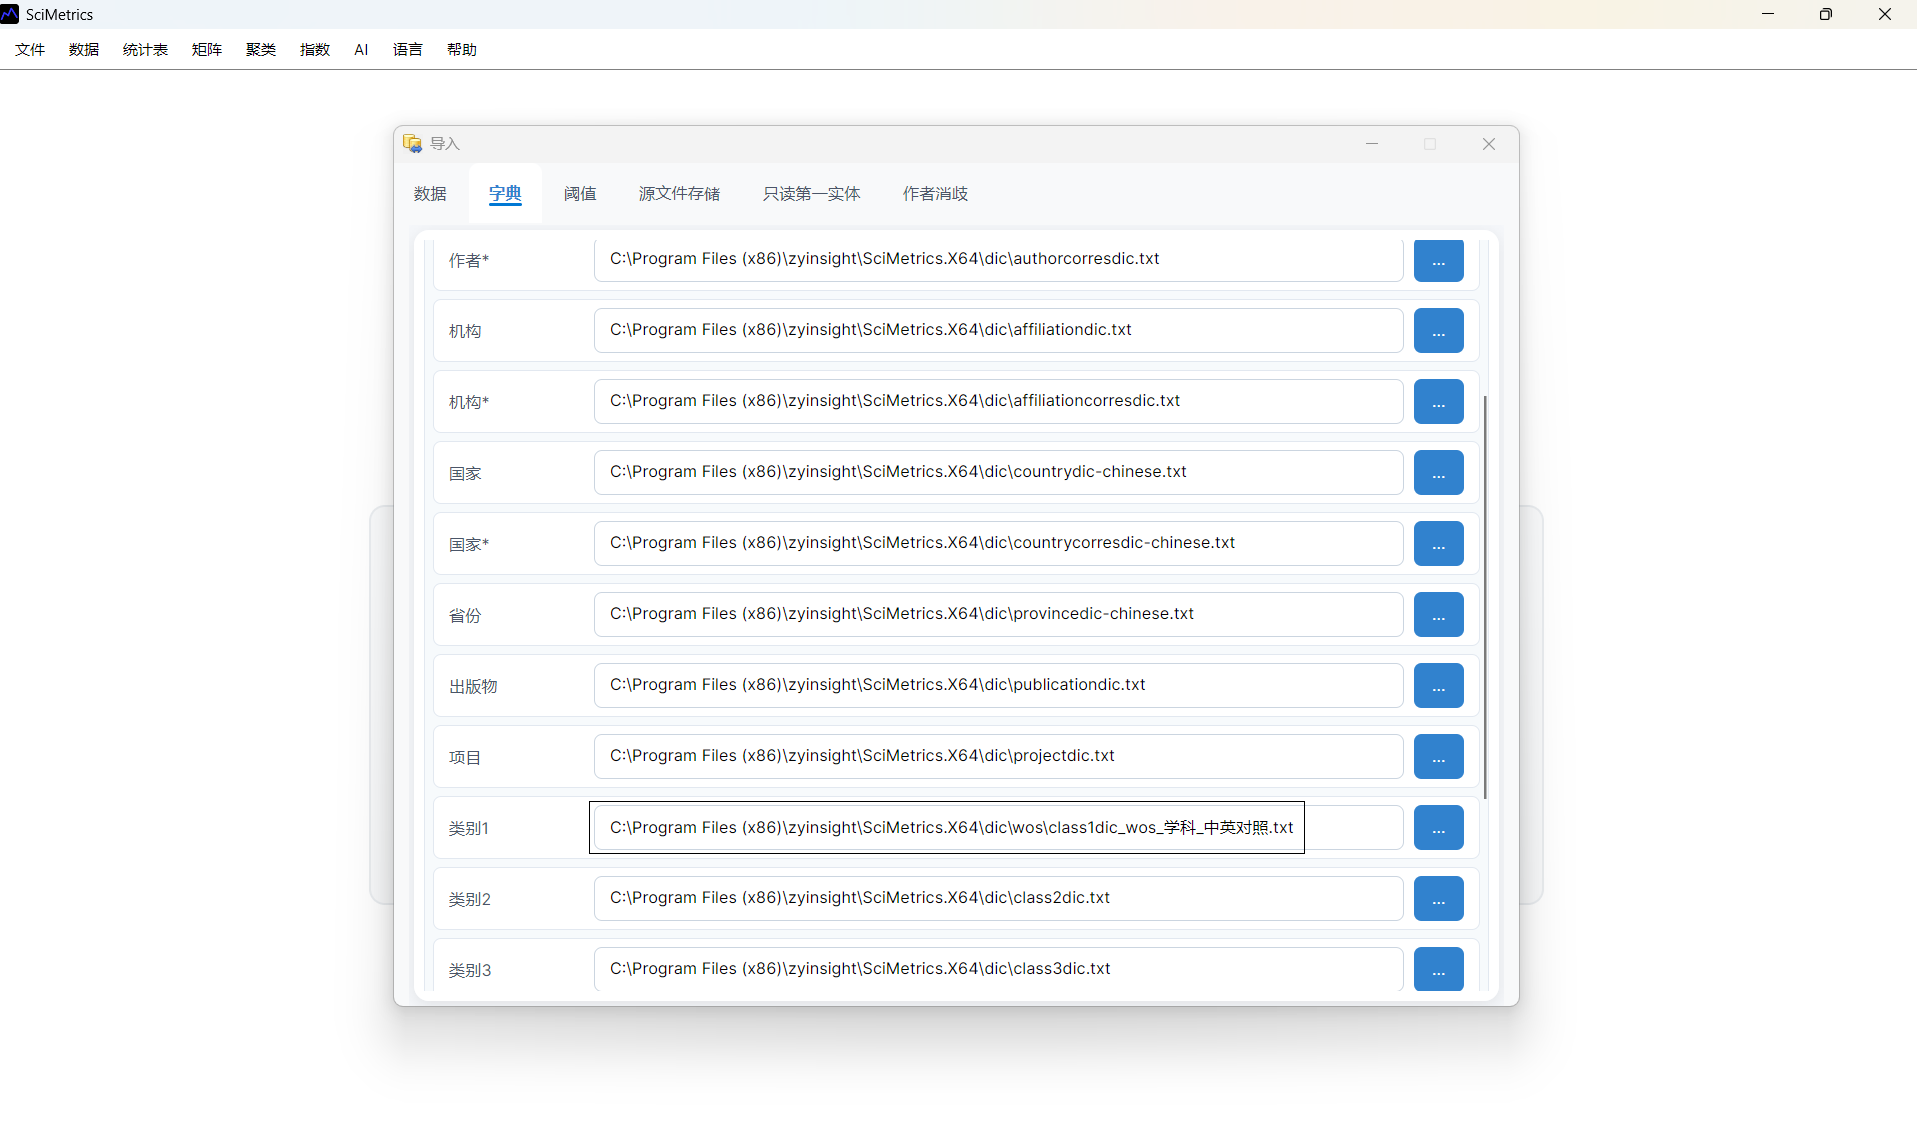
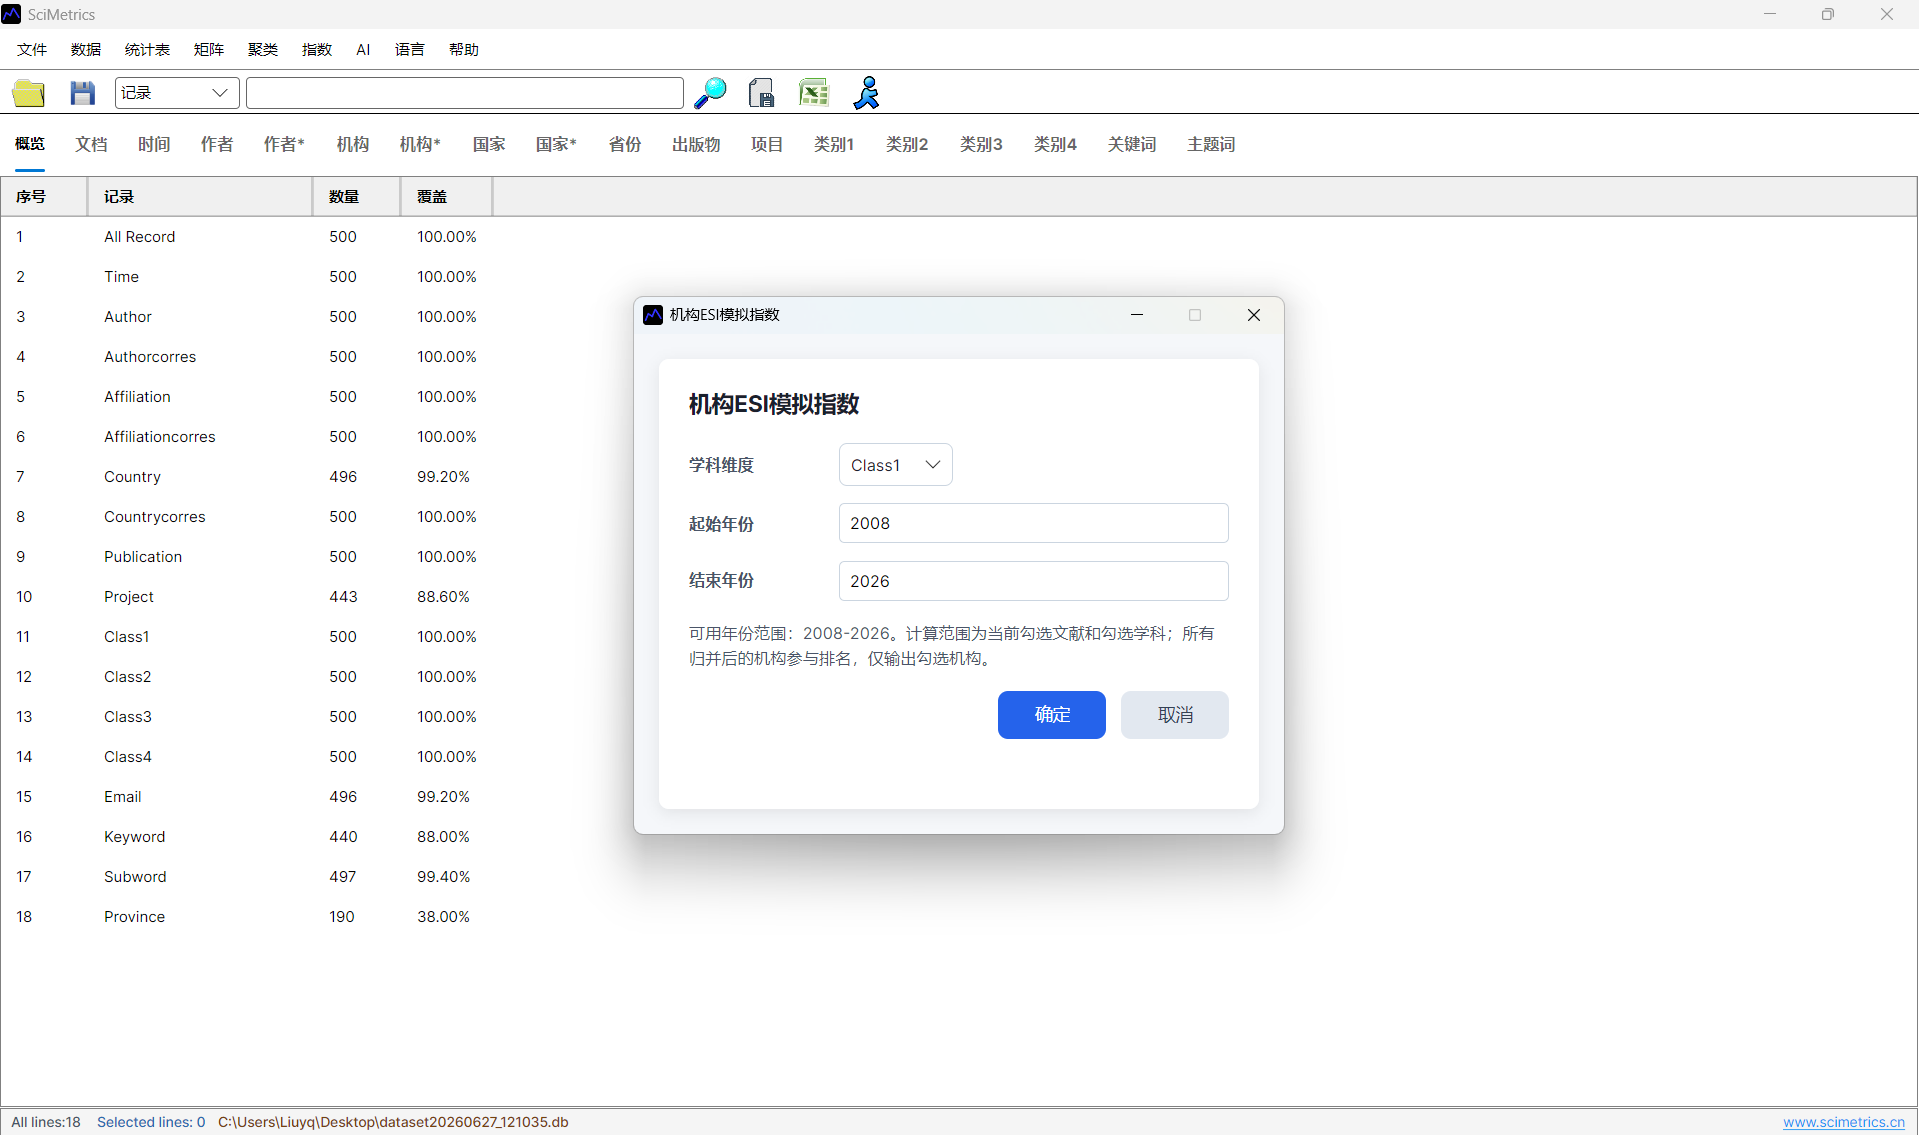
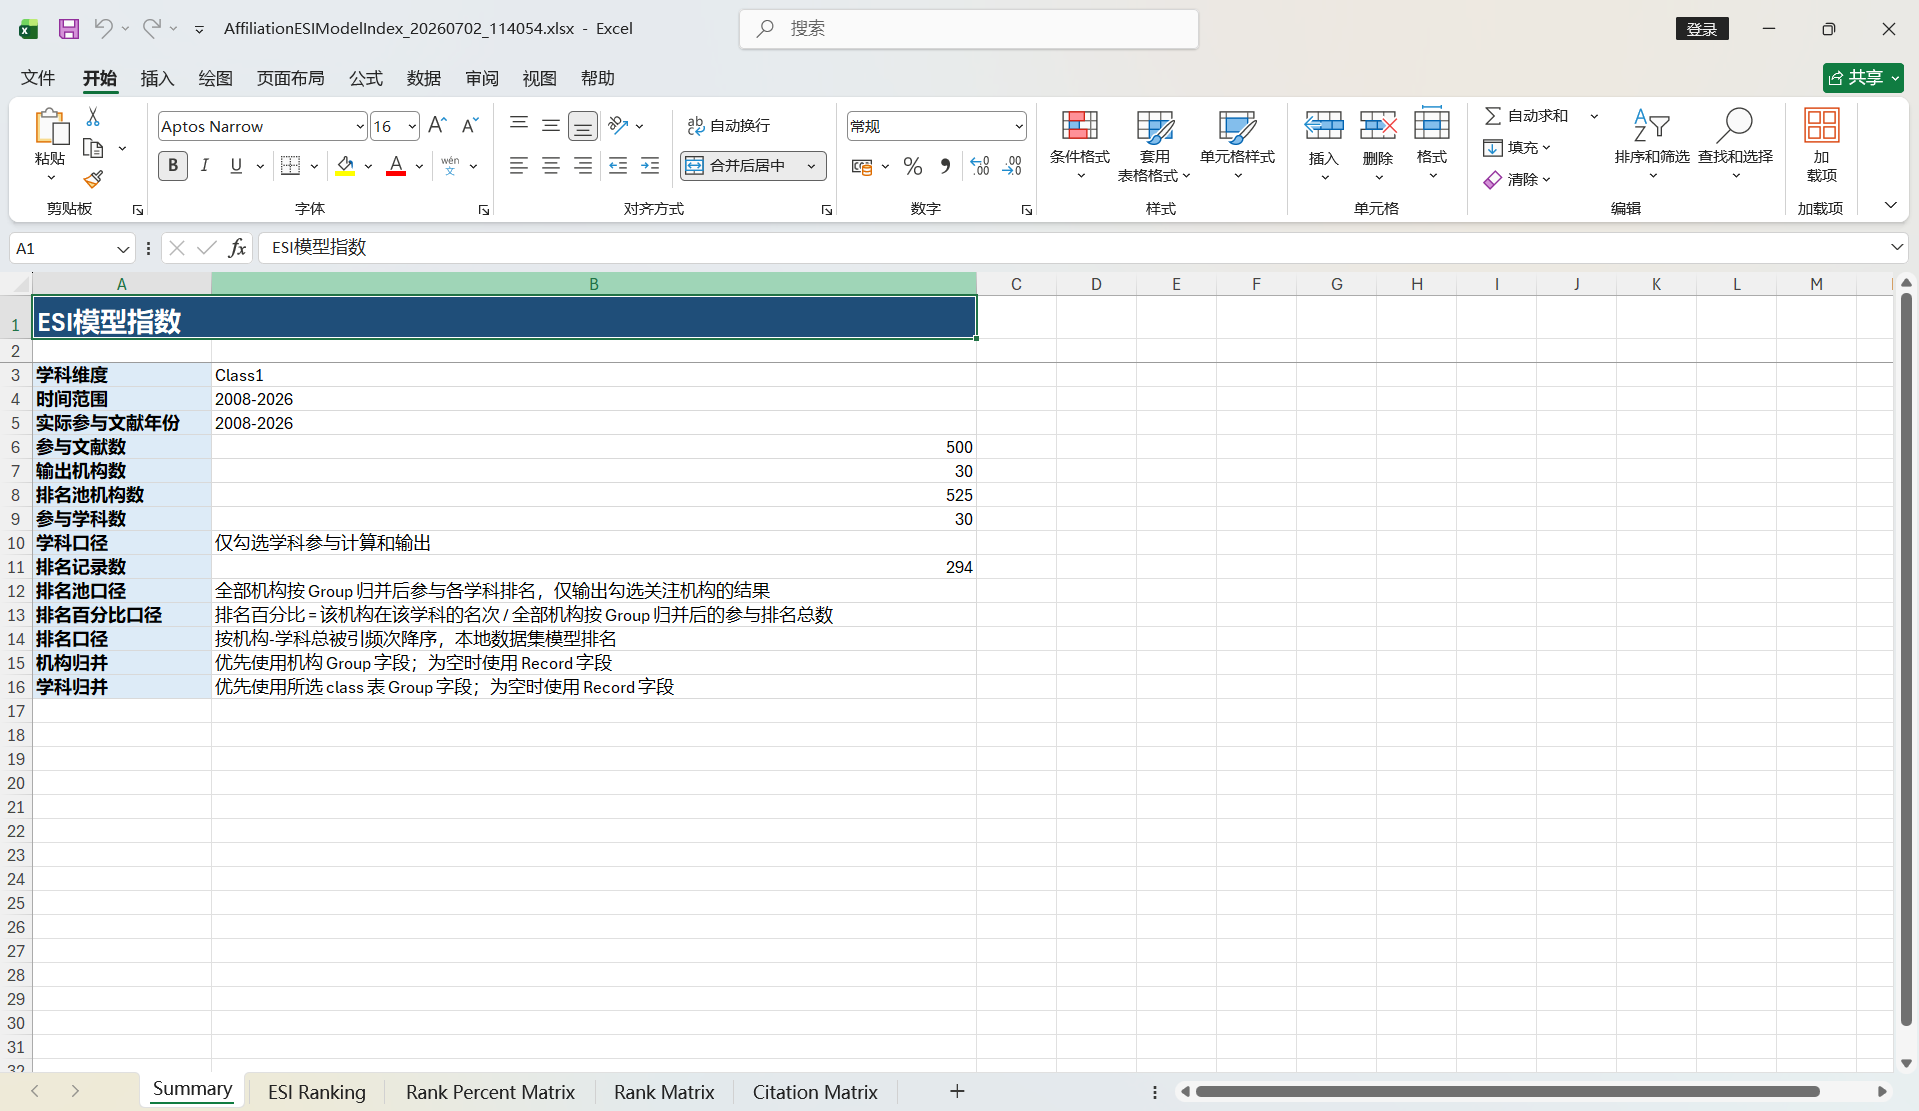
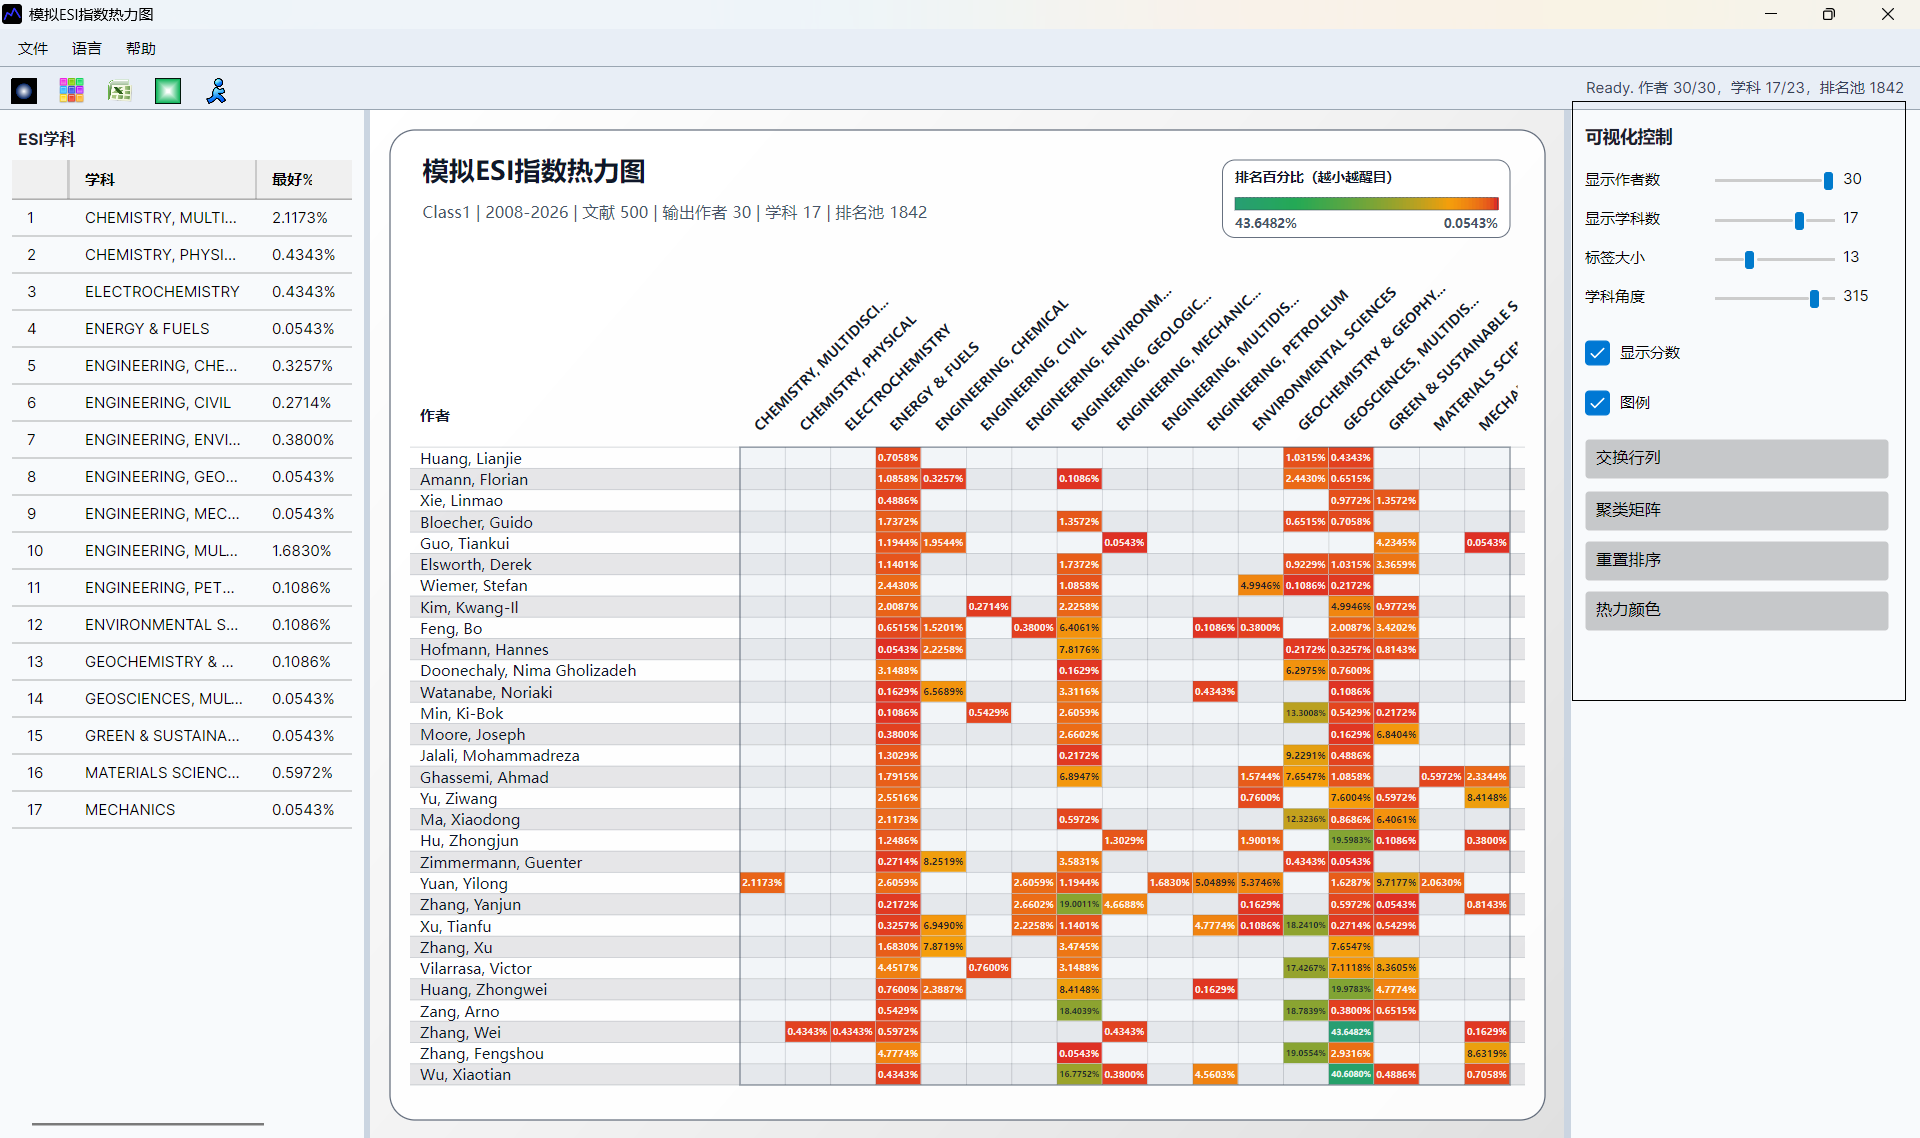
Interface Screenshots
The screenshots below are retained to verify menu entries, parameter settings, result views, and export locations.
Scientist Impact Index
Use SCI-based indicators to discover influential researchers and talent candidates.
Scientist Impact Index And Talent Discovery
The scientist impact workflow supports external talent discovery by calculating SCI-based author, institution, and country indicators in a defined research field. It helps identify influential researchers, benchmark organizations, and candidate pools for deeper review.
Recommended Workflow
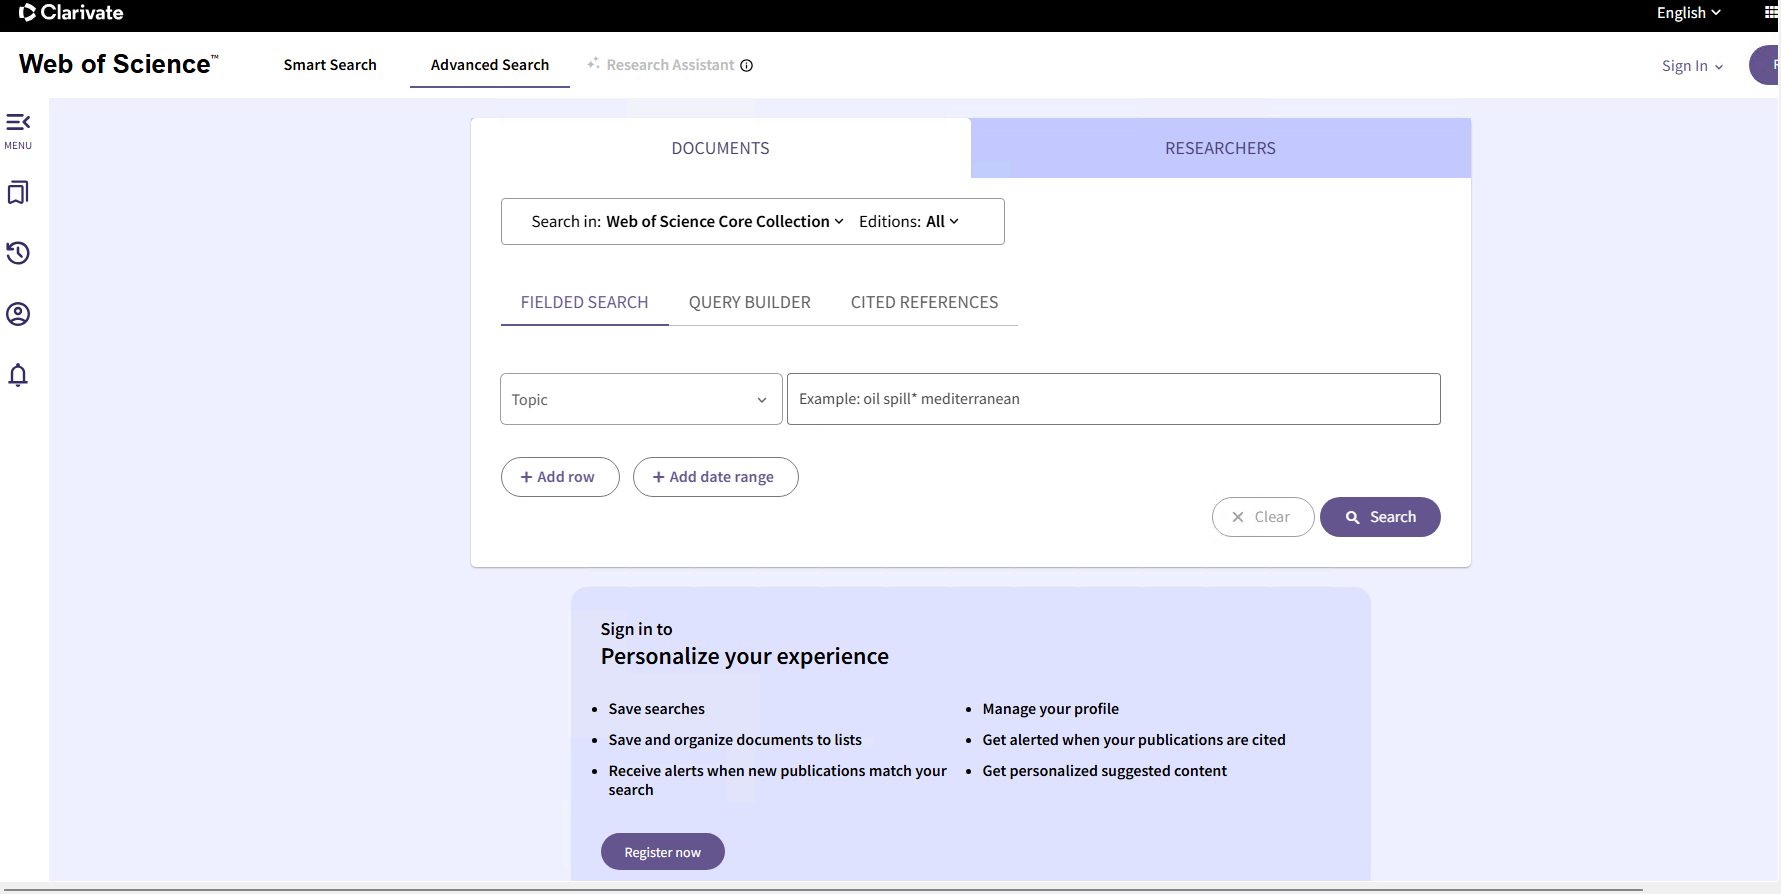
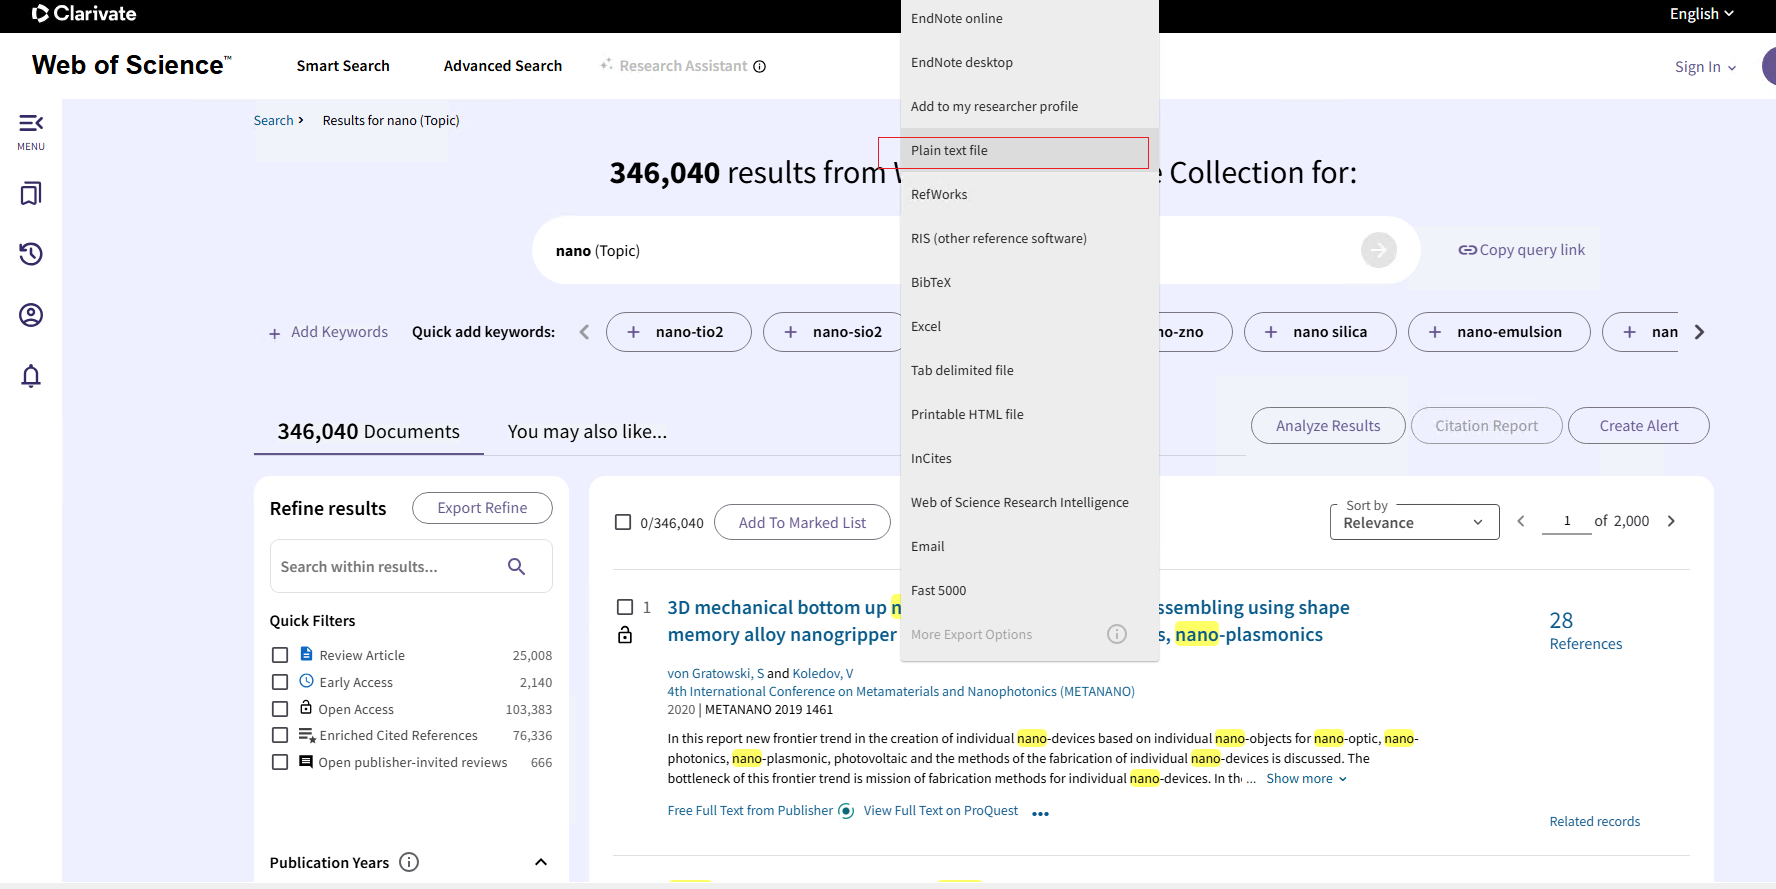
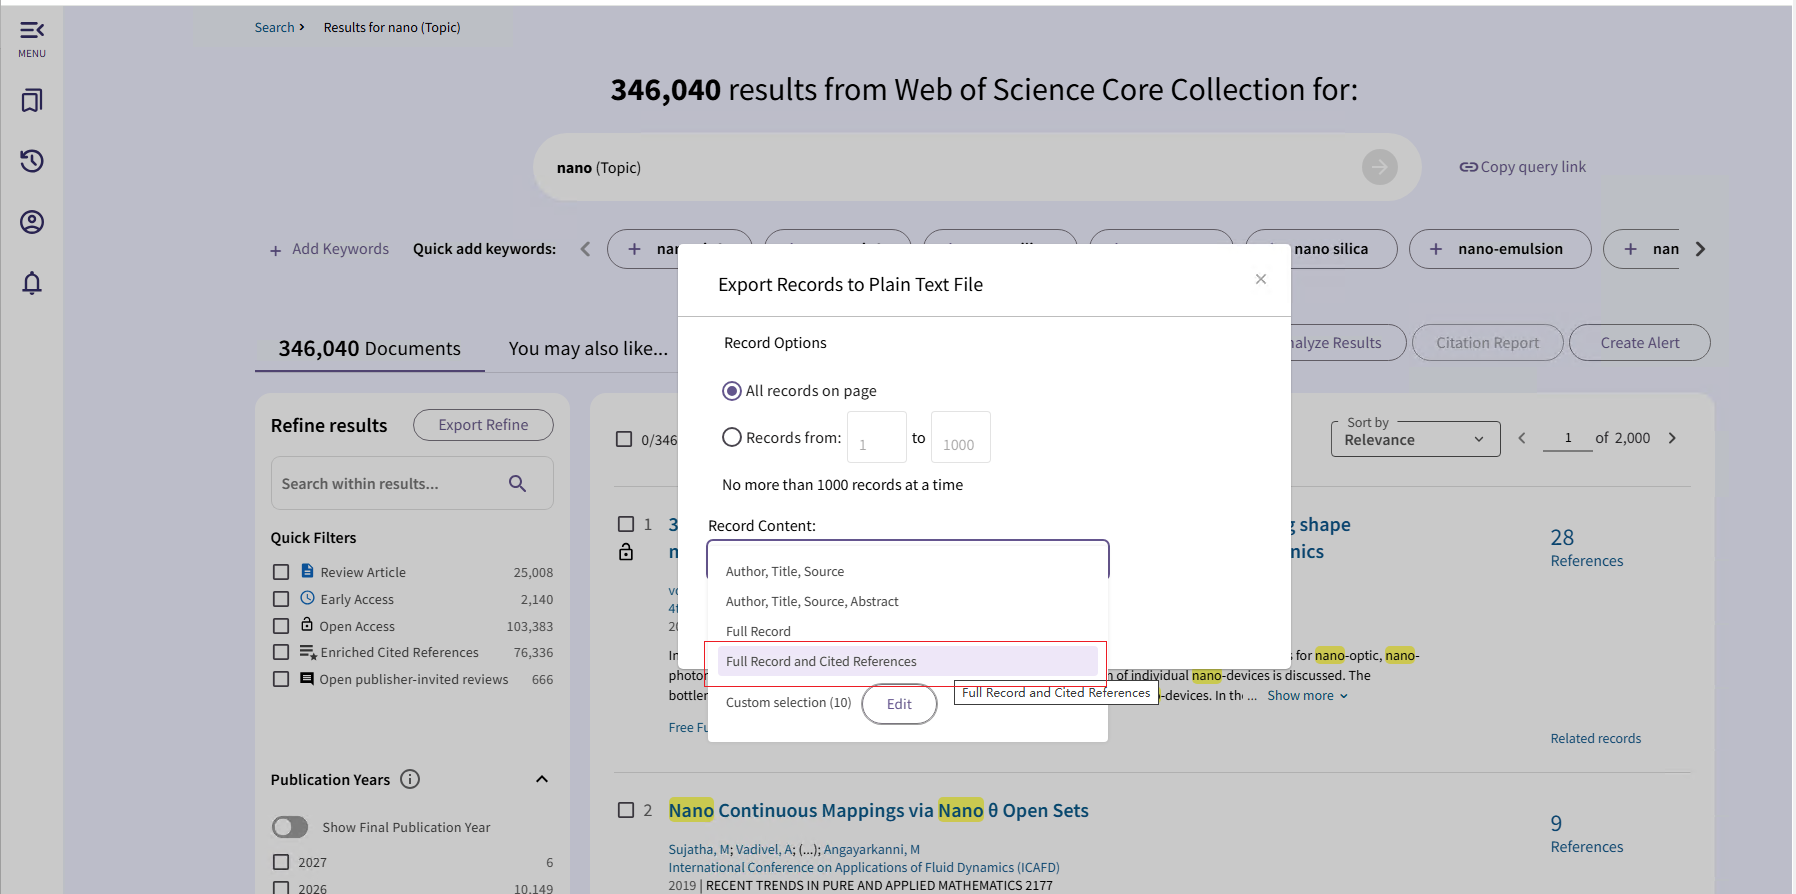
- Download SCI or WoS data for a clearly defined field.
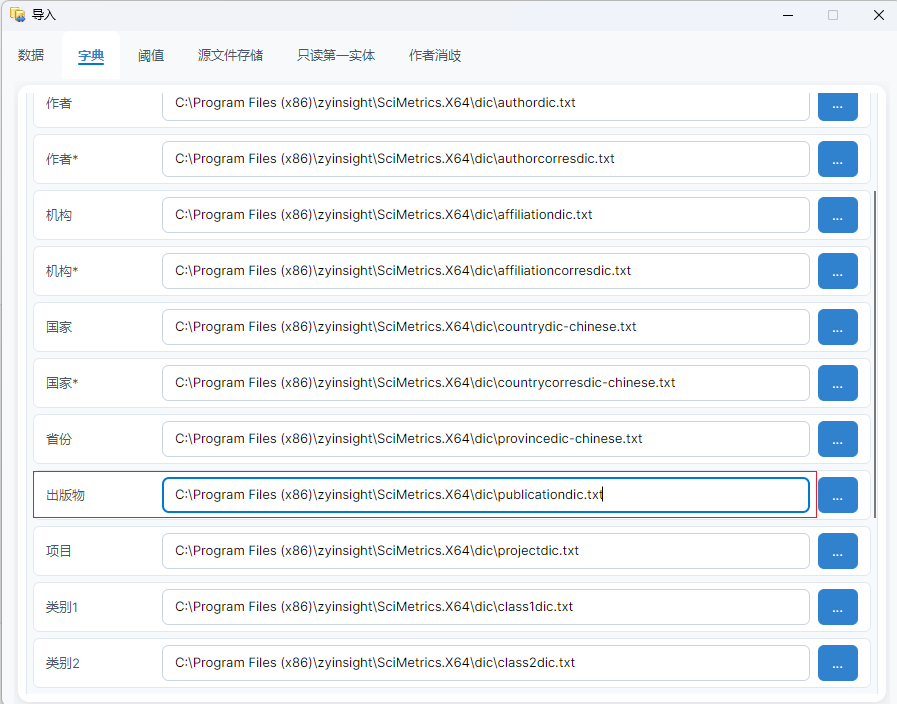
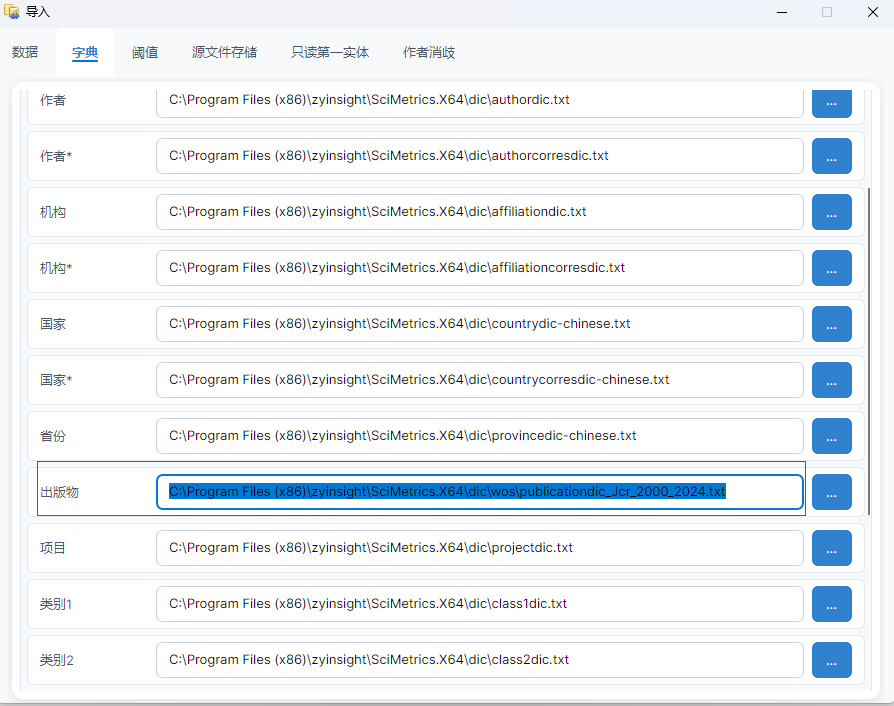
- Select the appropriate JCR dictionary or subject boundary.
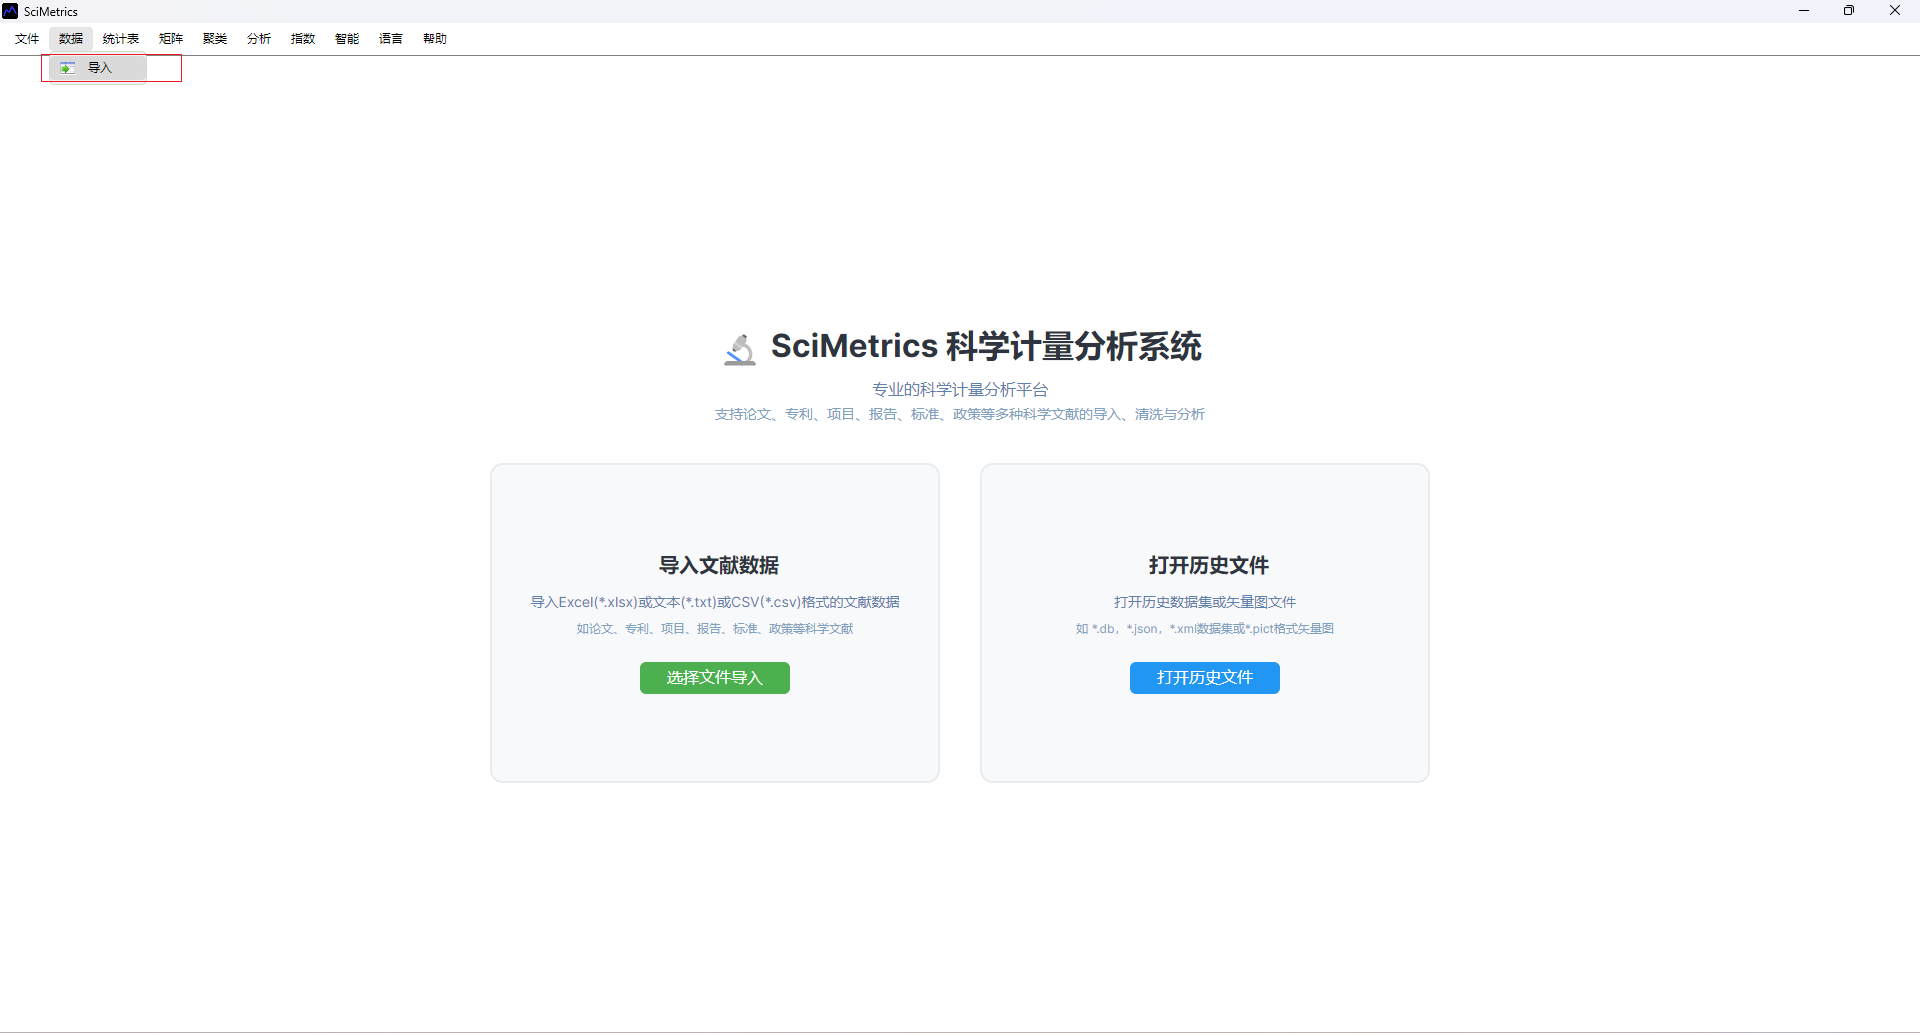
- Import the data into SciMetrics.
- Check years, citations, source titles, authors, institutions, and duplicate records.
- Calculate author impact indicators.
- Calculate institution and country indicators when benchmark context is needed.
- Save Excel results and reopen them for review and visualization.
- Export evidence tables and figures for the report.
Technical Focus
The workflow depends on field boundary quality. A broad search can create noise; a narrow search can miss candidates. Keep the search strategy, JCR dictionary, cleaning rules, and time range with the exported result so the ranking can be reproduced.
How To Use The Result
Use the index to build a candidate shortlist, not as a single final decision. Combine citation impact, publication continuity, collaboration network, institutional context, recent activity, and paper-level evidence. For talent introduction, always review representative papers and the candidate's fit with the target discipline.
Delivery Checklist
- Author indicator table.
- Institution or country benchmark table.
- Candidate evidence list with representative papers.
- Notes about data source, time window, search strategy, and cleaning rules.
- Figures exported as SVG or high-resolution images when used in formal reports.
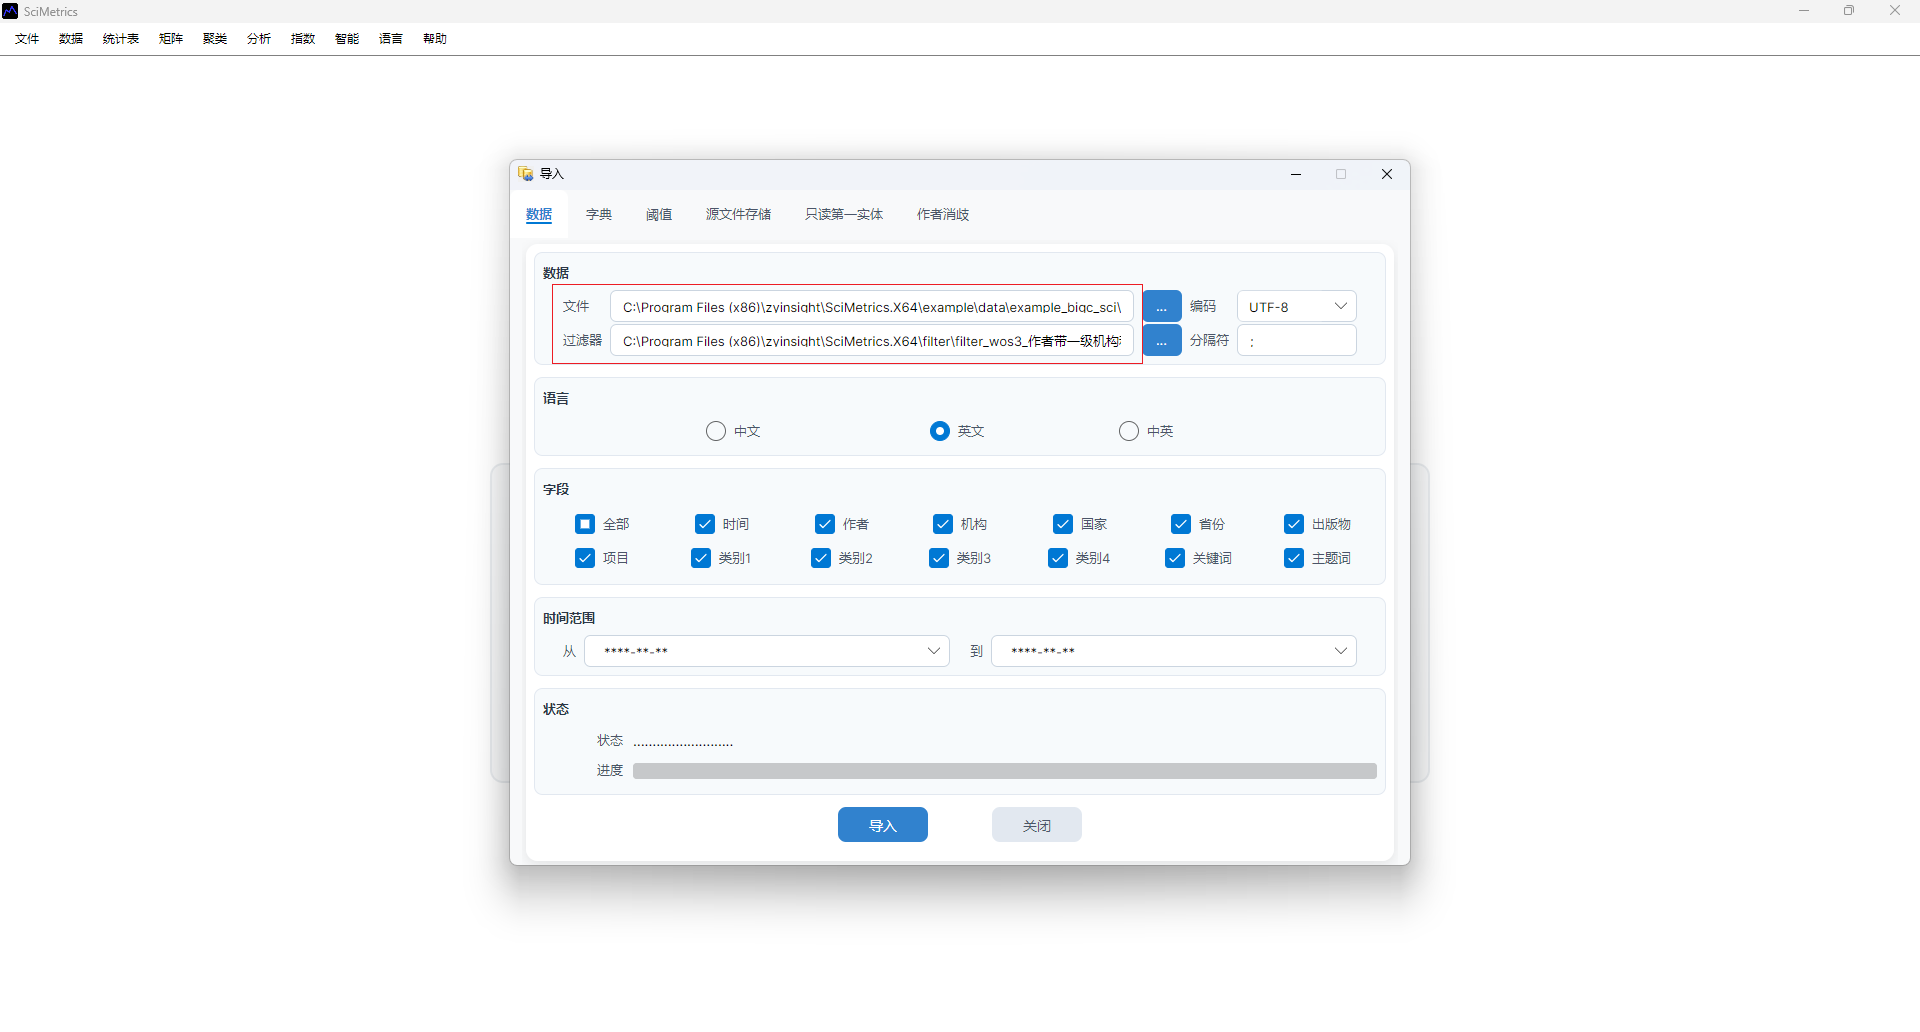
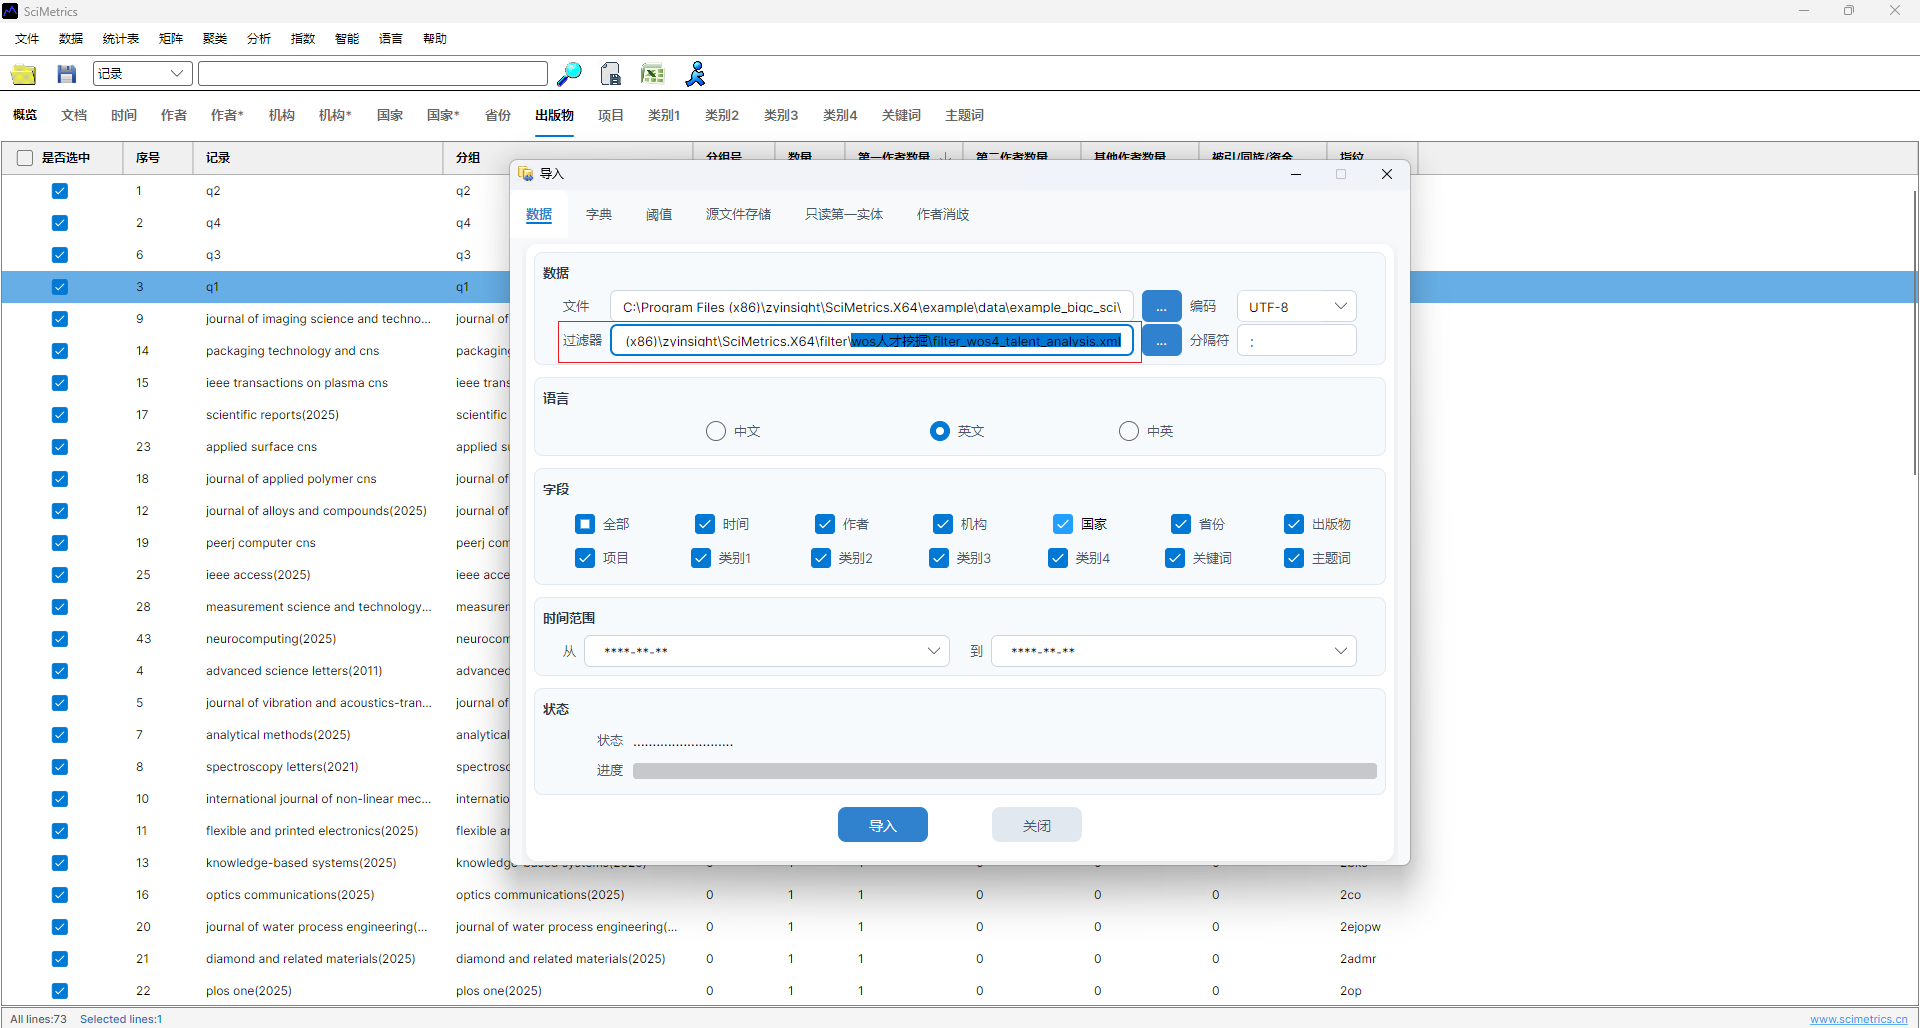
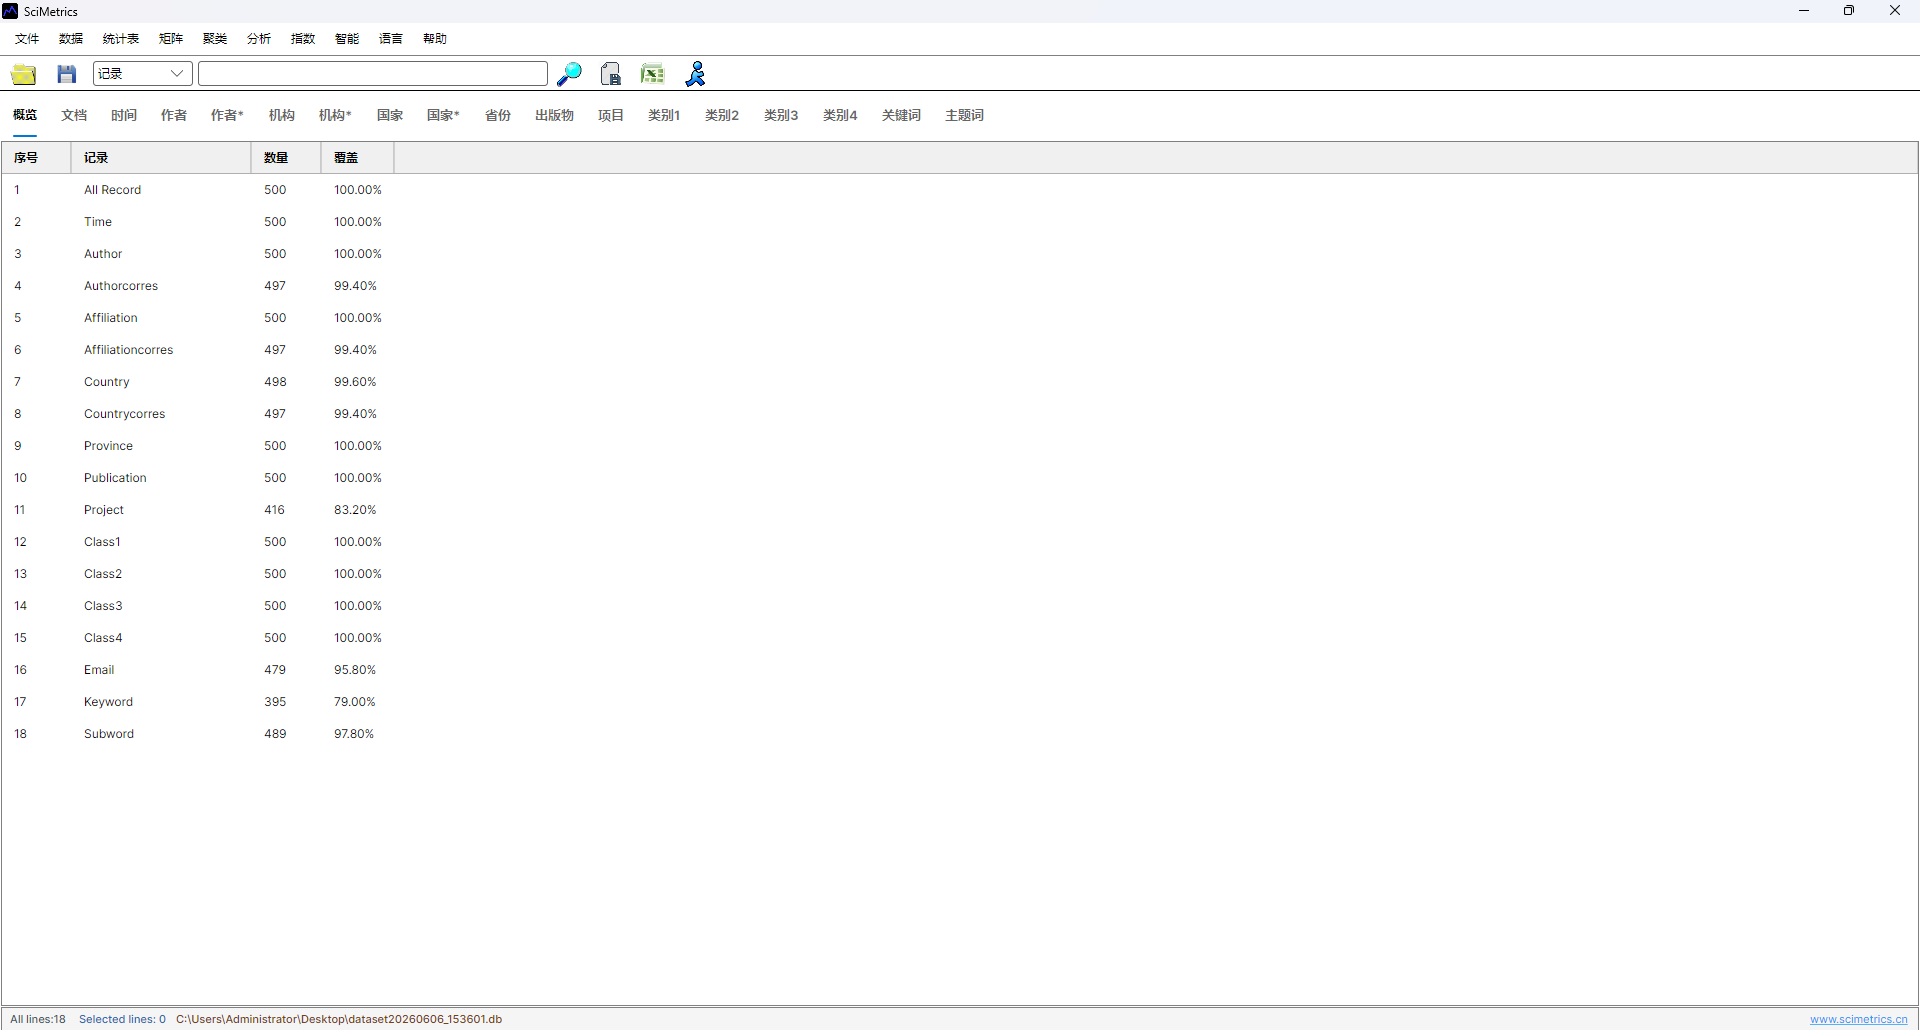
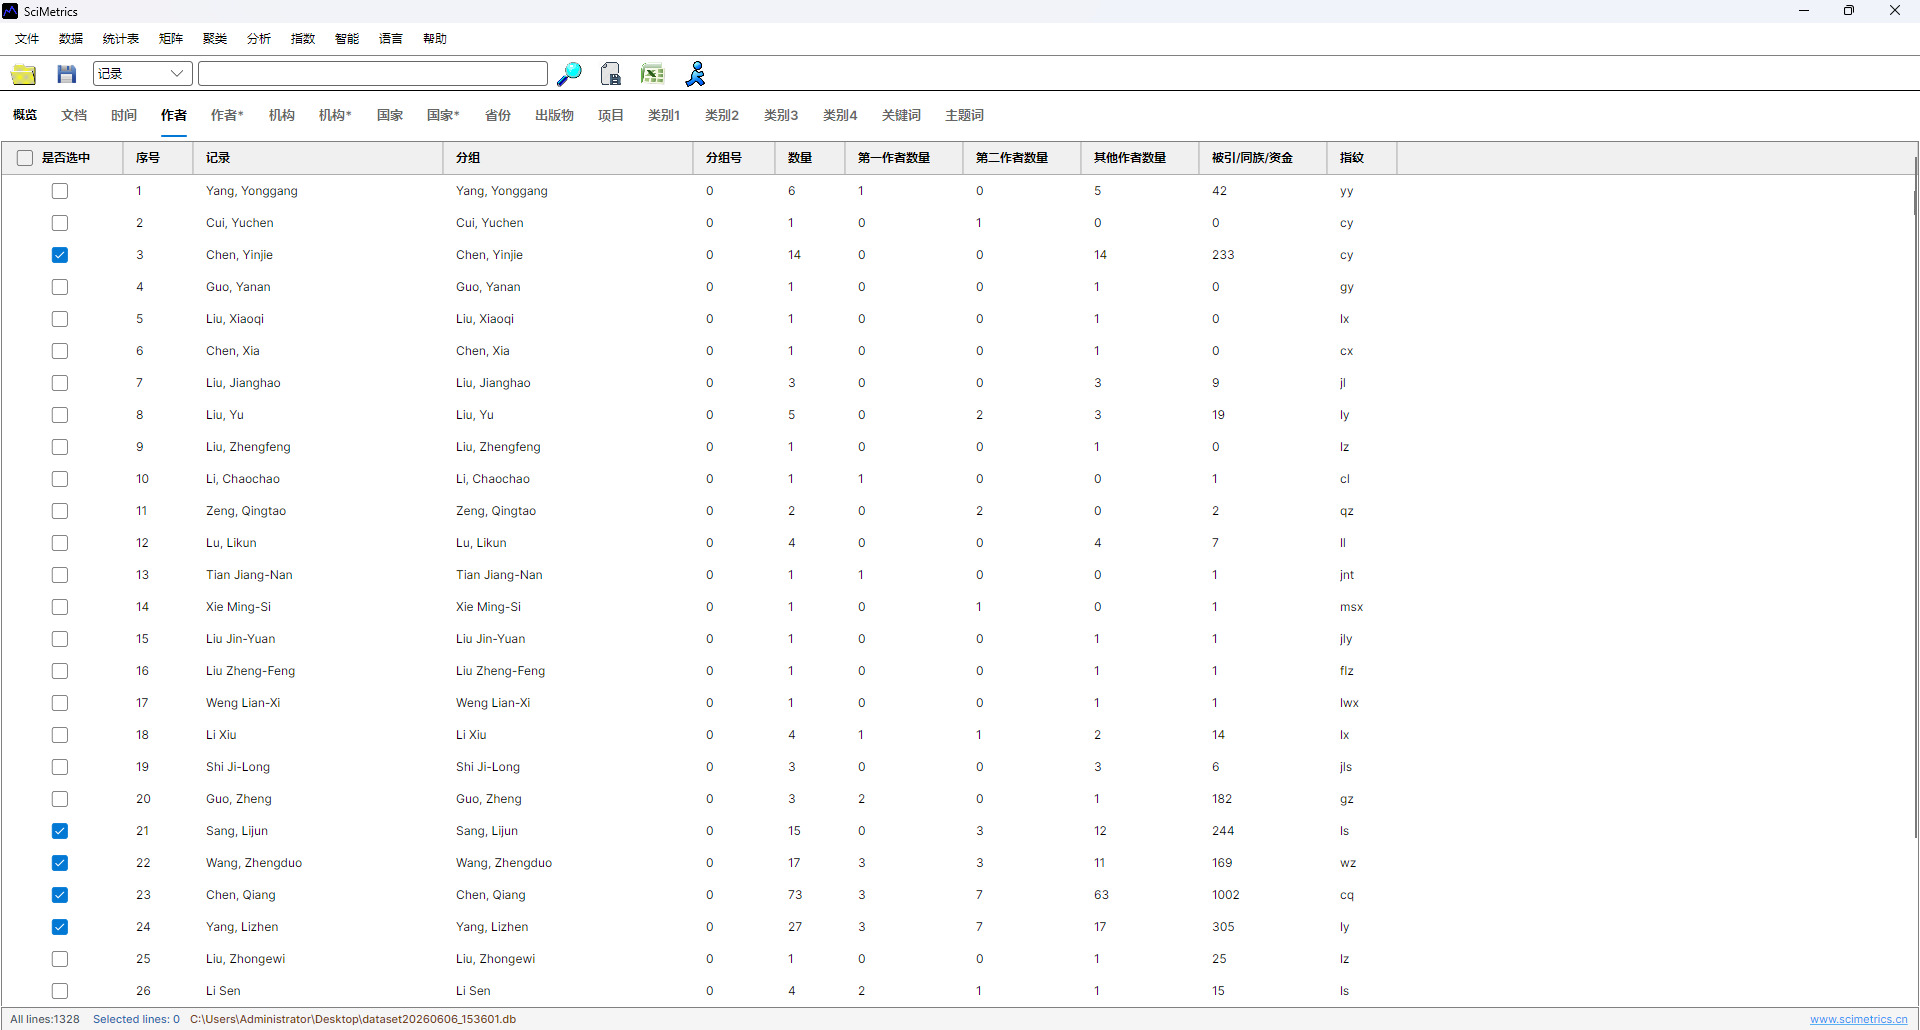
Interface Screenshots
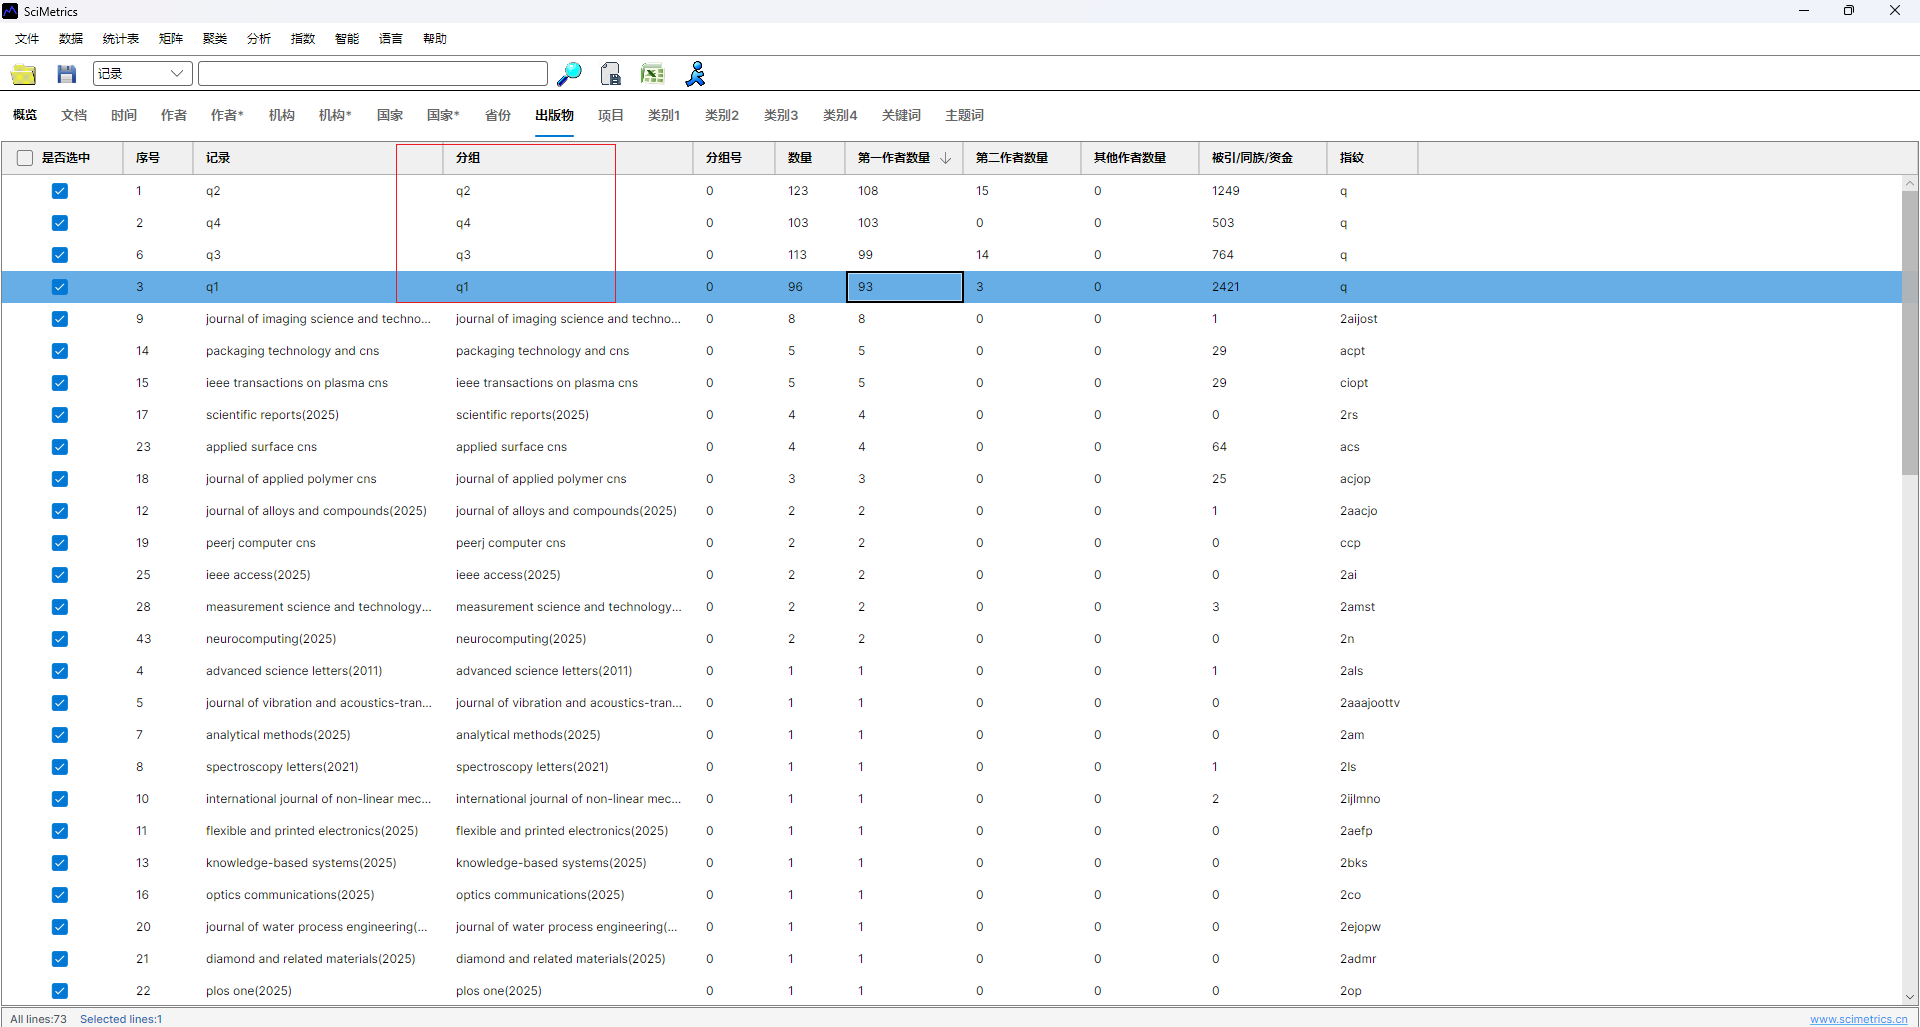
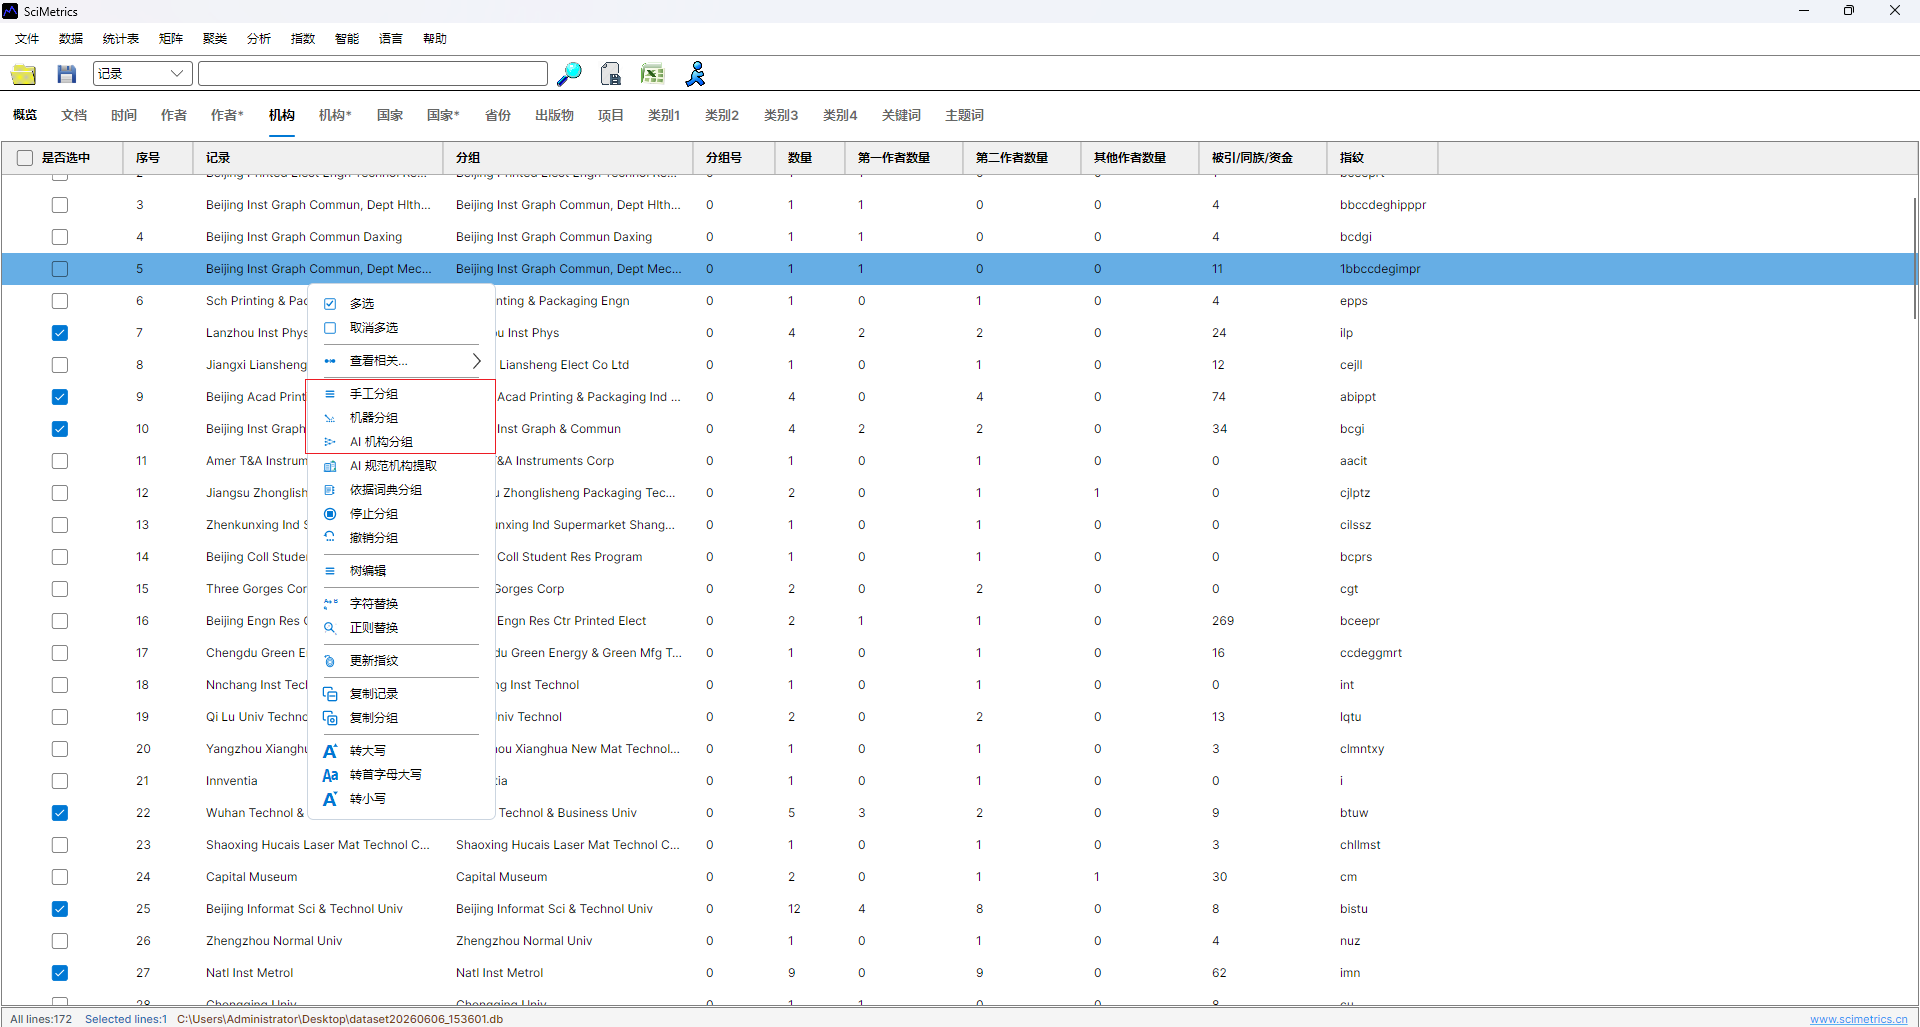
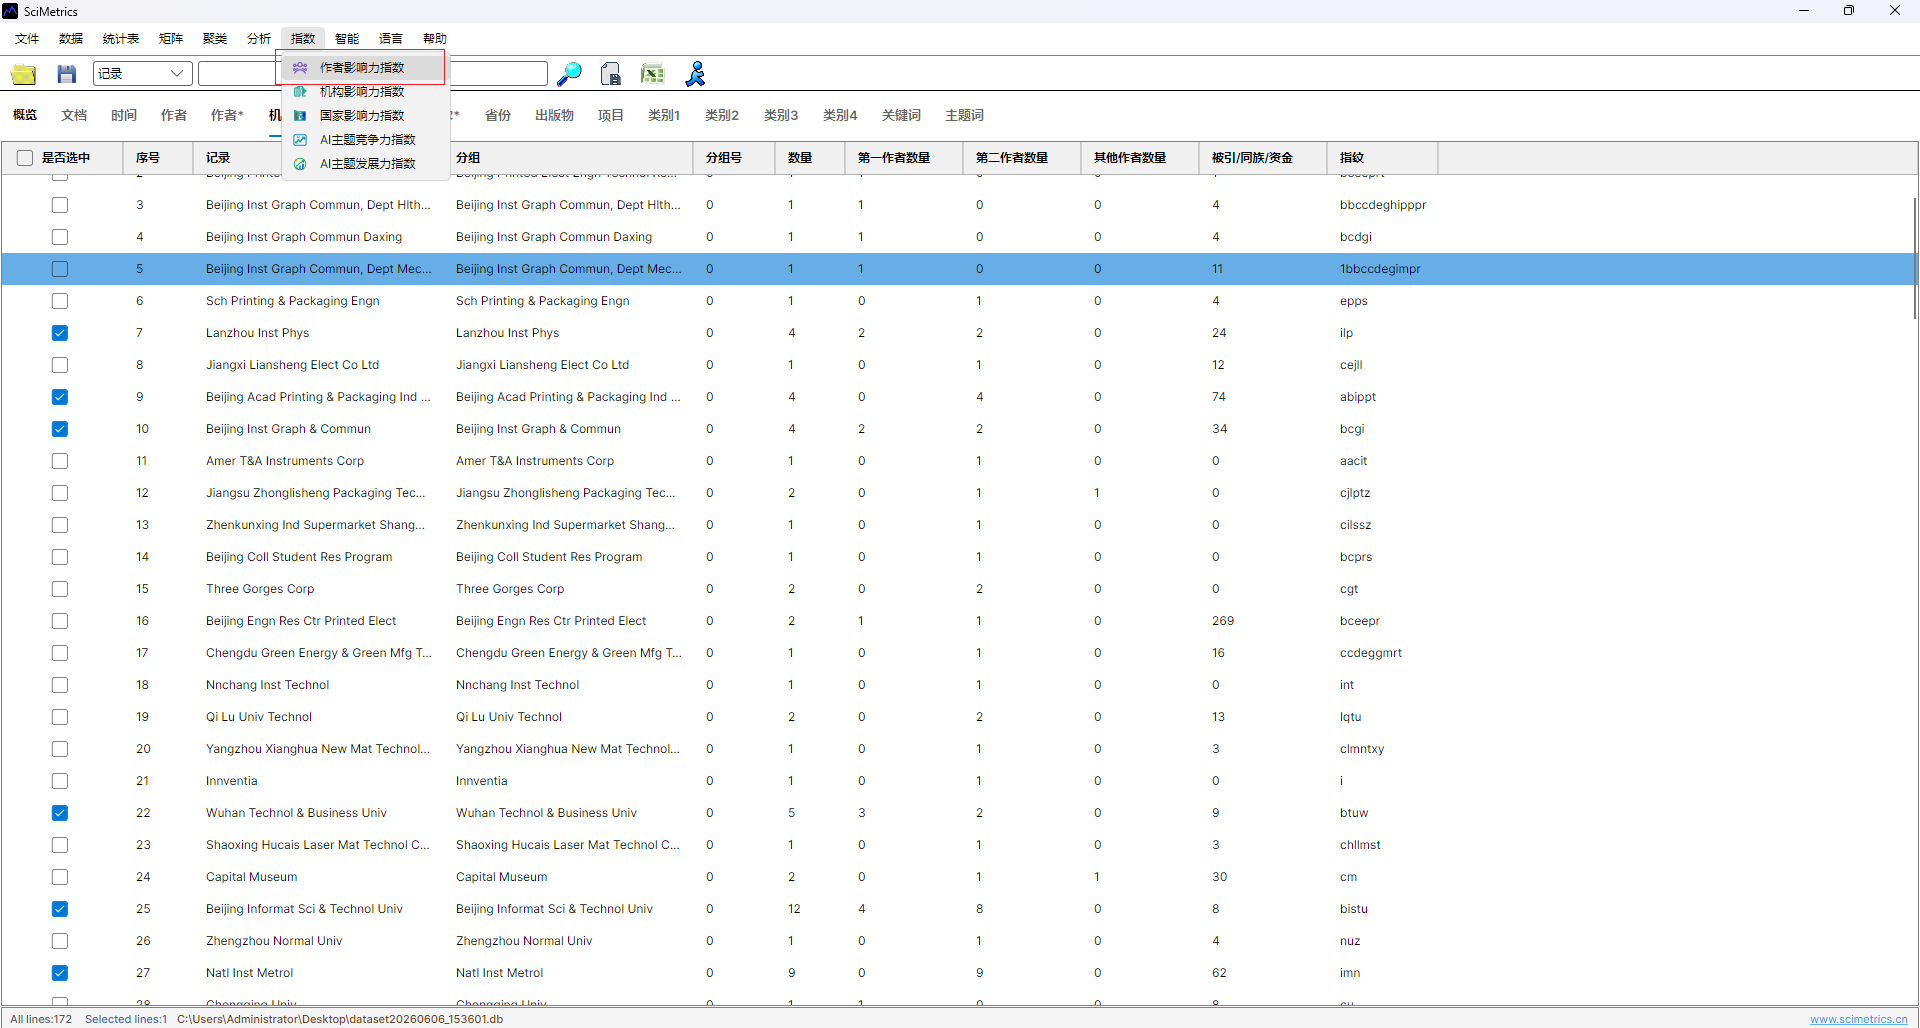
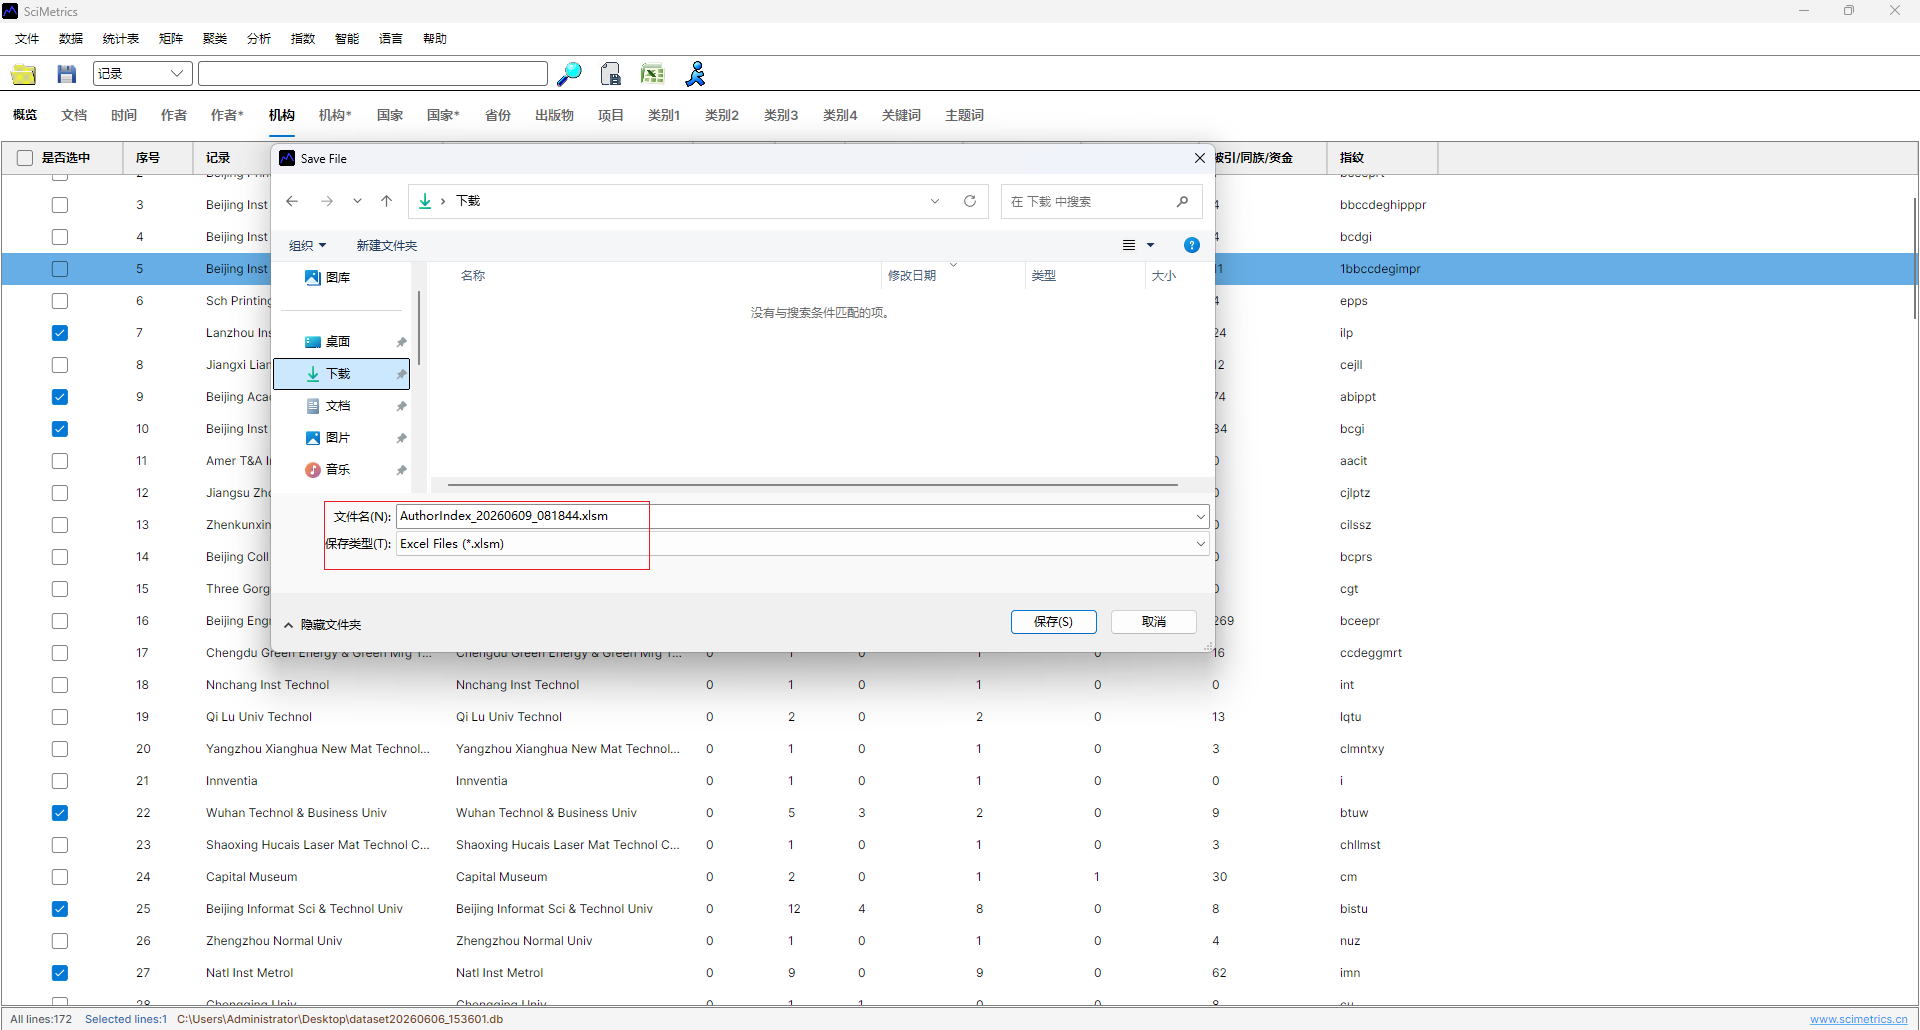
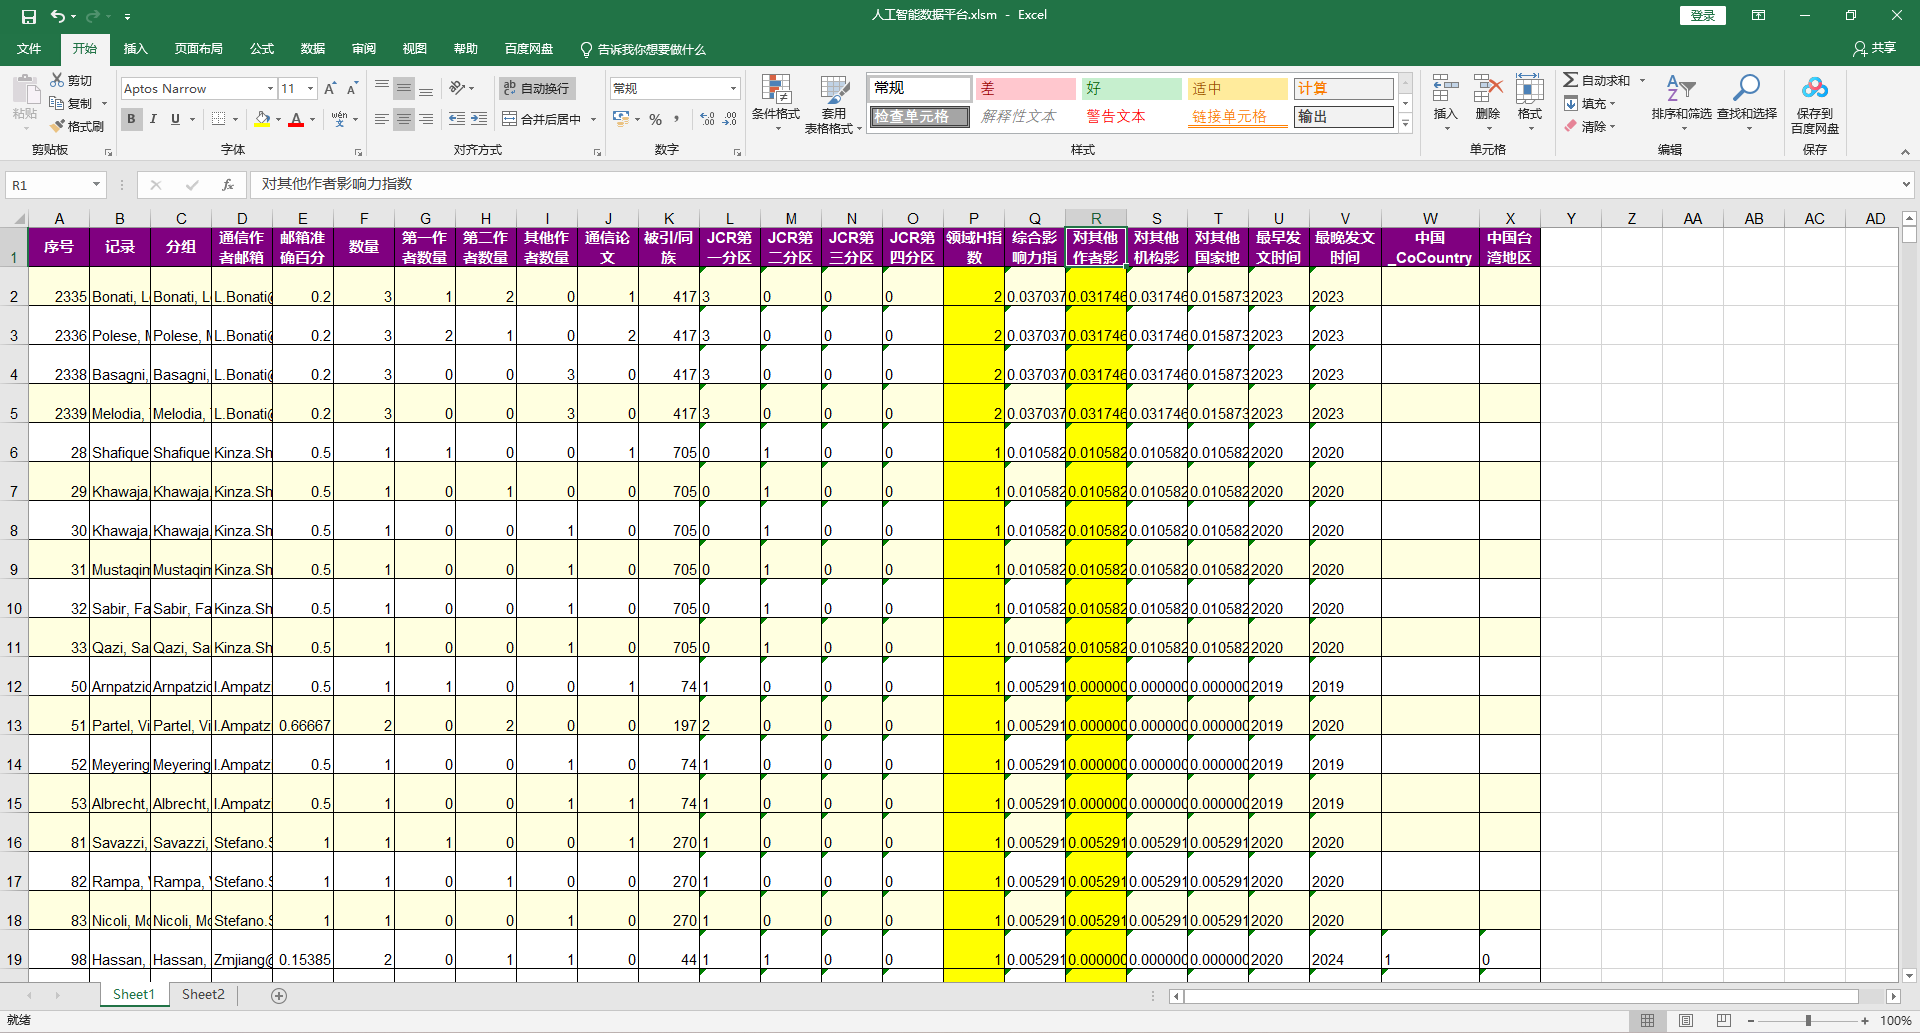
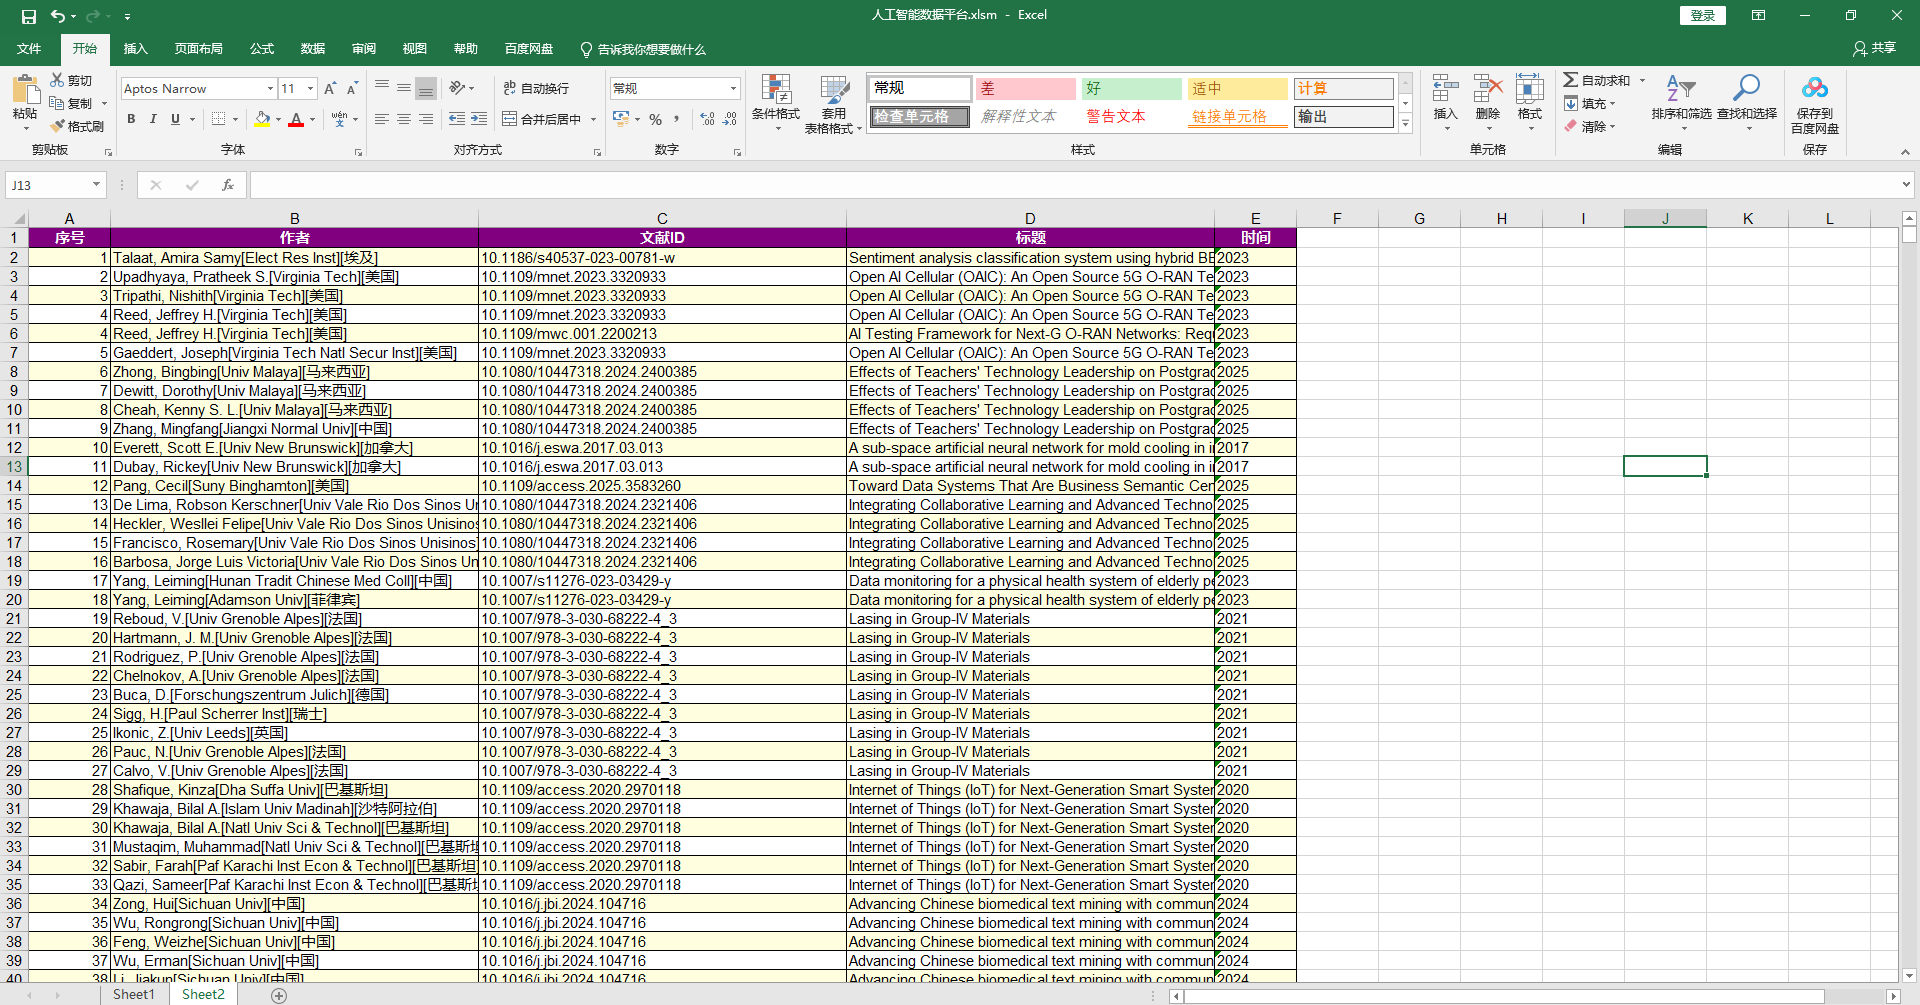
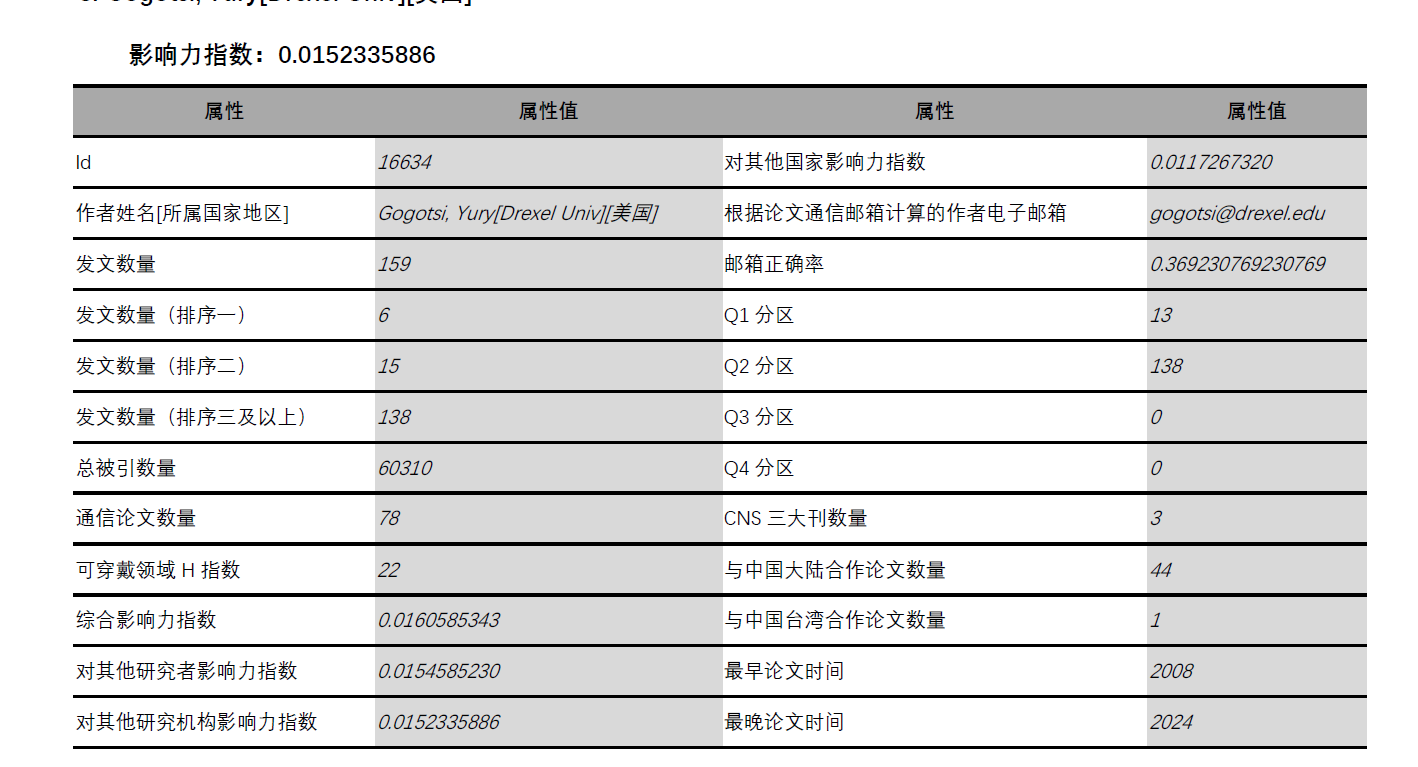
The screenshots below are retained to verify menu entries, parameter settings, result views, and export locations.

MCP Conversation Guide
Use SciMetrics without API knowledge: describe research tasks, confirm stages, verify results, and work safely with an AI assistant.
Operate SciMetrics in Natural Language: MCP and AI Assistant Guide
MCP (Model Context Protocol) is the tool bridge between an AI assistant and SciMetrics. You do not need to know HTTP, JSON-RPC, endpoint URLs, or parameter names. Describe the task as you would to a research assistant. The AI checks the capabilities currently exposed by SciMetrics, selects the right tools, runs them, and reports the result.
Traditional scientometric software usually requires users to remember menus, option dialogs, and a fixed sequence of clicks. SciMetrics MCP adds a different workflow: express the research question in conversation, let the assistant organize the operations, call SciMetrics, verify the outputs, and continue into report preparation. The normal user interface remains available; MCP is an additional entry point for complex, batch, and reproducible work.
The three roles
| Role | Responsibility | Technical knowledge required |
|---|---|---|
| AI assistant | Understand the request, fill in steps, choose SciMetrics tools, and explain results | No |
| SciM MCP service | Pass approved tool calls to SciMetrics on the same computer | Usually a one-time setup |
| SciMetrics | Import, clean, calculate, analyze, visualize, and export | Runs within the product license |
MCP does not replace SciMetrics methods and does not bypass licensing. The assistant interprets and organizes; SciMetrics executes deterministic operations.
Choose an assistant
| Scenario | Recommended entry point | Main benefit |
|---|---|---|
| Talk to a general-purpose work assistant | WorkBuddy | Configure the local MCP once, then ask in English or Chinese |
| Operate SciMetrics and also organize local files, edit scripts, create Markdown, or inspect outputs | Codex (Codex in ChatGPT, desktop app, CLI, or IDE) | Combines SciMetrics tools with workspace file operations |
| Open an ordinary ChatGPT web chat only | It cannot directly connect to the current local MCP | SciM MCP is a local stdio server; ChatGPT web custom MCP uses a remote server or secure tunnel and cannot launch a local EXE path directly |
If you are unsure, start with the WorkBuddy or Codex setup page. After setup, daily use is conversational and does not require editing configuration files.
First conversation: verify the connection
Send this before starting a real analysis:
Check whether the scim MCP service is connected.
Read the current state and list the available tools or commands. Do not modify any data.
Tell me whether the connection works, whether it is using desktop or headless mode, and what categories of tasks are available.
If the assistant returns the SciMetrics state and command categories, the connection works. If it only explains MCP without calling a tool, say:
Do not give me setup theory only. Actually call the scim MCP state tool.
If the tool is unavailable, tell me whether the missing step is configuration, restart, or permission.
The most effective request structure
A strong task normally contains six pieces:
- Goal: the research question, not just “make a chart.”
- Input: a full data-file path, an existing dataset, or the currently open window.
- Scope: years, document types, institutions, authors, topics, Top N, or other boundaries.
- Processing rules: dictionaries, checked records only, merge policy, and overwrite policy.
- Output: table, SVG, Excel workbook, report outline, or an on-screen view.
- Acceptance test: what proves completion, such as file existence, record counts, and explainable node counts.
Reuse this template:
Use SciMetrics MCP for this task.

Research goal: <question to answer>
Input: <full path or current dataset>
Scope: <years, subjects, filters>
Processing rules: <language, dictionaries, checked-only, overwrite policy>
Output: <format and full destination path>
Acceptance checks: <what must be verified>

Before starting, inspect the SciMetrics state and available commands. Ask only for missing critical information.
Before overwriting, deleting, or making a large batch change, explain the impact and wait for confirmation.
When finished, report the actual steps, key results, output files, verification, and anything incomplete.
Use full paths such as D:\Research\wos-2025.txt, explicit ranges such as 2018-2025, and an exact output format and folder.
You do not need command names
Do not worry about names such as scim_run_command or dataset.import_text. Describe the goal:
I do not know the SciMetrics command names. Find the best available command for my request and inspect its required parameters.
Import D:\Data\wos.txt, keep records from 2020 through 2025, and then summarize annual publication counts.
Show me a short plan first. Ask only when a required decision is missing.
Behind the scenes, the assistant can inspect the command catalog or request suggestions before running a deterministic operation. Exact tool names are mainly useful for troubleshooting.
Four conversation patterns
1. Execute directly
Best for read-only, reversible, or fully specified tasks:
Read the current dataset state and summarize the row counts of Document, Author, and Affiliation in a table. Do not modify data.
2. Plan, then confirm
Best for cleaning, merging, deleting, overwriting, or long jobs:
Find possible institution-name synonyms. First show suggested merges and affected counts; do not change anything yet.
Wait for my confirmation, then apply approved merges and keep a change summary.
3. Work in stages
Do not force a complex project into one sentence. Move through import, quality review, cleaning, analysis, interpretation, and export:
For stage one, import and run quality checks only. Report accepted records, year range, missing fields, and clear anomalies. Do not build a network yet.
Then continue:
For stage two, build an institution collaboration network from the imported data. Recommend a noise-reducing node filter and explain it. Wait for my threshold approval before generating the network.
4. Make the workflow reproducible
After the analysis, create a Markdown operation log containing the input files, filters, actual commands, key parameters, outputs, and timestamps. Do not include secrets or unnecessary personal data.
Codex is especially useful when the log, scripts, and output files should be organized together in a workspace. WorkBuddy can also return a structured operation record in the conversation.
Copy-ready research prompts
Import and quality review
Use SciMetrics MCP to import D:\Project\Data\records.txt.
The source is Web of Science, the primary language is English, and the period is 2015-2025.
Find a matching import filter instead of guessing its name.
After import, check document, author, and affiliation counts, year coverage, and missing values. Stop and explain if the checks reveal an anomaly.
Name cleaning
Inspect name variants in the Affiliation table.
First return a preview with original name, proposed standard name, affected records, reason, and confidence.
Do not merge low-confidence cases automatically and never modify Id fields. Wait for my confirmation before a batch update.
Collaboration network and visualization
Build an institution collaboration network for 2020-2025 from the current dataset.
Inspect the available network and visualization commands, then recommend a filter that reduces noise.
Use a white background, hide isolated nodes, retain the legend, and limit labels to 30 characters.
Export SVG and Excel versions to D:\Project\Output and verify that both files exist.
Emerging topics and growth potential
Identify emerging topics in the current cleaned dataset.
Before execution, state the required fields, AI model requirement, and processing scope. Use a small sample or dry run if supported.
Separate SciMetrics calculations from AI interpretation. Include representative records, growth signals, limitations, and topics requiring human review.
Compare institutions or researchers
Compare Institution A, Institution B, and Institution C on the topic "geothermal energy storage."
Confirm that all three entity names match the dataset, then select publication, impact, collaboration, and topic-competitiveness measures.
Do not describe correlation as causation. Return a comparison table, three main findings, and data limitations.
Export report materials
Prepare report materials from the current analysis:
1. Export the core statistics to Excel.
2. Export the main figures to SVG.
3. Create a Markdown methods note with source, period, method, parameters, findings, and limitations.
4. Verify that every referenced output file exists.
List any existing files and wait before overwriting them.
Complete a closed-loop task in WorkBuddy or Codex
After connection, no separate companion utility is required. Complete the workflow directly in the WorkBuddy or Codex conversation:
- On first use, say “Actually call
scim_get_started.” The assistant checks the connection, current data, and live command modules, then returns ready-to-copy prompts. - Describe the research question normally. Supply an input path when files are involved and an output folder when exports are needed.
- The assistant reads the current state and real catalog first. If information is missing, it asks only for research inputs such as scope, path, or analysis object—not API commands or JSON.
- Before a write, overwrite, or delete, the assistant explains what will change and waits for confirmation. Read-only inspection can proceed directly.
- After a long task returns a
jobId, the assistant keeps checking it and summarizes parallel children without making the user poll manually. - It reports completion only when the task succeeds, failed batches are zero, and output files exist; otherwise it gives the original error and smallest repair step.
Copy-ready closed-loop request:
Recognize AI topics for the checked documents with three parallel Agents.
Acceptance checks: every batch must reach a terminal state, failed batches must be zero, and report the actual number of updated documents.
Call scim_get_started first, then inspect the current state and explain the proposed steps. Do not execute a write before I confirm.
Recommended loop: scim_get_started → describe the research question → inspect state and methods → supply missing essentials → confirm writes → execute → wait for background tasks → verify results.
After an interruption or failure
Tell WorkBuddy or Codex: “Read the previous task's terminal state, error code, checkpoint, and outputs. Explain what already completed or changed before resubmitting anything.” Read-only state checks may reconnect with a bound. AI topic recognition, author mapping, PMRC, and other result-writing analyses must first confirm that the original task ended and correct its cause; retry only after user confirmation.
Improve reliability
Add one or more of these instructions:
- “Inspect state and available commands first; do not invent a command from memory.”
- “Separate facts, calculated results, inferences, and recommendations.”
- “For each conclusion, identify the supporting table, field, measure, or output file.”
- “Warn me about small samples, missing data, or ambiguous names.”
- “Read the state again and verify outputs after execution; do not merely say completed.”
- “Say uncertain when evidence is insufficient; never fabricate a value.”
- “Use a background job for long work and check its final state and error message.”
An AI explanation can sound fluent and still be wrong. Researchers should review metric meaning, name merges, topic labels, and causal claims.
When the assistant fails
Use this instead of repeatedly saying “try again”:
Stop repeating the action. First tell me:
1. whether the failure is MCP connection, SciMetrics startup, command selection, parameter validation, or file output;
2. the essential original error;
3. whether data or output was partially changed;
4. the smallest repair step.
Do not delete or overwrite anything while diagnosing.
If it chose the wrong command:
Reload the SciMetrics command catalog and search only the Dataset (or Statistics, AI, PMRC) module. Do not reuse the failed alias.
If the task is too large:
Split this into at most four verifiable stages. For each stage, give the input, action, expected output, and stop condition. Execute stage one only.
Security and data boundaries
- Connect only the
SciM.Automation.Mcpprogram supplied with a trusted SciMetrics installation. - For the first production run, request preview-before-confirmation and write outputs to a new folder.
- Never paste API keys, passwords, license-file contents, or unnecessary personal data into a chat.
- Keep human confirmation for deletes, overwrites, bulk merges, external sharing, and irreversible actions.
- Local MCP execution does not necessarily mean every conversation, file, or tool result stays local. Data handling depends on the selected AI product and organizational policy.
- MCP does not bypass SciMetrics hardware, group, or document-count authorization limits.
Advanced: the six tools behind the conversation
Most users can skip this section. It is useful for troubleshooting or exact control:
| MCP tool | Purpose |
|---|---|
scim_get_started |
First use, uncertainty about how to ask, or a quick view of the connection, data state, modules, and copy-ready prompts |
scim_get_state |
Check SciMetrics availability and current dataset/window state |
scim_list_commands |
Read the real command catalog before choosing an operation |
scim_suggest |
Recommend candidate commands from a natural-language goal |
scim_run_intent |
Run common deterministic flows such as import, open analysis, select, and export |
scim_run_command |
Run a known command with exact arguments |
The recommended verification chain is get started → state → catalog/suggestion → execute → state again → verify outputs.
Next step
- For WorkBuddy, continue to “Connect WorkBuddy with MCP.”
- For Codex or Codex in the ChatGPT desktop app, continue to “Connect Codex with MCP.”
- After setup, return here and start with a small, read-only prompt.
100 Natural-Language Examples
Search, filter, and copy research-task requests, then continue the conversation to operate SciMetrics without API or command knowledge.
100 Natural-Language Examples
This is not a command reference and does not require API knowledge. The library organizes 100 requests that can be given directly to WorkBuddy, Codex, or another AI assistant connected to SciM MCP.
Every example includes a ready-to-use request, what SciMetrics will do, useful follow-ups, an alternative wording, and the expected type of output. The examples do not invent analysis values; actual results depend on the current data and SciMetrics execution.
Open the interactive library of 100 natural-language examples
Start with the example closest to your goal, then replace its data scope, research objects, years, and output folder with your own details.
Connect WorkBuddy with MCP
Configure WorkBuddy step by step, verify the connection, operate SciMetrics in natural language, and troubleshoot failures.
Connect WorkBuddy with MCP
This page is for users who do not know APIs or programming. Setup is a one-time task. Afterward, operate SciMetrics by talking to WorkBuddy in English or Chinese.
If you are unsure how to describe a task, read the preceding “MCP Conversation Guide” first.
After connection, the simplest first message is:
Actually call scim_get_started. This is my first time using SciMetrics. Based on the current data and live capabilities, show me how I can ask for help; do not ask me for API commands or JSON.
How the connection works
Natural-language request
        ↓
WorkBuddy understands the goal and selects a scim tool
        ↓
SciM.Automation.Mcp starts or connects to SciMetrics locally
        ↓
SciMetrics imports, cleans, analyzes, visualizes, or exports
        ↓
WorkBuddy reports the result and waits for the next question or confirmation
You do not enter an Automation API URL or write JSON requests. The command setting only tells WorkBuddy where to start the SciM MCP program.
Before setup
Install SciMetrics. The default Windows folder is:
C:\Program Files (x86)\zyinsight\SciMetrics.X64Confirm that the installation contains at least:
SciM.Desktop.exe
SciM.Automation.Mcp.exe
A current package may also contain
SciM.Automation.Headless.exefor batch work without a visible window.WorkBuddy and SciMetrics must run on the same computer. The current SciM MCP is a local service, not a public URL.
Close other applications editing the same dataset and prepare a small sample for the first test.
Replace the example paths if SciMetrics is installed elsewhere.
Step 1: check the installation
Run this in Windows PowerShell:
& 'C:\Program Files (x86)\zyinsight\SciMetrics.X64\SciM.Automation.Mcp.exe' --check
--check connects to the appropriate SciMetrics host, starts it when necessary, and validates the real command catalog. A message containing “Automation API reachable” and a command count means the SciM side is ready.
If this fails, do not edit WorkBuddy yet. Check the installation, path, and local security software.
Step 2: generate the configuration
Let SciM MCP print a configuration using its actual location:
& 'C:\Program Files (x86)\zyinsight\SciMetrics.X64\SciM.Automation.Mcp.exe' --print-work-buddy-config
The result looks like this:
{
  "mcpServers": {
    "scim": {
      "command": "C:\\Program Files (x86)\\zyinsight\\SciMetrics.X64\\SciM.Automation.Mcp.exe",
      "args": []
    }
  }
}
Copy the generated output. Double backslashes (\\) are correct JSON for Windows paths.
Step 3: add it to WorkBuddy
Labels may vary between WorkBuddy versions. Prefer the interface when available:
- Open Settings → MCP.
- Select Add MCP Server or import a configuration.
- Name the server
scim. - Select a local command or STDIO transport if asked.
- Paste the generated
commandand emptyargs, save, and enable it. - Fully exit and reopen WorkBuddy so it starts a fresh MCP process.
If your version uses a file, merge the configuration into:
%USERPROFILE%\.workbuddy\mcp.json
For example:
C:\Users\<your-user-name>\.workbuddy\mcp.json
If other MCP servers already exist, add scim inside the existing mcpServers object instead of replacing the entire file:
{
  "mcpServers": {
    "existing-server": {
      "command": "...",
      "args": []
    },
    "scim": {
      "command": "C:\\Program Files (x86)\\zyinsight\\SciMetrics.X64\\SciM.Automation.Mcp.exe",
      "args": []
    }
  }
}
Check paired braces and quotes, required commas between entries, and no trailing comma after the final server.
macOS and Linux
Use a SciM MCP build published for that operating system and provide its actual path:
{
  "mcpServers": {
    "scim": {
      "command": "/Applications/SciMetrics/SciM.Automation.Mcp",
      "args": []
    }
  }
}
A typical Linux path is /opt/scimetrics/SciM.Automation.Mcp. For a framework-dependent package, use dotnet as the command and put the MCP DLL path in args. macOS and Linux normally use headless mode, and the program file needs execute permission.
Optional: desktop or headless mode
The default auto mode suits most users. It uses a running desktop when the command needs a window and can use Headless for supported background data work.
| Mode | Best for | Value |
|---|---|---|
| Automatic | Let SciM MCP choose | auto (default) |
| Desktop | Watch window changes and operate the current visualization | desktop |
| Headless | Servers and batch processing without opening a window | headless |
Add an environment setting if a fixed mode is required:
{
  "mcpServers": {
    "scim": {
      "command": "C:\\Program Files (x86)\\zyinsight\\SciMetrics.X64\\SciM.Automation.Mcp.exe",
      "args": [],
      "env": {
        "SCIM_AUTOMATION_MODE": "auto"
      }
    }
  }
}
Headless mode still enforces SciMetrics licensing. Commands that inherently require a real window must use desktop mode.
Step 4: verify in WorkBuddy
Start a new conversation and send:
Actually call the scim MCP; do not only explain the configuration.
Read the current SciMetrics state and list command modules. Do not modify any data.
If successful, tell me the execution mode and the tasks available in each module.
Success means:
- WorkBuddy shows or reports a
scimtool call; - it returns actual SciMetrics state, not a generic explanation;
- it can list modules such as Dataset, Statistics, AnalysisAndVisualization, Index, AI, PMRC, and Jobs.
Some versions ask for approval on the first tool call. Verify that the tool comes from the configured scim service before allowing it.
How to ask in WorkBuddy
You do not need API names. Put three rules in the first task: use SciMetrics MCP, ask for missing critical inputs, and verify after execution.
Use scim MCP for this task. Inspect state and the current command catalog instead of guessing.
Ask me if a required file path, year range, or output destination is missing. Wait for confirmation before deletion, overwrite, or bulk merge.
After execution, check the state and output files again and summarize the result in a table.
Start from a vague idea
I want to understand the main research directions in this literature set, but I do not know whether to use co-word networks, topic clustering, or AI topic recognition.
Read the current dataset summary and compare the input needs, suitable questions, and limitations of the three methods. Propose a plan only; do not execute it yet.
This works better than “analyze this” because WorkBuddy must inspect the data before recommending a method.
Import a file
Use SciMetrics MCP to import D:\Research\Input\wos.txt.
The source is Web of Science and the period is 2019-2025.
Find a compatible import filter. If several match, show the differences and let me choose.
After import, perform quality checks only; do not clean or visualize yet.
Clean institution names
Inspect possible variants of the same institution in the current Affiliation table.
First return candidate pairs, affected record counts, and reasons. Do not edit immediately.
Apply only the merges I approve, then compare institution counts before and after.
Create and style a network
Build an author collaboration network for the current data. Recommend a reasonable filter threshold and explain why.
After generation, use a white background, hide isolated nodes, limit labels to 30 characters, and use an available force-directed layout.
Export an SVG to D:\Research\Output\author-network.svg and verify that the file exists.
Interpret a result
Interpret this visualization using the actual SciMetrics output.
Separate directly visible or calculated facts from possible research implications.
For each statement, name the supporting measure or node, and do not turn collaboration into a causal claim.
Export SciMetrics cluster hulls to SVG
Run the built-in SciMetrics cluster operation on the current network, then apply solid node colors by cluster.
Enable convex hulls using each node's SciM Cluster integer as the only membership source. Do not regroup nodes by color or spatial distance.
Export D:\Research\Output\cluster-network.svg with includeClusterHulls=true.
Verify that the SVG contains cluster-hull, SciM.Cluster, and a data-cluster-id for each exported hull.
All network-hull entry points use the same cycle: Off (None), Natural Smooth (Natural), Concave/Organic, Convex, then Off. MCP/API callers can select a mode exactly with visual.set_graph_style and convexMode, or call visual.graph_action with natural, organic/concave, or the corresponding ...hull alias. On export, includeClusterHulls=true forces the first active mode, Natural; omit the field to preserve a previously selected Organic or Convex mode. The right-side Minimum Hull Nodes slider defaults to 3 and accepts 2–5. Set it to 2 to draw a two-node cluster as a round-ended capsule; at the default 3, two-node clusters are omitted. Eligible clusters with three or more distinct positions produce a closed hull, while single-node clusters are never drawn. The border uses a slightly darker shade of the solid node color. Color styles the outline but never replaces the SciM cluster ID.
Adjust AI topic distribution hulls
Use the scim MCP on the currently open AI Emerging Topic or AI Topic Competition Distribution view.
Keep the existing AI topic membership; do not regroup by color or distance and do not split topics.
Set Organic topic hulls and minimum topic hull nodes to 2, then export the distribution page to SVG and verify the file.
AI topic views use the separate topicHullMode and topicHullMinNodeCount controls. The minimum defaults to 3 and accepts 2–5; value 2 enables round-ended two-node capsules, while single-node topics never draw a hull. Screen and SVG use the same no-overshoot rounded boundary, dynamic padding, and darker border. The corresponding AI topic Desktop window must already be open.
Run cross-fusion evolution
Actually use the scim MCP to calculate cross-fusion evolution by AI topic for checked documents.
Require at least 2 documents per node and 2 shared documents per edge; open the window at the latest year.
Explain document fusion rate, network fusion breadth, and cumulative fusion index. Save the complete result and latest-year Excel under D:\Research\Output, then read state again and verify both files.
WorkBuddy discovers analysis.cross_fusion from the live catalog; users do not need the command name. Follow up with “switch to 2022,” “show cluster hulls,” “export current SVG,” or “save the native .crossfusion file.” See the Cross-Fusion Evolution page for parameters and Desktop/Headless differences.
Long jobs and progress
This may be a long task. If supported, run it as a background job.
Return the jobId and poll its state. Say complete only after the state is succeeded and outputs are verified.
On failure, preserve the error and do not automatically resubmit the entire job.
Tools WorkBuddy can use
| Tool | Purpose | Natural-language request |
|---|---|---|
scim_get_started |
Check the connection and return what is available now plus copy-ready prompts | “This is my first use; call scim_get_started and guide me” |
scim_get_state |
Read current state | “Check SciMetrics state first” |
scim_list_commands |
Read the real catalog | “Show the analyses available now” |
scim_suggest |
Recommend commands from a goal | “I do not know the command; recommend one” |
scim_run_intent |
Run common natural-language workflows | “Import, then open an institution network” |
scim_run_command |
Execute a known exact command | “Run the confirmed command with these parameters” |
When WorkBuddy displays call details, most users only need to check the scim server name, file paths, and whether write/delete actions match the request.
Troubleshooting
| Symptom | What to do |
|---|---|
scim does not appear |
Enable MCP, validate JSON, verify the full command path, then fully restart WorkBuddy |
| Configuration fails to save | Windows JSON paths need \\; check commas and quotes; regenerate with --print-work-buddy-config |
--check works but the chat uses no tool |
Start a new chat, explicitly request an actual scim call, check tool permission, and restart WorkBuddy |
| MCP executable not found | The default path includes (x86); locate the EXE and copy its full path |
| SciMetrics does not start | Ensure MCP, Desktop, and Headless belong to the same package; start Desktop manually and retry |
| Local Automation API connection fails | Run --check; make sure ports 37618/37619 are not occupied or blocked locally |
| Handshake times out | Upgrade SciM MCP, make sure the path is not an old copy, and restart WorkBuddy |
| Command or parameter is rejected | Ask WorkBuddy to reload scim_list_commands instead of relying on an old chat |
| No output file appears | Use an absolute path and ask it to verify the parent folder, format, permission, and file existence |
| Large task times out | Use a background job and query it with jobs.get; do not resubmit until its state is known |
Logs are stored in the log folder beside the MCP program, with names such as scim-automation-mcp-20260714.log. When contacting support, provide the failure time, short error, and correlation ID after checking that the log contains no information that should not be shared.
Security
- Enable only trusted MCP servers and disable
scimtemporarily when it is not needed. - Request a preview before the first merge, deletion, or overwrite on production data.
- Do not put API keys, passwords, or license-file contents in
mcp.jsonor a chat. The local SciM connection does not need them. - Follow organizational rules for cloud AI, personal information, and unpublished research data.
- MCP is an operation channel, not a license bypass. All SciMetrics authorization limits remain active.
References
- Official WorkBuddy MCP guide
SciM.Automation.Mcp.exe --helpin the installed package
Connect Codex with MCP
Connect local SciM MCP to Codex in ChatGPT and combine software operations, files, verification, and reproducible reporting.
Connect Codex (ChatGPT) with MCP
Codex can call SciMetrics while also working with approved local files. It is especially useful for cross-application workflows such as “import data → run analysis → verify exports → organize scripts and report materials.” Daily users describe the goal and do not need to learn the SciMetrics Automation API.
If you are unsure how to phrase a task, read the preceding “MCP Conversation Guide” first.
After connection, the simplest first message is:
Actually call scim_get_started. This is my first time using SciMetrics. Read the current state and give me ready-to-use questions; do not only explain setup or ask me for API commands or JSON.
Codex is not the same as an ordinary ChatGPT web chat
| Entry point | Can launch local SciM.Automation.Mcp.exe directly? |
Notes |
|---|---|---|
| Codex in the ChatGPT desktop app / local Codex task | Yes | Uses local MCP configuration and workspace permissions |
| Codex CLI | Yes | Uses ~/.codex/config.toml |
| Codex IDE extension | Yes | Add a local STDIO server from MCP Servers |
| Ordinary ChatGPT web chat | No local EXE path | ChatGPT custom MCP connects to a remote server; a private local server needs a secure tunnel or separately deployed remote bridge |
The local setup on this page applies to Codex. It does not automatically make SciM tools appear in every ordinary ChatGPT web conversation.
How the integration works
User describes the research goal and files to Codex
        ↓
Codex checks the workspace and scim MCP tools
        ↓
SciM.Automation.Mcp selects Desktop or Headless locally
        ↓
SciMetrics performs deterministic import, analysis, visualization, and export
        ↓
Codex verifies files, organizes logs/scripts/reports, and returns evidence
Codex uses file tools for approved workspace files and calls scim only for SciMetrics calculations or interface operations. Combining the two is more capable than simple menu automation.
Before setup
Install SciMetrics. The default Windows folder is:
C:\Program Files (x86)\zyinsight\SciMetrics.X64Confirm that
SciM.Automation.Mcp.exeandSciM.Desktop.exeare installed. Current packages normally also includeSciM.Automation.Headless.exe.Codex and SciMetrics should run on the same computer.
Select a dedicated Codex workspace such as
D:\Research\MyProject; place inputs and output folders there or explicitly authorize the required paths.Test with a small sample instead of the only copy of production data.
Step 1: check SciM MCP
Run in PowerShell:
& 'C:\Program Files (x86)\zyinsight\SciMetrics.X64\SciM.Automation.Mcp.exe' --check
It starts or connects to the appropriate SciMetrics host and validates the command catalog. “Automation API reachable” plus a command count means the SciM side works.
You can also inspect help and version:
& 'C:\Program Files (x86)\zyinsight\SciMetrics.X64\SciM.Automation.Mcp.exe' --help
& 'C:\Program Files (x86)\zyinsight\SciMetrics.X64\SciM.Automation.Mcp.exe' --version
Step 2: generate the Codex configuration
Run:
& 'C:\Program Files (x86)\zyinsight\SciMetrics.X64\SciM.Automation.Mcp.exe' --print-codex-config
The output looks like:
[mcp_servers.scim]
command = 'C:\Program Files (x86)\zyinsight\SciMetrics.X64\SciM.Automation.Mcp.exe'
startup_timeout_sec = 30
Windows backslashes do not need duplication inside TOML single quotes. Copying the generated snippet avoids path mistakes.
Step 3: add it to Codex
Method A: desktop app or IDE interface
- Open MCP Servers in settings.
- Select Add server.
- Use the name
scimand select STDIO. - Enter the full
SciM.Automation.Mcp.exepath as Command and leave Args empty. - Save, then restart Codex or the IDE extension when prompted.
Labels may change between versions. The essential setting is a local STDIO server named scim, not an HTTP URL.
Method B: configuration file
Open:
C:\Users\<your-user-name>\.codex\config.toml
Add the generated snippet:
[mcp_servers.scim]
command = 'C:\Program Files (x86)\zyinsight\SciMetrics.X64\SciM.Automation.Mcp.exe'
startup_timeout_sec = 30
If other [mcp_servers.xxx] sections exist, add scim as a new section without deleting them or creating a duplicate scim section.
Method C: Codex CLI
Codex CLI supports codex mcp add for STDIO servers and codex mcp list for inspection. On Windows, the installation path contains spaces and parentheses, so copying the generated config.toml snippet is often less error-prone than shell quoting.
macOS and Linux
Use the executable published for that operating system:
[mcp_servers.scim]
command = '/Applications/SciMetrics/SciM.Automation.Mcp'
startup_timeout_sec = 30
Linux example:
[mcp_servers.scim]
command = '/opt/scimetrics/SciM.Automation.Mcp'
startup_timeout_sec = 30
For a framework-dependent package:
[mcp_servers.scim]
command = 'dotnet'
args = ['/opt/scimetrics/SciM.Automation.Mcp.dll']
startup_timeout_sec = 30
The executable needs execute permission. macOS and Linux normally use Headless; actions requiring a real desktop window are available only on supported desktop platforms.
Optional: fix the execution mode
The default auto mode reuses a running Desktop when it supports the required command and otherwise uses Headless for supported non-UI work.
[mcp_servers.scim]
command = 'C:\Program Files (x86)\zyinsight\SciMetrics.X64\SciM.Automation.Mcp.exe'
startup_timeout_sec = 30

[mcp_servers.scim.env]
SCIM_AUTOMATION_MODE = 'auto'
Use desktop to require visible windows or headless to prevent Desktop from opening. Headless enforces the same hardware, group, and document-count authorization.
Step 4: restart and verify
After changing configuration or replacing the MCP program, fully exit Codex, reopen it, and start a new task. An old task may retain an initial handshake failure.
Verification options:
- Codex CLI: run
codex mcp list; use/mcpin the interactive interface. - Codex desktop/IDE: open MCP Servers and confirm that
scimis enabled or connected. - Any local Codex task: explicitly ask it to read
scimstate.
Test prompt:
Actually call scim MCP; do not only read project files or explain the configuration.
Read the SciMetrics state and list available commands by module. Do not modify data.
Tell me whether the connection works, which mode is active, which tasks can run headlessly, and which require a desktop window.
Recommended first instruction for a task
Put this at the start of a complex request:
Whenever this task involves SciMetrics, use scim MCP. Read the current state and real command catalog before execution; never invent commands or parameters from memory.
Process local files only in the current workspace and paths I explicitly provide. Preserve source inputs and do not overwrite them.
Ask for missing information that would change the result. Wait for confirmation before deletion, overwrite, bulk merge, or external data sharing.
Verify state and outputs after every stage. In the final report, list actual SciMetrics commands, key parameters, output files, quality checks, and incomplete items.
Tasks that benefit from Codex
Combine SciMetrics with local file organization
The workspace is D:\Research\ProjectA.
Inspect file types and sizes in input without changing originals. Then use scim MCP to choose an import method and keep only 2018-2025 records.
After import, run quality checks and write reports\import-check.md.
If imported counts differ unexpectedly from the source, stop and explain instead of continuing.
Ask Codex to design the method first
My question is: which institutions are becoming new collaboration hubs in deep geothermal research?
Inspect the current SciMetrics fields and time coverage, then propose an analysis plan with no more than four stages.
For each stage, state the SciMetrics capability, filter, output, and limitation. Do not execute until I confirm the plan.
Turn a conversation into a reproducible workflow
Execute the approved plan. After each stage, append timestamp, input, actual command, parameters, result summary, and verification state to workflow-log.md.
Put exported tables in output\tables and SVG files in output\figures.
Finally verify every file referenced by the log and list the minimum inputs needed to repeat the workflow.
Test a small sample first
Validate the AI topic-recognition workflow on at most 50 records while preserving the original data.
Report model configuration, processing scope, output structure, and failures.
Do not submit the full dataset as a background job until I explicitly say “start the production run.”
Operate the current visualization
Read the current SciMetrics window and graph state.
If an author collaboration network is open, set a white background, hide isolated nodes, show the legend, and limit labels to 30 characters.
Record the settings before changing them, then export SVG and Excel versions and verify both files.
If the current window is not a network, do not change another window; tell me first.
For an SVG with cluster hulls, Codex can make one explicit call:
{
  "command": "visual.export_window",
  "args": {
    "path": "D:\\Research\\Output\\cluster-network.svg",
    "format": "svg",
    "includeClusterHulls": true
  }
}
includeClusterHulls=true forces the first active mode in the cycle, Natural. To preserve Organic or Convex, Codex should first set convexMode with visual.set_graph_style, then omit includeClusterHulls when exporting. Hull membership reads only the SciM Cluster integer on each node. convexHullMinNodeCount defaults to 3 and accepts 2–5; set it to 2 to export a two-node cluster as a round-ended capsule, while the default omits two-node clusters. Eligible clusters with three or more distinct positions export as smooth closed outlines, and single-node clusters produce no hull. Solid node color styles the hull and its border uses a slightly darker shade. Codex must not infer groups from SVG color or coordinates. Exported hull elements contain data-grouping-source="SciM.Cluster" and data-cluster-id for review.
AI Emerging Topic and AI Topic Competition Distribution views use a separate deterministic option set:
{
  "command": "visual.set_ai_topic_visual_options",
  "args": {
    "view": "distribution",
    "topicHullMode": "organic",
    "topicHullMinNodeCount": 2
  }
}
In cycle order, topicHullMode accepts none, natural, organic, and convex; natural is an independent Natural Smooth effect rather than an Organic alias. The toolbar cycles Off, Natural Smooth, Organic, Convex, then Off. The minimum defaults to 3 and accepts 2–5; value 2 enables round-ended two-node topic capsules, while single-node topics never draw a hull. The setting preserves existing AI topic membership and affects both screen and SVG rendering. Codex should first confirm that the target AI topic Desktop window is open, then set and export it.
Cross-fusion also works as a natural-language workflow:
Call scim MCP and calculate cross-fusion by Class2 with node threshold 3 and edge threshold 2, using checked data only.
Save the complete .crossfusion file, export 2024 Excel, and switch the Desktop graph to 2024 with cluster hulls visible. Verify state and all requested outputs.
Codex should let commands.plan produce the analysis.cross_fusion workflow, then use visual.get_cross_fusion_state, visual.set_cross_fusion_options, and visual.export_cross_fusion as needed. See the Cross-Fusion Evolution page for full parameters and direct API examples.
Generate a report without overstating findings
Read this run's SciMetrics outputs and workflow-log.md, then create reports\findings.md.
Use five sections: data and method, calculated results, interpretation, limitations, and items requiring review.
Every number must trace to an exported table or tool result. Mark inference as interpretation and do not turn association into causation.
When you do not know the command
I do not know which SciMetrics command to use. Follow this sequence:
1. scim_get_state;
2. scim_list_commands, limited to relevant modules;
3. scim_suggest if necessary;
4. show the proposed command and critical parameters;
5. wait for confirmation before a write action;
6. read state again and verify files after execution.

My goal is: <write the research question here>.
This does not require API knowledge. It only tells Codex to discover first, execute second, and verify last.
The six SciM MCP tools
| Tool | When Codex should use it |
|---|---|
scim_get_started |
First use, uncertainty about how to ask, or a quick view of the connection, current data, modules, and ready-to-copy prompts |
scim_get_state |
Before work, after a stage, and after an error |
scim_list_commands |
Find commands actually supported by the installed version and filter by module |
scim_suggest |
Recommend candidates when the user supplied a goal but not a method |
scim_run_intent |
Run common deterministic workflows such as import, open analysis, select, and export |
scim_run_command |
Run a known exact command for strict control and reproducibility |
Modules include System, Application, Dataset, Statistics, AnalysisAndVisualization, Index, AI, PMRC, TeamRecognition, and Jobs. Treat the catalog returned by the current installation as authoritative.
Long work: background jobs and verification
Imports, large AI analyses, and PMRC recognition can take time. Prefer background jobs to simply increasing timeouts:
If the command supports runInBackground, submit it in the background and retain the jobId.
Use jobs.get to read state, progress, percent, and message; do not submit the same task twice.
Mark it complete only when state is succeeded, the result is valid, and destination files exist.
If failed or cancelled, report the final state and correlation ID without deleting intermediate outputs automatically.
Troubleshooting
| Symptom | Checks |
|---|---|
No scim in Codex |
Run codex mcp list; check section name, full path, and enabled state; fully restart and create a new task |
timed out handshaking with MCP server |
Confirm that the path targets a current SciM MCP with JSONL support, not an old copy; run --version and --check; restart Codex |
| Configuration parse error | Use [mcp_servers.scim], single quotes around Windows paths, and only one section with that name |
| EXE runs manually but Codex cannot start it | The complete path with spaces and (x86) must be one command value; use --print-codex-config output |
--check works but an old task has no tool |
The task may cache the initial failure; fully exit Codex and start a new task |
| SciMetrics does not start | Confirm that MCP, Desktop, and Headless are from the same package; start Desktop manually and retry |
| Automation API connection fails | Check local ports 37618/37619, processes, and security software; do not change the endpoint to a public IP |
| Codex invents a command | Require a fresh scim_list_commands call limited to the relevant module |
| Codex says complete but no result exists | Require absolute-path, file-size, and modification-time checks plus a fresh SciMetrics state read |
| File permission denied | Keep output inside the approved Codex workspace or select a newly approved output folder |
| Long task times out | Query the background job instead of rerunning; use the log correlation ID for diagnosis |
SciM MCP logs are stored beside the program under log\scim-automation-mcp-YYYYMMDD.log and retained for 14 days by default. Common secret forms are redacted, but review logs before sharing them.
Security boundaries
- Codex may modify local files and call SciMetrics in one task. Preserve source inputs, use a new output folder, and review file changes before delivery.
- Keep human confirmation for overwrite, deletion, bulk update, name merge, and external sharing.
- Do not put keys, passwords, or license-file contents in prompts, configuration, or operation logs.
- SciM MCP talks to a local SciMetrics host. Do not expose local ports directly to the internet merely to connect an ordinary ChatGPT web chat.
- ChatGPT/Codex data handling and retention depend on the selected plan and organization policy. Treat sensitive data accordingly.
- MCP does not bypass SciMetrics hardware, group, or document-count licensing.
Official references
Live Automation Command Reference
Version-synchronized Desktop and Headless command counts, modules, aliases, and canonical command names generated from the actual registries.
SciM Automation Command Reference
This page is generated from the real SciM Desktop and Headless command registries. After an upgrade, use this page and the live scim_list_commands result instead of guessing from an old prompt.
For ordinary users, the recommended interface is natural-language operation through an MCP client such as WorkBuddy or Codex. Start with scim_get_started to inspect the connection, current data, and available analyses, then describe the research question. Users do not need to memorize Automation API command names or write JSON.
MCP conversational closed loop
When connecting for the first time, or when the user does not know how to ask, WorkBuddy or Codex should call scim_get_started first. It returns the active host, dataset state, live command modules, and ready-to-copy prompts. After receiving a goal, the assistant reads app.get_state and the live catalog, asking only for missing research inputs such as a file path, output location, or analysis scope—not API names.
The assistant should explain the proposed steps using commands.plan or live command suggestions and wait for confirmation before writes, overwrites, or deletes. When a long operation returns a jobId, poll jobs.get to a terminal state and use jobs.list to summarize parallel children. Report completion only after the task succeeds, failed batches are zero, and output files are verified.
Recommended sequence: scim_get_started → describe the research question → inspect state and commands → supply missing essentials → confirm writes → execute → wait for background tasks → verify results.
Unified Task Protocol V2
UI actions, MCP, the Automation API, and Headless use one task-record format. After a long operation returns a jobId, WorkBuddy or Codex can keep calling jobs.get and report progress in plain language. Records survive SciM or Headless restarts. If the process exits during execution, the recovered task becomes failed / process_interrupted instead of remaining stuck in Running.
A V2 record includes source, redacted arguments, dataset and model metadata, progress and checkpoint, structured errors, result, discovered output files in outputs, retry lineage through retryOfJobId, and parent/batch relationships through parentJobId. API keys, tokens, passwords, and similar values are replaced with [REDACTED]; a task whose arguments were redacted is not offered for automatic retry because the original secret is no longer available.
After process_interrupted, an API error, or a partial failure, the MCP assistant should read the original task, checkpoint, and outputs; explain what already completed or changed; and propose the smallest repair. Read-only state checks may reconnect with a bound, but AI recognition, author mapping, PMRC, and other result-writing commands must not be resubmitted until the original terminal state is known.
Parallel Agent batches for AI topic recognition, AI author mapping, and PMRC appear as child tasks under the main task. This exposes both overall progress and the exact batch that failed. Treat canCancel and canRetry as the server capabilities instead of inferring available actions from status text.
Reusable prompt:
Start AI topic recognition as a background task. After receiving the task id, keep checking its state. Report how many parallel child batches it created, which batch failed, and where the final outputs were written. Do not merely say that processing is in progress.
This section is generated from the real Desktop and Headless command registries. Do not edit it manually.
| Host | Total names | Canonical commands | Aliases | Modules |
|---|---|---|---|---|
| Desktop | 160 | 112 | 48 | 10 |
| Headless | 123 | 92 | 31 | 10 |
Desktop command catalog
| Order | Module | Canonical | Aliases | Canonical command names |
|---|---|---|---|---|
| 0 | System | 5 | 0 | commands.batch commands.list commands.plan commands.run_intent commands.suggest |
| 10 | Application | 8 | 0 | app.accept_first_launch_disclaimer app.activate_window app.close_windows app.exit app.get_state app.get_windows app.ping app.wait |
| 20 | Dataset | 18 | 0 | dataset.clear_document_selection dataset.export_dictionary dataset.export_table_excel dataset.get_related_rows dataset.get_summary dataset.get_table dataset.get_view_state dataset.import_text dataset.list_import_filters dataset.open dataset.save dataset.search dataset.select_all_documents dataset.select_documents dataset.set_active_table dataset.set_ai_topics dataset.set_checked_rows dataset.update_rows |
| 30 | Statistics | 4 | 0 | statistics.export_combined statistics.export_grouped statistics.export_matrix statistics.export_smart |
| 40 | AnalysisAndVisualization | 39 | 23 | analysis.cross_fusion visual.ai_topic_visual_action visual.clear_selection visual.control_window visual.export_ai_emerging_topic_map visual.export_ai_topic_competition_distribution_map visual.export_ai_topic_competitiveness visual.export_ai_topic_sankey visual.export_ai_topic_visual_window visual.export_cross_fusion visual.export_window visual.get_ai_topic_visual_state visual.get_cross_fusion_state visual.get_graph_style visual.get_nodes visual.get_temporal_graph_state visual.get_window_state visual.graph_action visual.open_ai_emerging_topic_map visual.open_ai_topic_competition_distribution_map visual.open_ai_topic_competitiveness visual.open_ai_topic_sankey visual.open_breakthrough_analysis visual.open_citation_analysis visual.open_cluster_analysis visual.open_cocitation_analysis visual.open_correspondence_analysis visual.open_cross_fusion visual.open_evolution_analysis visual.open_matrix_analysis visual.open_network_analysis visual.open_window_file visual.select_nodes visual.set_ai_topic_visual_options visual.set_cross_fusion_options visual.set_graph_slider visual.set_graph_style visual.set_temporal_graph_options visual.update_selected_nodes |
| 50 | Index | 6 | 0 | index.export_ai_topic_competitiveness index.export_ai_topic_development index.export_esi_model index.export_influence index.export_international_collaboration index.open_esi_model_heatmap |
| 60 | AI | 8 | 10 | ai.get_models ai.get_settings ai.group_documents ai.group_entities ai.map_authors ai.preflight ai.recognize_document_topics ai.save_settings |
| 65 | TeamRecognition | 5 | 2 | team.export team.get_results team.get_state team.open_window team.recognize |
| 70 | PMRC | 16 | 10 | pmrc.delete_results pmrc.export pmrc.export_dictionary pmrc.get_labels pmrc.get_results pmrc.get_state pmrc.get_visual_state pmrc.import_dictionary pmrc.normalize_labels pmrc.open_window pmrc.recognize pmrc.set_label_checks pmrc.set_results pmrc.set_result_checks pmrc.set_visual_options pmrc.visual_action |
| 80 | Jobs | 3 | 3 | jobs.cancel jobs.get jobs.list |
Aliases: index.cross_fusion → analysis.cross_fusion, visual.ai_topic_action → visual.ai_topic_visual_action, visual.ai_topic_export → visual.export_ai_topic_visual_window, visual.ai_topic_options → visual.set_ai_topic_visual_options, visual.ai_topic_state → visual.get_ai_topic_visual_state, visual.cross_fusion_export → visual.export_cross_fusion, visual.cross_fusion_options → visual.set_cross_fusion_options, visual.cross_fusion_state → visual.get_cross_fusion_state, visual.export_ai_topic_competitiveness_map → visual.export_ai_topic_competition_distribution_map, visual.export_ai_topic_emerging → visual.export_ai_emerging_topic_map, visual.open_ai_topic_competition_map → visual.open_ai_topic_competition_distribution_map, visual.open_ai_topic_emerging → visual.open_ai_emerging_topic_map, visual.open_breakthrough → visual.open_breakthrough_analysis, visual.open_citation → visual.open_citation_analysis, visual.open_cluster → visual.open_cluster_analysis, visual.open_cocitation → visual.open_cocitation_analysis, visual.open_correspondence → visual.open_correspondence_analysis, visual.open_evolution → visual.open_evolution_analysis, visual.open_matrix → visual.open_matrix_analysis, visual.open_network → visual.open_network_analysis, visual.temporal_options → visual.set_temporal_graph_options, visual.temporal_state → visual.get_temporal_graph_state, visual.update_subnet_nodes → visual.update_selected_nodes, ai.author_mapping → ai.map_authors, ai.configure → ai.save_settings, ai.document_grouping → ai.group_documents, ai.entity_grouping → ai.group_entities, ai.group_docs → ai.group_documents, ai.group_entity → ai.group_entities, ai.models → ai.get_models, ai.recognize_topics → ai.recognize_document_topics, ai.settings → ai.get_settings, ai.topic_recognition → ai.recognize_document_topics, team.results → team.get_results, team.run → team.recognize, pmrc.action → pmrc.visual_action, pmrc.check_labels → pmrc.set_label_checks, pmrc.check_results → pmrc.set_result_checks, pmrc.labels → pmrc.get_labels, pmrc.normalize → pmrc.normalize_labels, pmrc.open → pmrc.open_window, pmrc.results → pmrc.get_results, pmrc.state → pmrc.get_state, pmrc.visual_options → pmrc.set_visual_options, pmrc.visual_state → pmrc.get_visual_state, job.cancel → jobs.cancel, job.get → jobs.get, job.list → jobs.list
Headless command catalog
| Order | Module | Canonical | Aliases | Canonical command names |
|---|---|---|---|---|
| 0 | System | 5 | 0 | commands.batch commands.list commands.plan commands.run_intent commands.suggest |
| 10 | Application | 3 | 0 | app.get_state app.ping app.wait |
| 20 | Dataset | 20 | 0 | dataset.clear_document_selection dataset.close dataset.export_dictionary dataset.export_table_excel dataset.get_related_rows dataset.get_summary dataset.get_table dataset.get_tables dataset.get_view_state dataset.import_text dataset.list_import_filters dataset.open dataset.save dataset.search dataset.select_all_documents dataset.select_documents dataset.set_active_table dataset.set_ai_topics dataset.set_checked_rows dataset.update_rows |
| 30 | Statistics | 4 | 0 | statistics.export_combined statistics.export_grouped statistics.export_matrix statistics.export_smart |
| 40 | AnalysisAndVisualization | 30 | 24 | analysis.ai_emerging_topics analysis.ai_topic_competition_distribution analysis.ai_topic_competitiveness analysis.ai_topic_sankey analysis.breakthrough analysis.cross_fusion analysis.evolution analysis.export_last_visualization analysis.network visual.clear_selection visual.control_window visual.export_cross_fusion visual.get_cross_fusion_state visual.get_graph_style visual.get_nodes visual.get_temporal_graph_state visual.get_window_state visual.graph_action visual.open_citation_analysis visual.open_cluster_analysis visual.open_cocitation_analysis visual.open_correspondence_analysis visual.open_cross_fusion visual.open_matrix_analysis visual.select_nodes visual.set_cross_fusion_options visual.set_graph_slider visual.set_graph_style visual.set_temporal_graph_options visual.update_selected_nodes |
| 50 | Index | 6 | 0 | index.export_ai_topic_competitiveness index.export_ai_topic_development index.export_esi_model index.export_influence index.export_international_collaboration index.open_esi_model_heatmap |
| 60 | AI | 8 | 4 | ai.get_models ai.get_settings ai.group_documents ai.group_entities ai.map_authors ai.preflight ai.recognize_document_topics ai.save_settings |
| 65 | TeamRecognition | 5 | 1 | team.export team.get_results team.get_state team.open_window team.recognize |
| 70 | PMRC | 8 | 2 | pmrc.delete_results pmrc.export pmrc.export_dictionary pmrc.get_results pmrc.get_state pmrc.import_dictionary pmrc.recognize pmrc.set_results |
| 80 | Jobs | 3 | 0 | jobs.cancel jobs.get jobs.list |
Aliases: index.cross_fusion → analysis.cross_fusion, visual.cross_fusion_export → visual.export_cross_fusion, visual.cross_fusion_options → visual.set_cross_fusion_options, visual.cross_fusion_state → visual.get_cross_fusion_state, visual.export_ai_emerging_topic_map → analysis.ai_emerging_topics, visual.export_ai_topic_competition_distribution_map → analysis.ai_topic_competition_distribution, visual.export_ai_topic_competitiveness → analysis.ai_topic_competitiveness, visual.export_ai_topic_competitiveness_map → analysis.ai_topic_competition_distribution, visual.export_ai_topic_sankey → analysis.ai_topic_sankey, visual.export_window → analysis.export_last_visualization, visual.open_ai_emerging_topic_map → analysis.ai_emerging_topics, visual.open_ai_topic_competition_distribution_map → analysis.ai_topic_competition_distribution, visual.open_ai_topic_competition_map → analysis.ai_topic_competition_distribution, visual.open_ai_topic_competitiveness → analysis.ai_topic_competitiveness, visual.open_ai_topic_sankey → analysis.ai_topic_sankey, visual.open_breakthrough → analysis.breakthrough, visual.open_breakthrough_analysis → analysis.breakthrough, visual.open_cluster → visual.open_cluster_analysis, visual.open_evolution → analysis.evolution, visual.open_evolution_analysis → analysis.evolution, visual.open_matrix → visual.open_matrix_analysis, visual.open_network → analysis.network, visual.open_network_analysis → analysis.network, visual.update_subnet_nodes → visual.update_selected_nodes, ai.author_mapping → ai.map_authors, ai.document_grouping → ai.group_documents, ai.entity_grouping → ai.group_entities, ai.topic_recognition → ai.recognize_document_topics, team.run → team.recognize, pmrc.results → pmrc.get_results, pmrc.state → pmrc.get_state
Auto-routing canonical coverage
auto routes each request to a compatible local host. Counts below use canonical command names; the union is the documented auto-routing surface.
| Module | Desktop | Headless | Shared | Auto union |
|---|---|---|---|---|
| System | 5 | 5 | 5 | 5 |
| Application | 8 | 3 | 3 | 8 |
| Dataset | 18 | 20 | 18 | 20 |
| Statistics | 4 | 4 | 4 | 4 |
| AnalysisAndVisualization | 39 | 30 | 22 | 47 |
| Index | 6 | 6 | 6 | 6 |
| AI | 8 | 8 | 8 | 8 |
| TeamRecognition | 5 | 5 | 5 | 5 |
| PMRC | 16 | 8 | 8 | 16 |
| Jobs | 3 | 3 | 3 | 3 |
Subject Cross-Fusion
Calculate subject, technical-classification, or AI-topic cross-fusion through the UI, MCP, or Automation API; read yearly overviews, networks, nodes, relations, evidence documents, and export results for subject service reports.
Subject Cross-Fusion User Guide
Subject cross-fusion shows how disciplines, technical classifications, or AI topics co-occur in the same set of documents and how their relationships appear, strengthen, weaken, or recover over time. SciMetrics performs the deterministic calculation from the active dataset; this documentation explains the UI workflow, indicators, evidence review, and MCP/API operation path.
The examples on this page use the dataset Hot Dry Rock Topic Identification - Level 3/4 Topics.db and calculate by AITopic. In real projects, you may also use Class1, Class2, Class3, or Class4 when those fields actually contain disciplinary categories, technical categories, research-direction categories, or manually curated topic levels.
When to use it
- Identify cross-disciplinary collaboration opportunities for colleges or research management teams.
- Provide evidence for emerging interdisciplinary directions, platform planning, and joint project design.
- Add "which topics are connecting" and "which connections are strengthening" to subject service reports.
- Discover clues about method transfer, shared research problems, and application diffusion.
Data preparation and dimension selection
Open a curated SciMetrics database, or first import literature records from Web of Science, Scopus, CNKI, Excel, or other sources. Cross-fusion analysis requires each document to be linked to at least one topic or classification label. If one document is linked to multiple labels, those labels may form fusion relations.
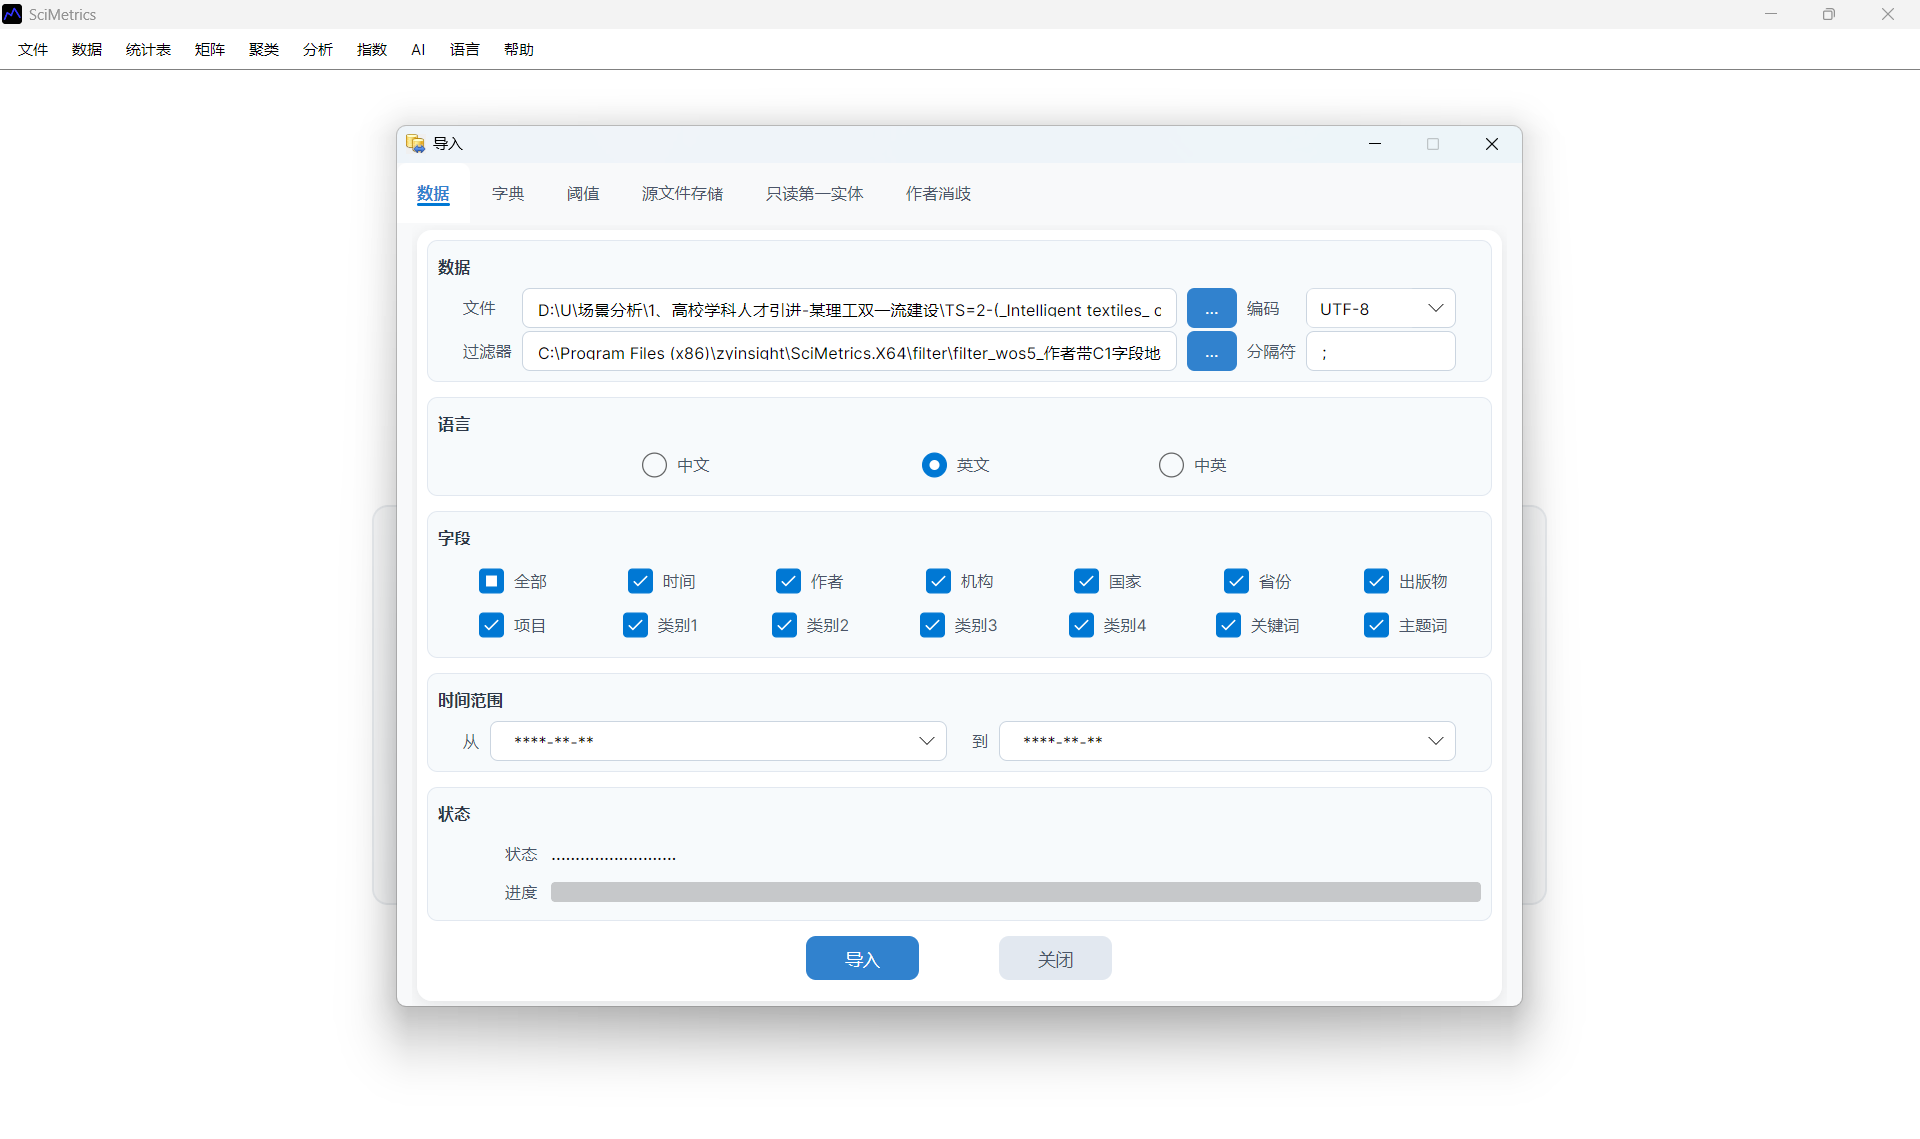
| Dimension | Meaning | Recommended use |
|---|---|---|
Class1-Class4 |
Level 1 to level 4 classification fields in the dataset | Usually used for disciplinary categories, technical categories, research directions, or manually curated topic levels. The meaning depends on how the dataset was curated. |
AITopic |
AI topic identification result | Use it after AI topic identification when you want to inspect fusion among AI topics. |
| Checked documents | Current filtered document scope | Use it after limiting the dataset to a college, team, year range, or topic subset. |
In the sample dataset, Class3 contains only a few broad categories, and Class4 is actually a document type field. Therefore, this guide uses AITopic for interpretation. Before using Class1-Class4, inspect what the fields really contain. If they store disciplinary or technical categories, they can be used directly for subject cross-fusion. If they store document types, source types, or overly broad buckets, they should not be interpreted as topic-fusion results.
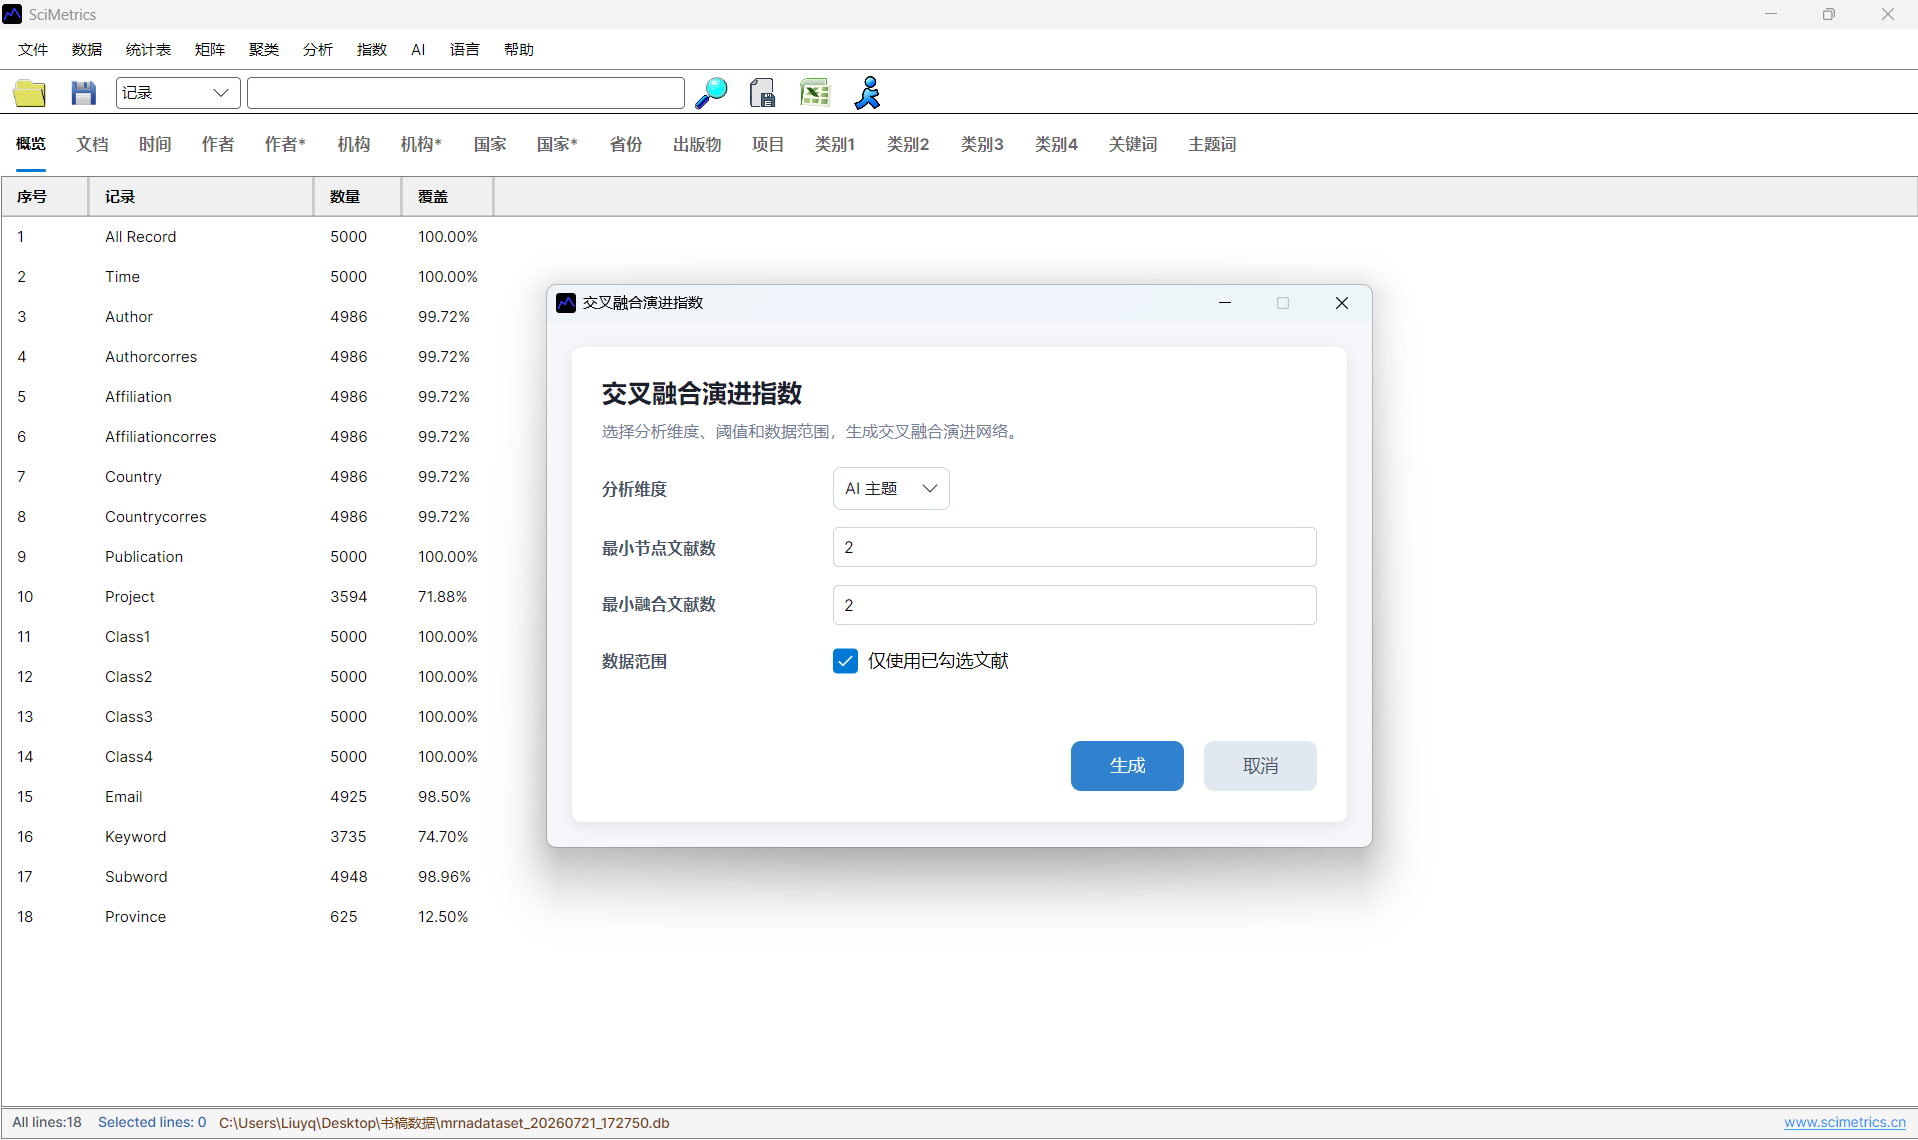
UI workflow
After opening the dataset, enter the subject cross-fusion or topic cross-fusion feature from the analysis and visualization area. A normal workflow is: open the dataset, select the analysis dimension, set thresholds, run the calculation, read the results, and export outputs.
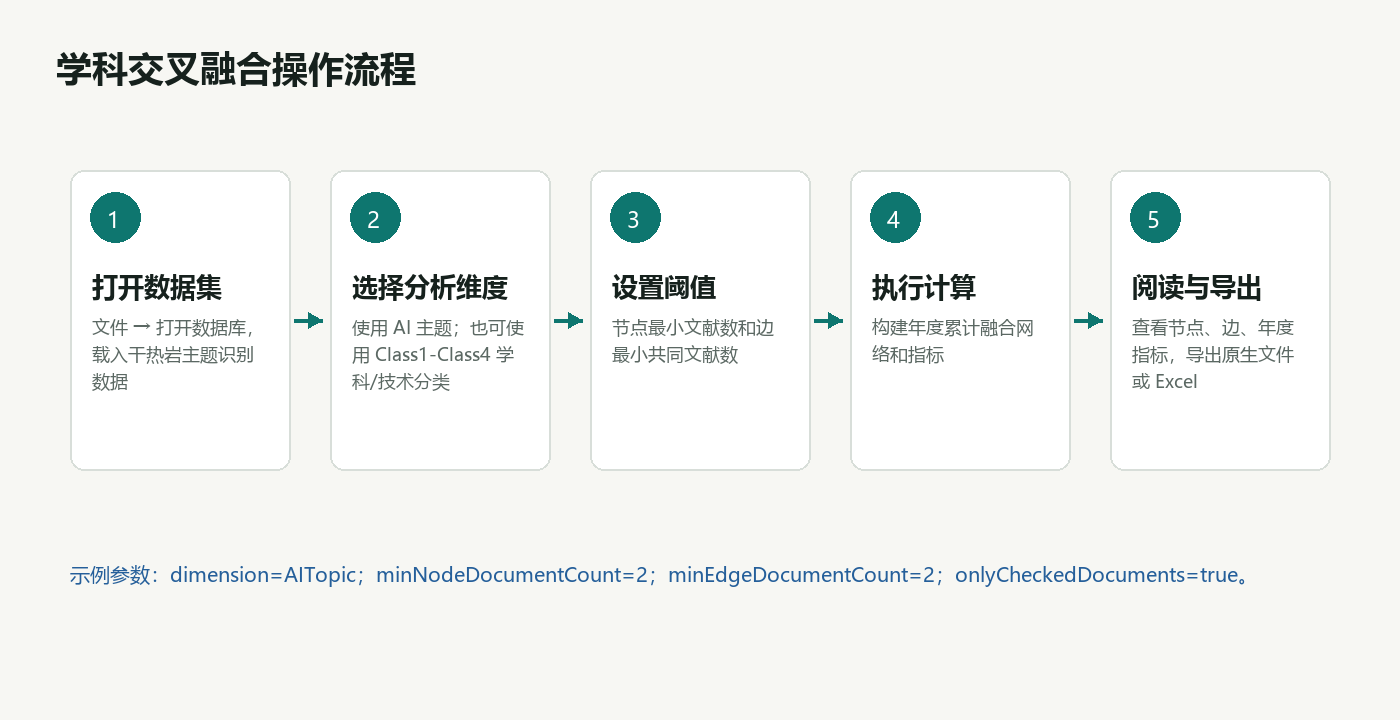
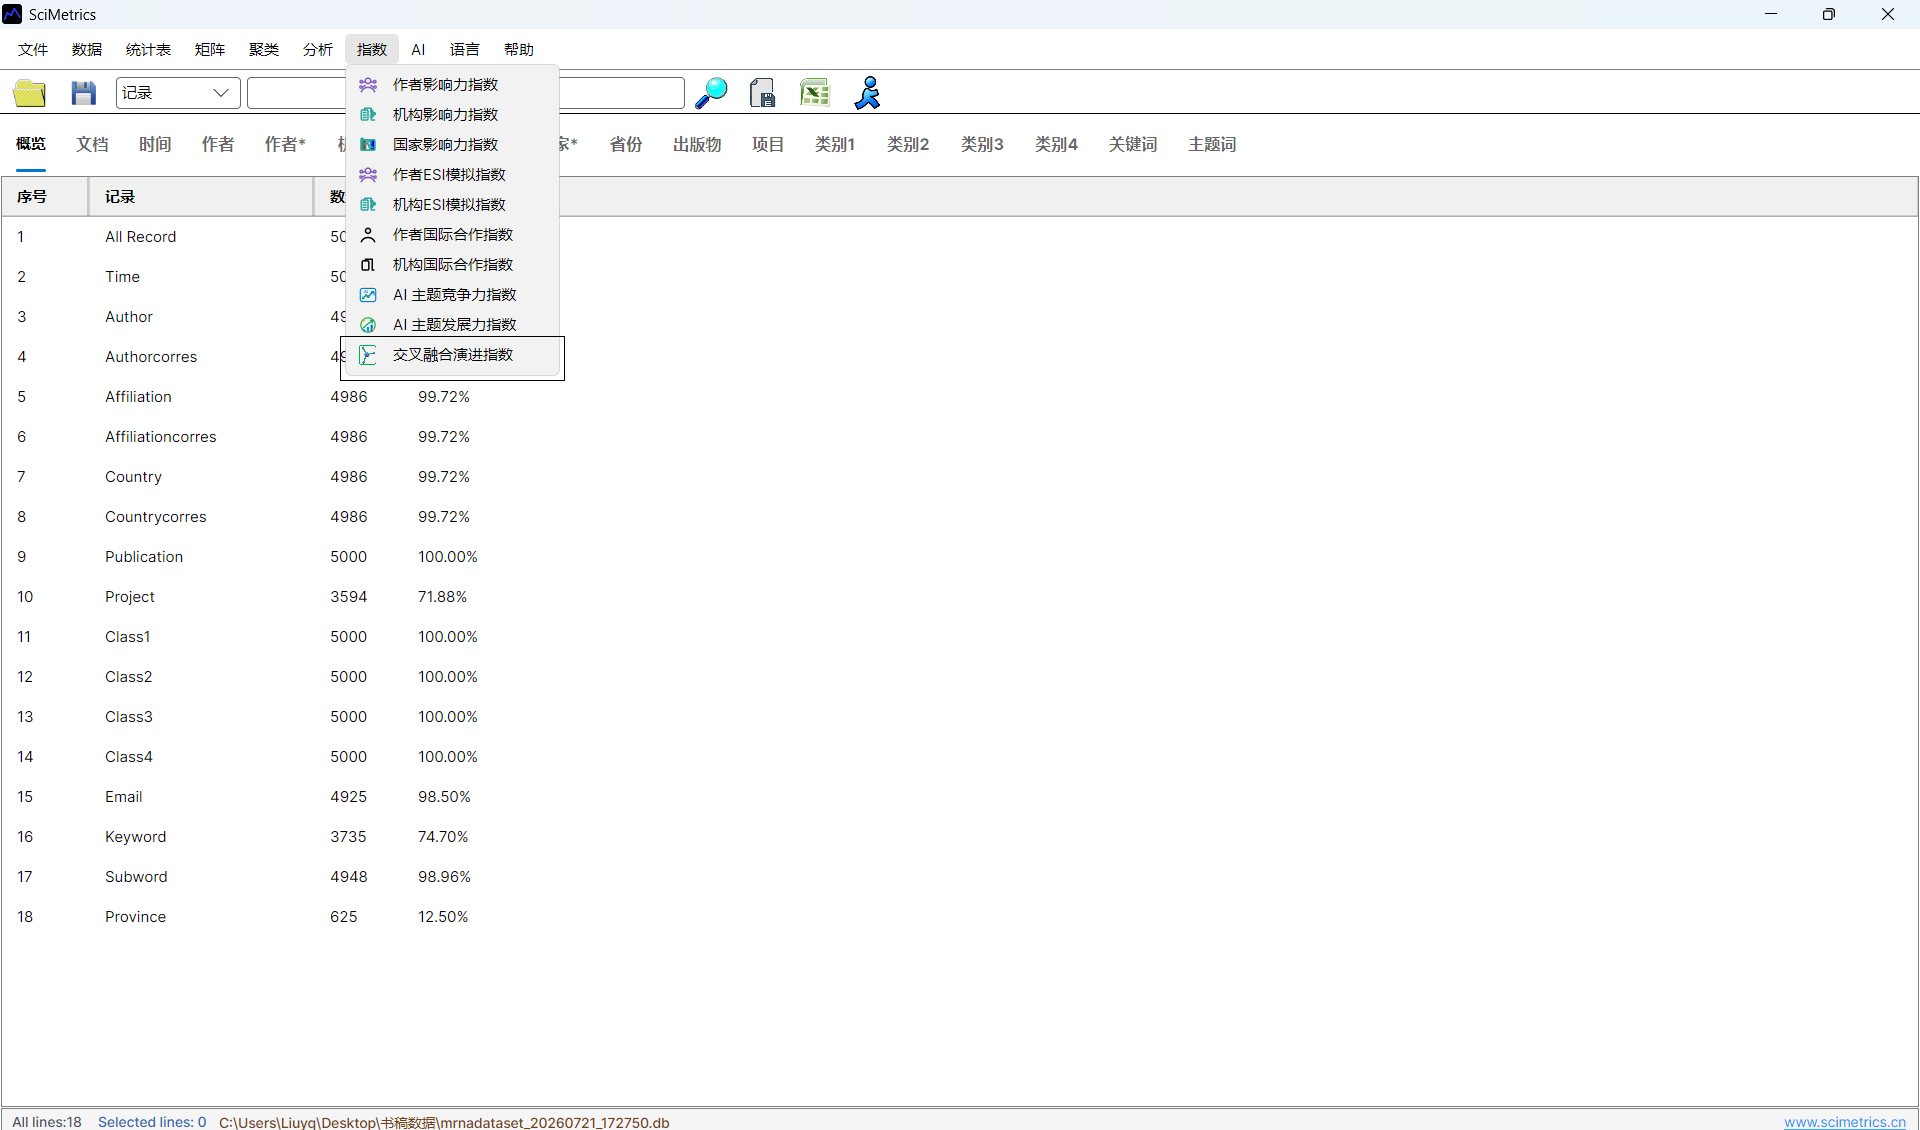
After calculation, SciMetrics builds a cumulative time window for each year: from the earliest year up to the selected year. Each yearly frame contains nodes, edges, fusion-document counts, network fusion breadth, and the cumulative fusion index. You can switch years to inspect whether relations are new, continuing, strengthened, weakened, or recovered.
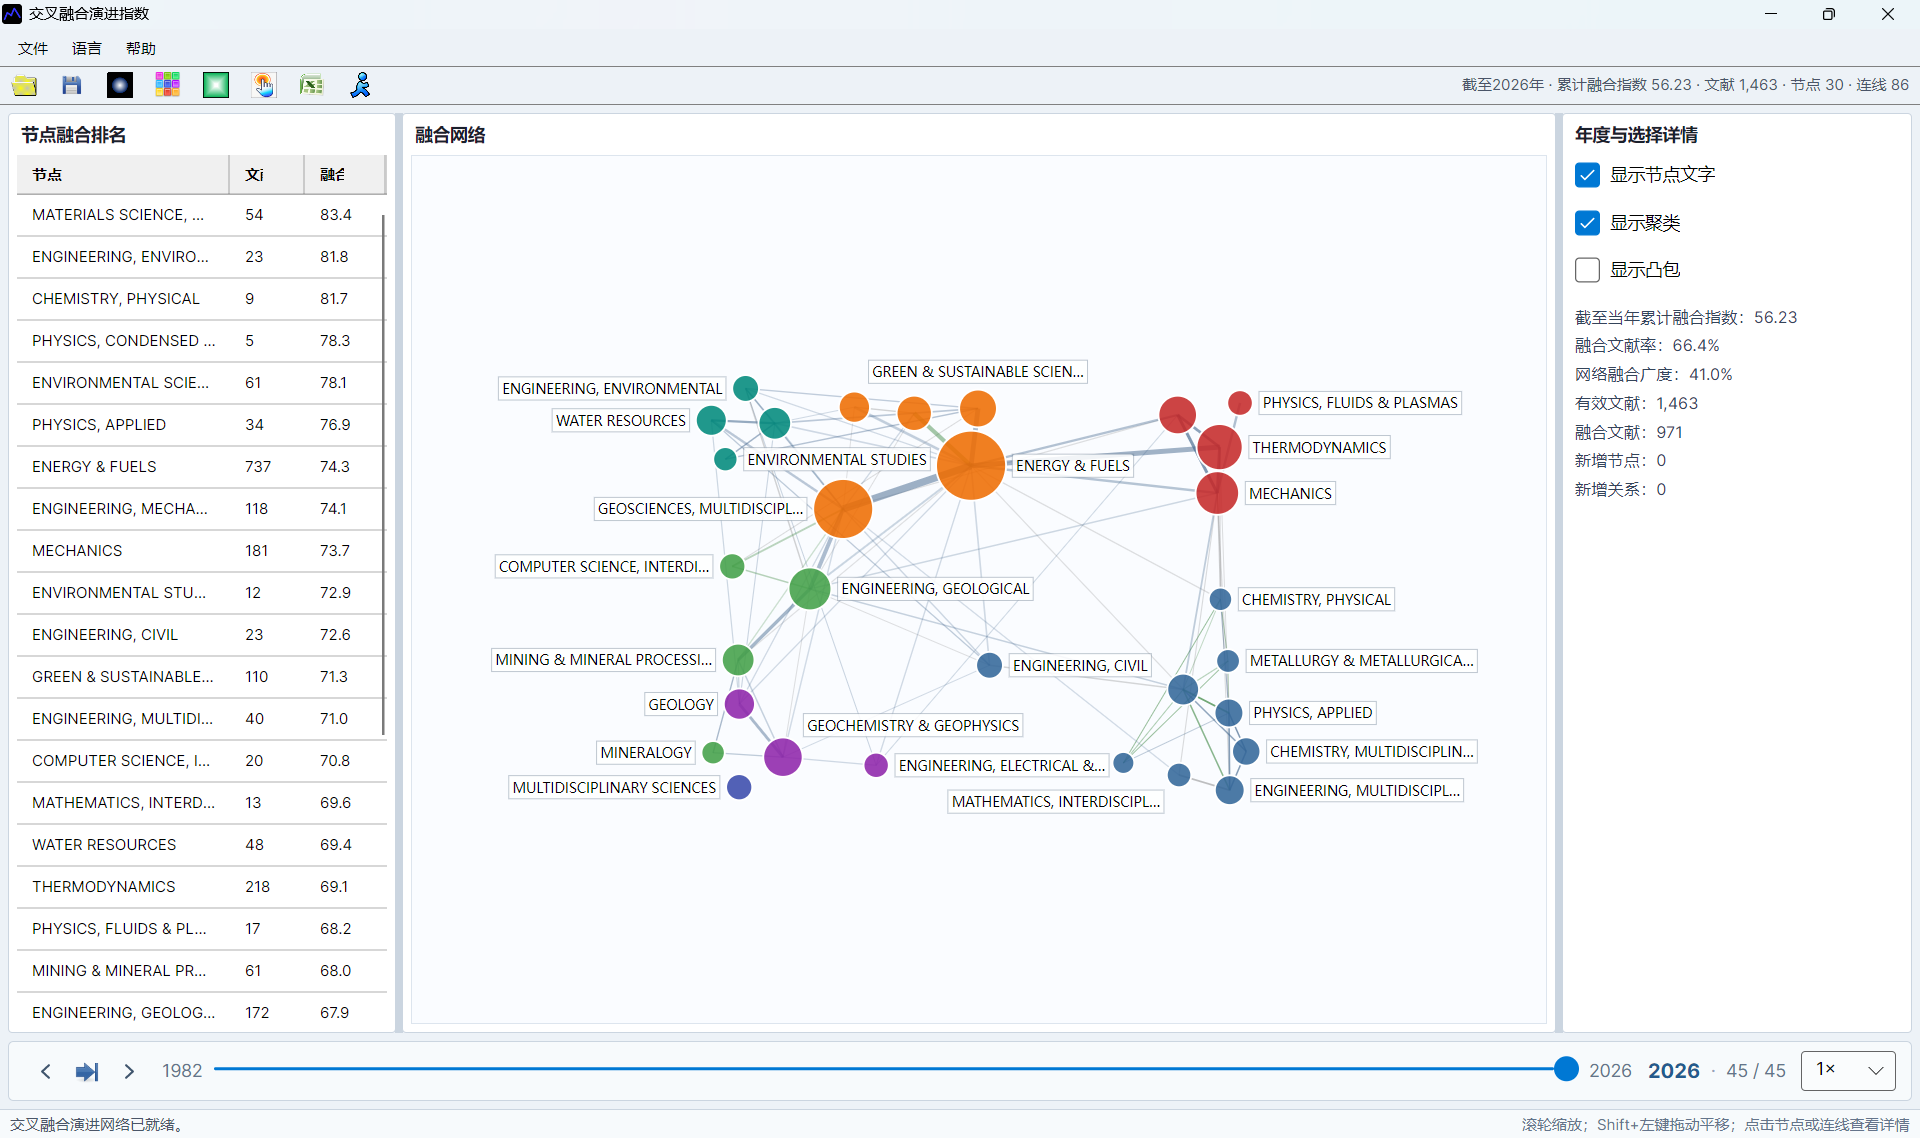
Parameters
| Parameter | Purpose | Example |
|---|---|---|
dimension |
Select Class1, Class2, Class3, Class4, or AITopic. |
AITopic |
minNodeDocumentCount |
Minimum documents required for a node. A higher threshold simplifies the graph but may filter detailed topics. | 2 |
minEdgeDocumentCount |
Minimum co-documents required for an edge between two topics. A higher threshold emphasizes more stable relations. | 2 |
onlyCheckedDocuments |
Whether to analyze checked documents only. | true |
onlyCheckedClassItems |
Whether to use checked class items only in Class1-Class4 mode. |
true |
year |
The year to display or export. If omitted, SciMetrics usually uses the latest year. | 2026 |
Thresholds control the granularity of the network. A low node threshold may introduce many accidental topics; a high threshold may hide detailed directions. A low edge threshold may create many weak links; a high threshold may retain only a few strong relations. Start with the default values, then adjust according to node count, edge count, and graph readability.
Read the yearly overview
The yearly overview is suitable for report summaries. It explains the sample size, fusion-document ratio, network size, and overall fusion level. The 2026 sample result is:
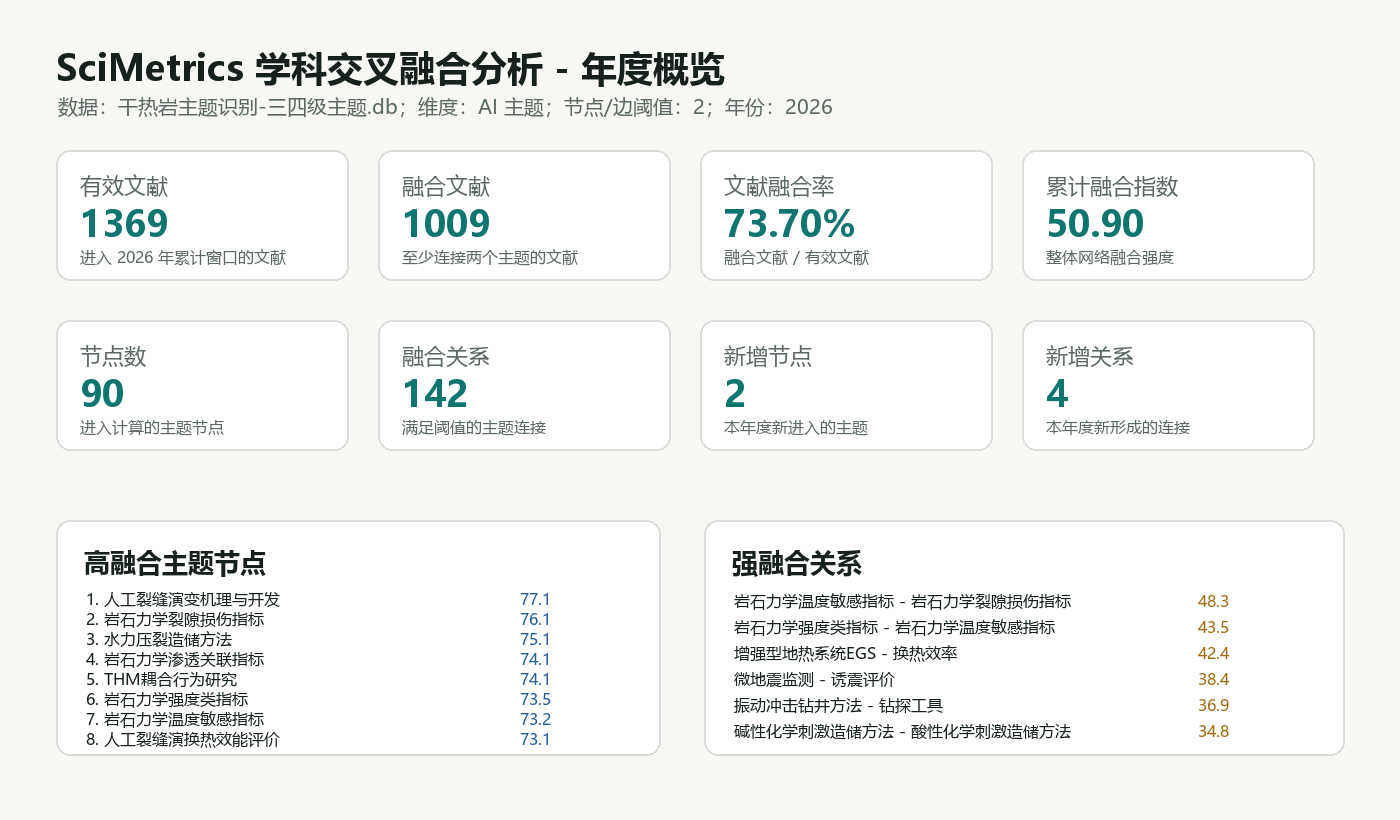
| Indicator | Sample value | How to read it |
|---|---|---|
| Valid documents | 1369 | Documents in the cumulative yearly window that participate in the analysis. |
| Fusion documents | 1009 | Documents connected to two or more topics. |
| Document fusion rate | 73.70% | Fusion documents divided by valid documents. |
| Network fusion breadth | 0.167 | How broadly fusion relations cover the network. |
| Cumulative fusion index | 50.90 | An overall indicator combining document fusion rate and network fusion breadth. |
| Nodes / edges | 90 / 142 | Topic nodes and threshold-satisfying fusion relations. |
A high document fusion rate means many documents are multi-topic. A high network fusion breadth means relations are not concentrated only among a few topics. A high cumulative fusion index indicates stronger overall fusion in the network.
Read the cross-fusion network
In the network, nodes represent topics, and edges represent two topics co-occurring in the same documents. Larger nodes usually indicate larger cumulative document volume. Thicker edges indicate a higher pairwise fusion index. Colors are commonly used to distinguish network clusters.
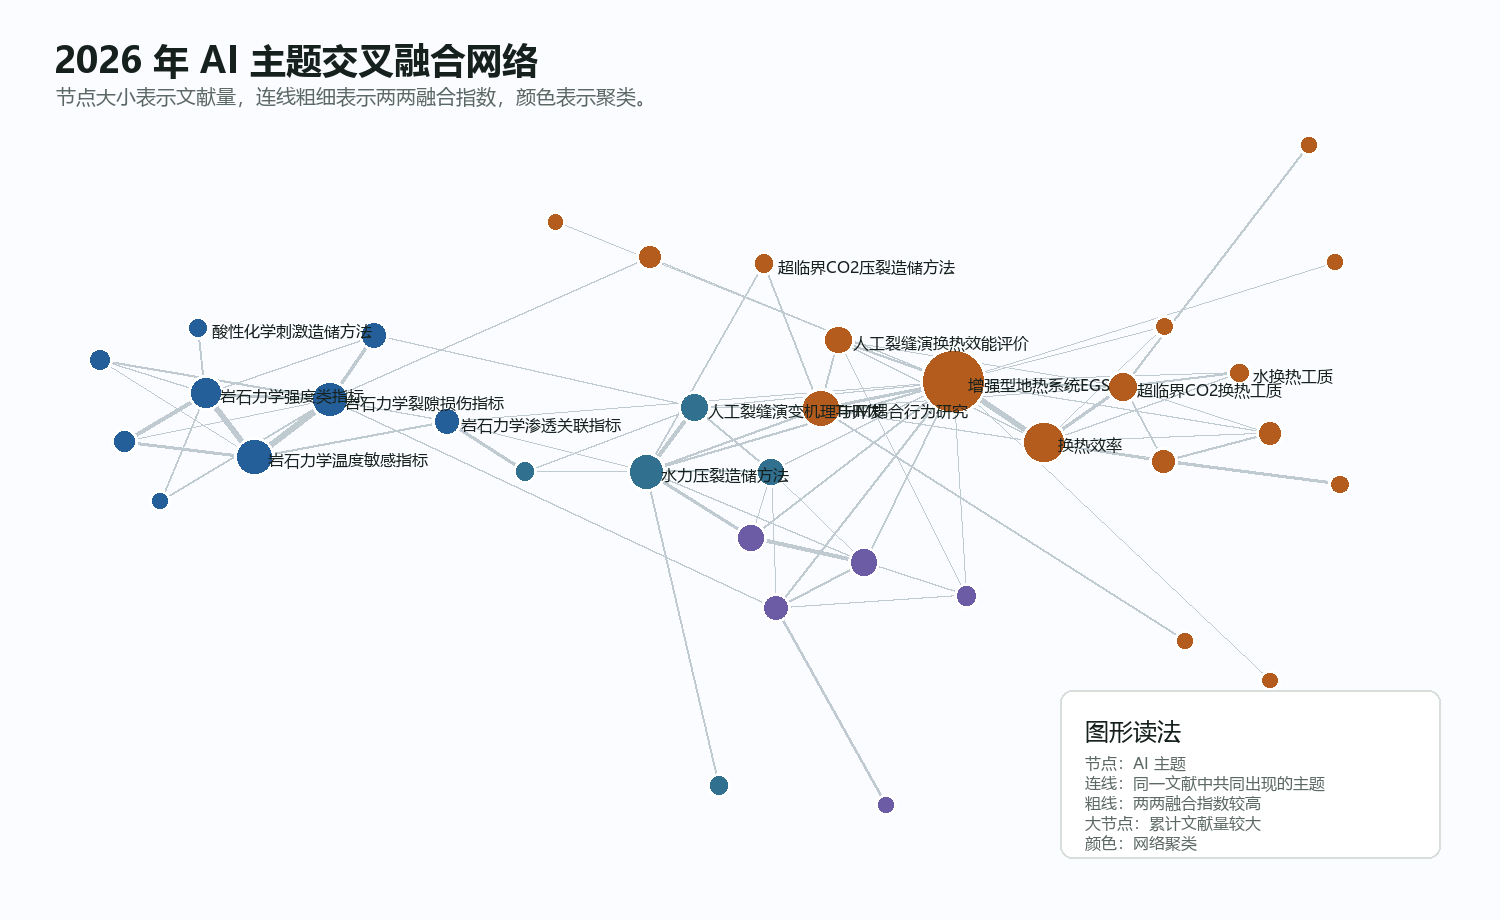
Recommended reading order:
- Start with large nodes to identify topics with a strong literature base.
- Inspect thick edges to find stronger topic combinations.
- Check new or strengthened relations to locate recent cross-fusion clues.
- Return to evidence documents to verify whether the relation reflects real problem, method, technology, or application fusion.
Read node fusion index
The node fusion index measures how strongly a topic participates in cross-fusion. It considers how many documents in the topic are fusion documents and how many effective neighbors the topic connects to. Topics with high scores are good candidates for deeper review.
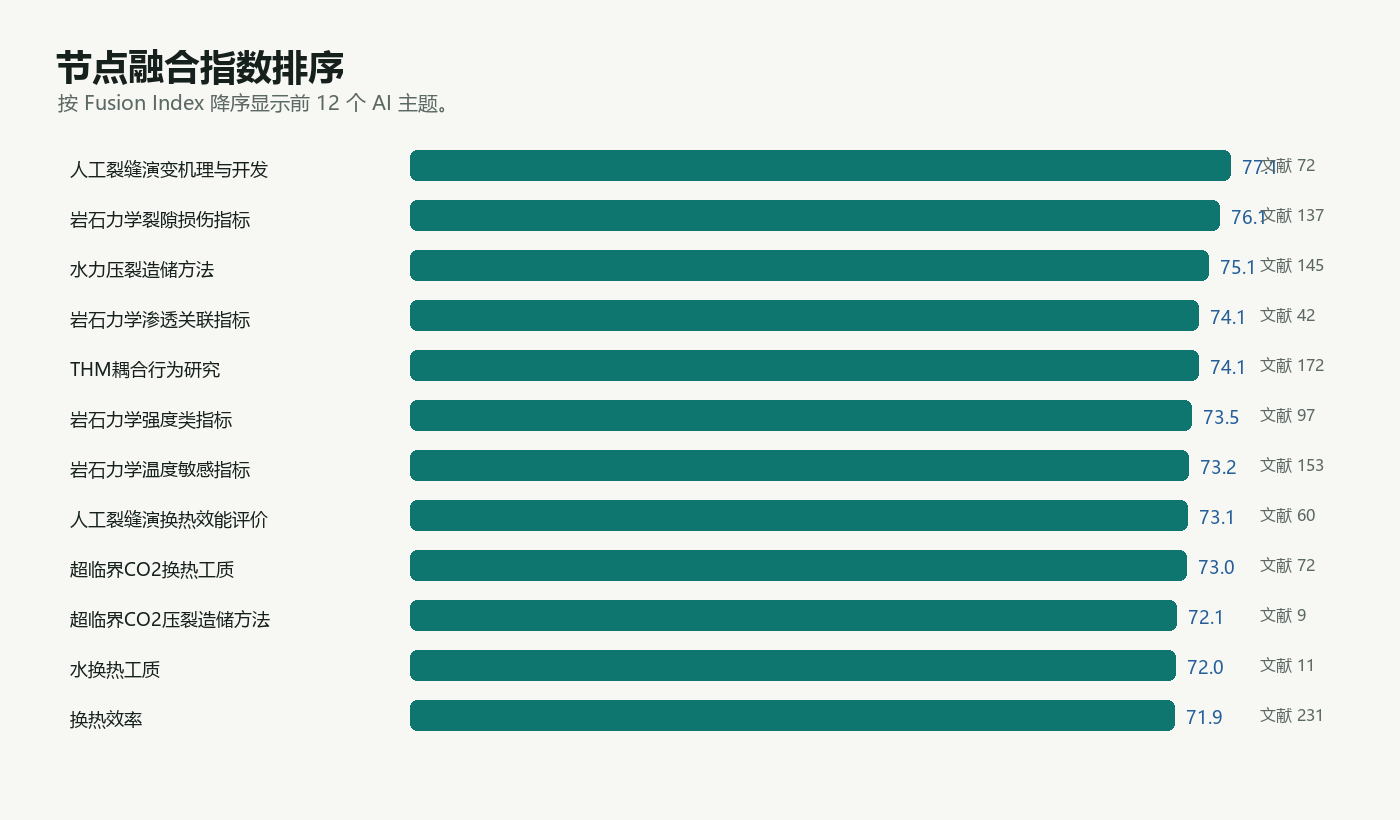
In the sample result, high-fusion topics include artificial fracture evolution mechanisms and development, rock-mechanics fracture damage indicators, hydraulic-fracturing reservoir stimulation methods, rock-mechanics permeability-correlation indicators, THM coupled behavior, rock-mechanics strength indicators, and rock-mechanics temperature-sensitivity indicators. Reports should not list the score only; they should explain which topics are connected and why the node may work as a cross-fusion hub.
Read fusion relations
The fusion-relations table shows co-document counts, fractional weights, normalized strength, pairwise fusion index, and relation status between two topics. Status values include new, continuing, strengthened, weakened, and recovered.
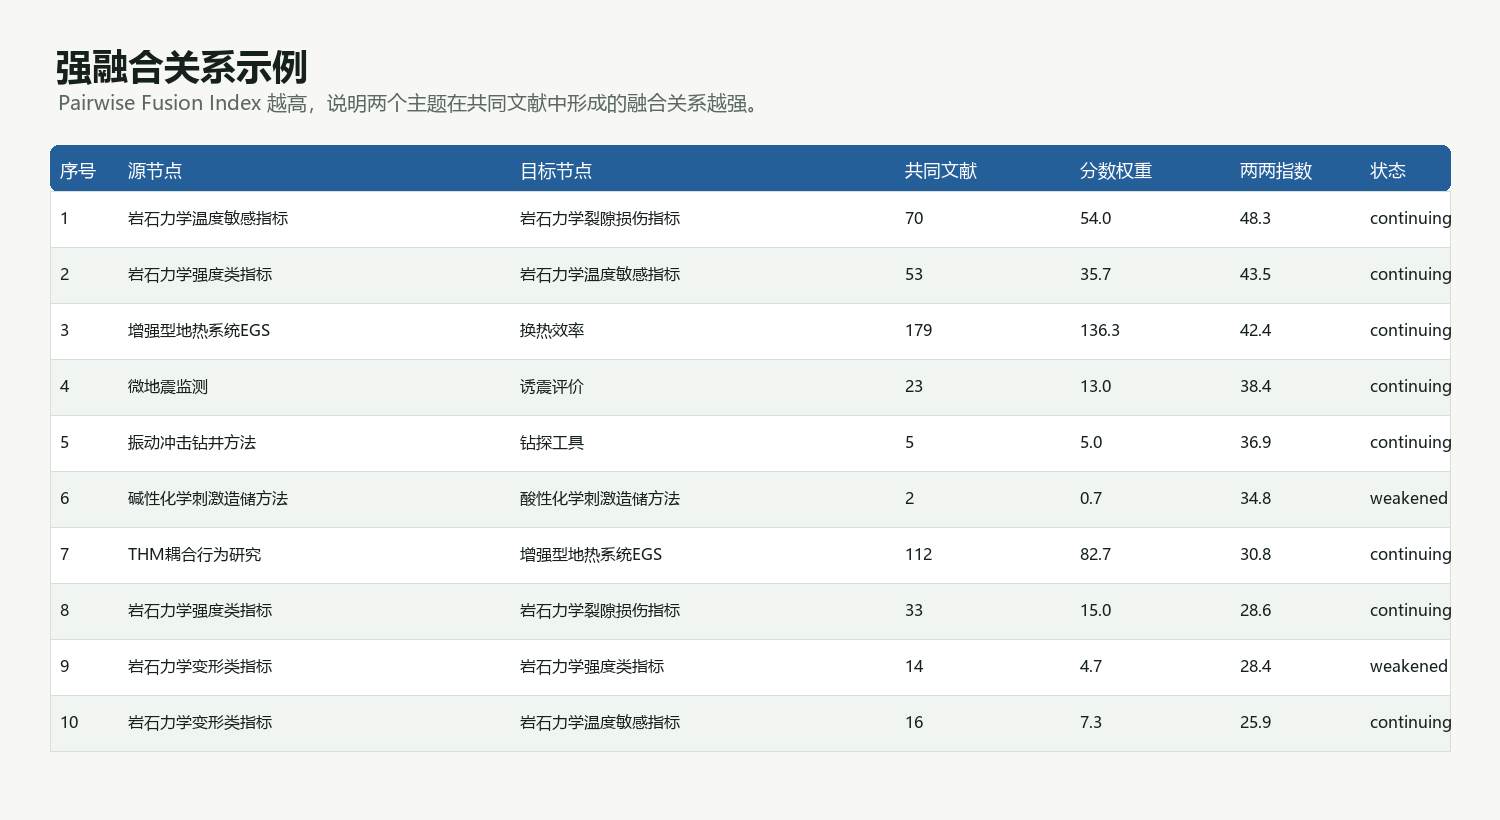
| Status | Meaning | Reporting use |
|---|---|---|
| New | The relation appears for the first time in the selected year. | Use it as a recent cross-fusion clue, then verify whether the document base is sufficient. |
| Continuing | The relation exists across adjacent years. | Use it as a relatively stable cross-fusion foundation. |
| Strengthened | The relation is stronger than in the previous year. | Indicates that the topic connection may be intensifying. |
| Weakened | The relation is weaker than in the previous year. | May indicate lower recent attention or insufficient new documents. |
| Recovered | The relation appeared historically, disappeared, and appears again. | Use it as a reactivated fusion clue. |
Review evidence documents
Every cross-fusion conclusion should return to evidence documents. A strong relation does not automatically mean real interdisciplinary fusion; it may be a surface connection caused by label co-occurrence or classification practice. Open the Evidence Documents worksheet and review source node, target node, document ID, title, year, and all labels.
During review, check whether:
- The co-documents' titles and abstracts truly involve both topics.
- The fusion happens at the problem, method, technology, data, or application level.
- PMRC results, keywords, authors, institutions, or full texts are needed for verification.
- The report explains which papers support the relation and what research logic connects them.
Save, open, and export
Cross-fusion results can be saved as a native .crossfusion file and exported as Excel. For formal reporting, save both the native file and Excel output so the graph can be reproduced and the tables can be reviewed later.
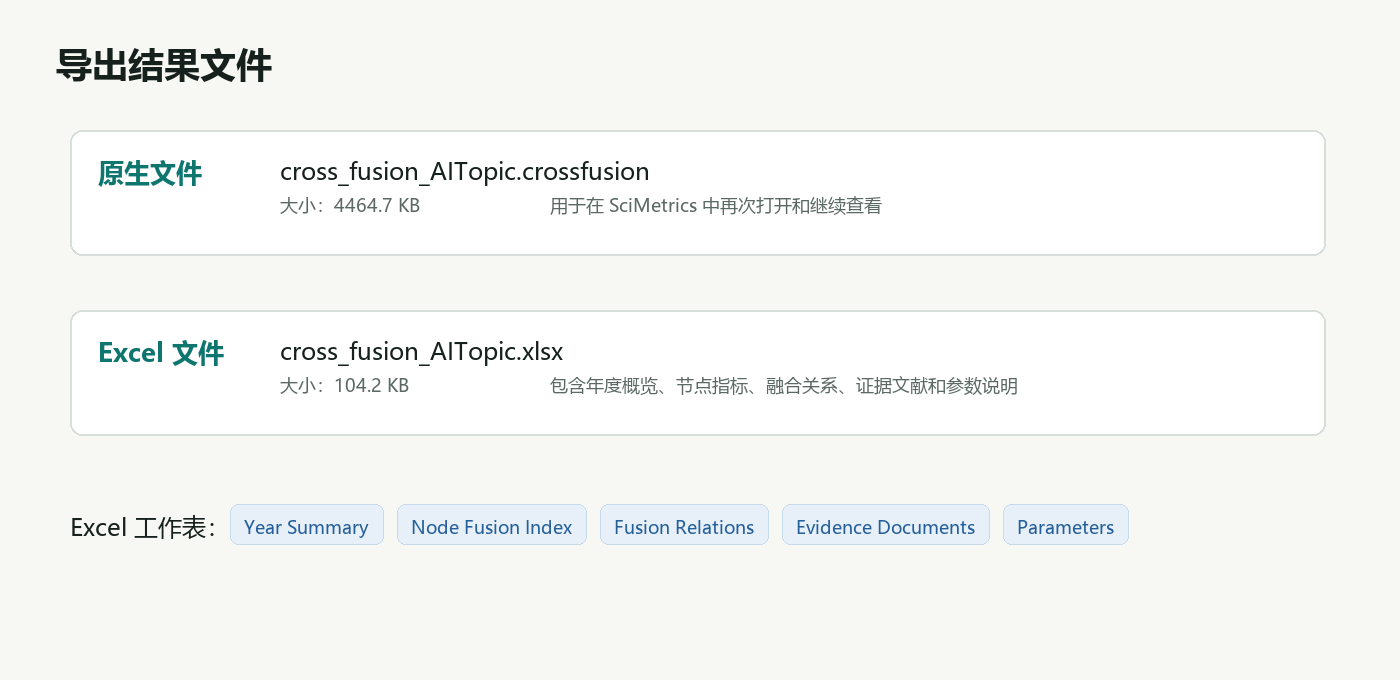
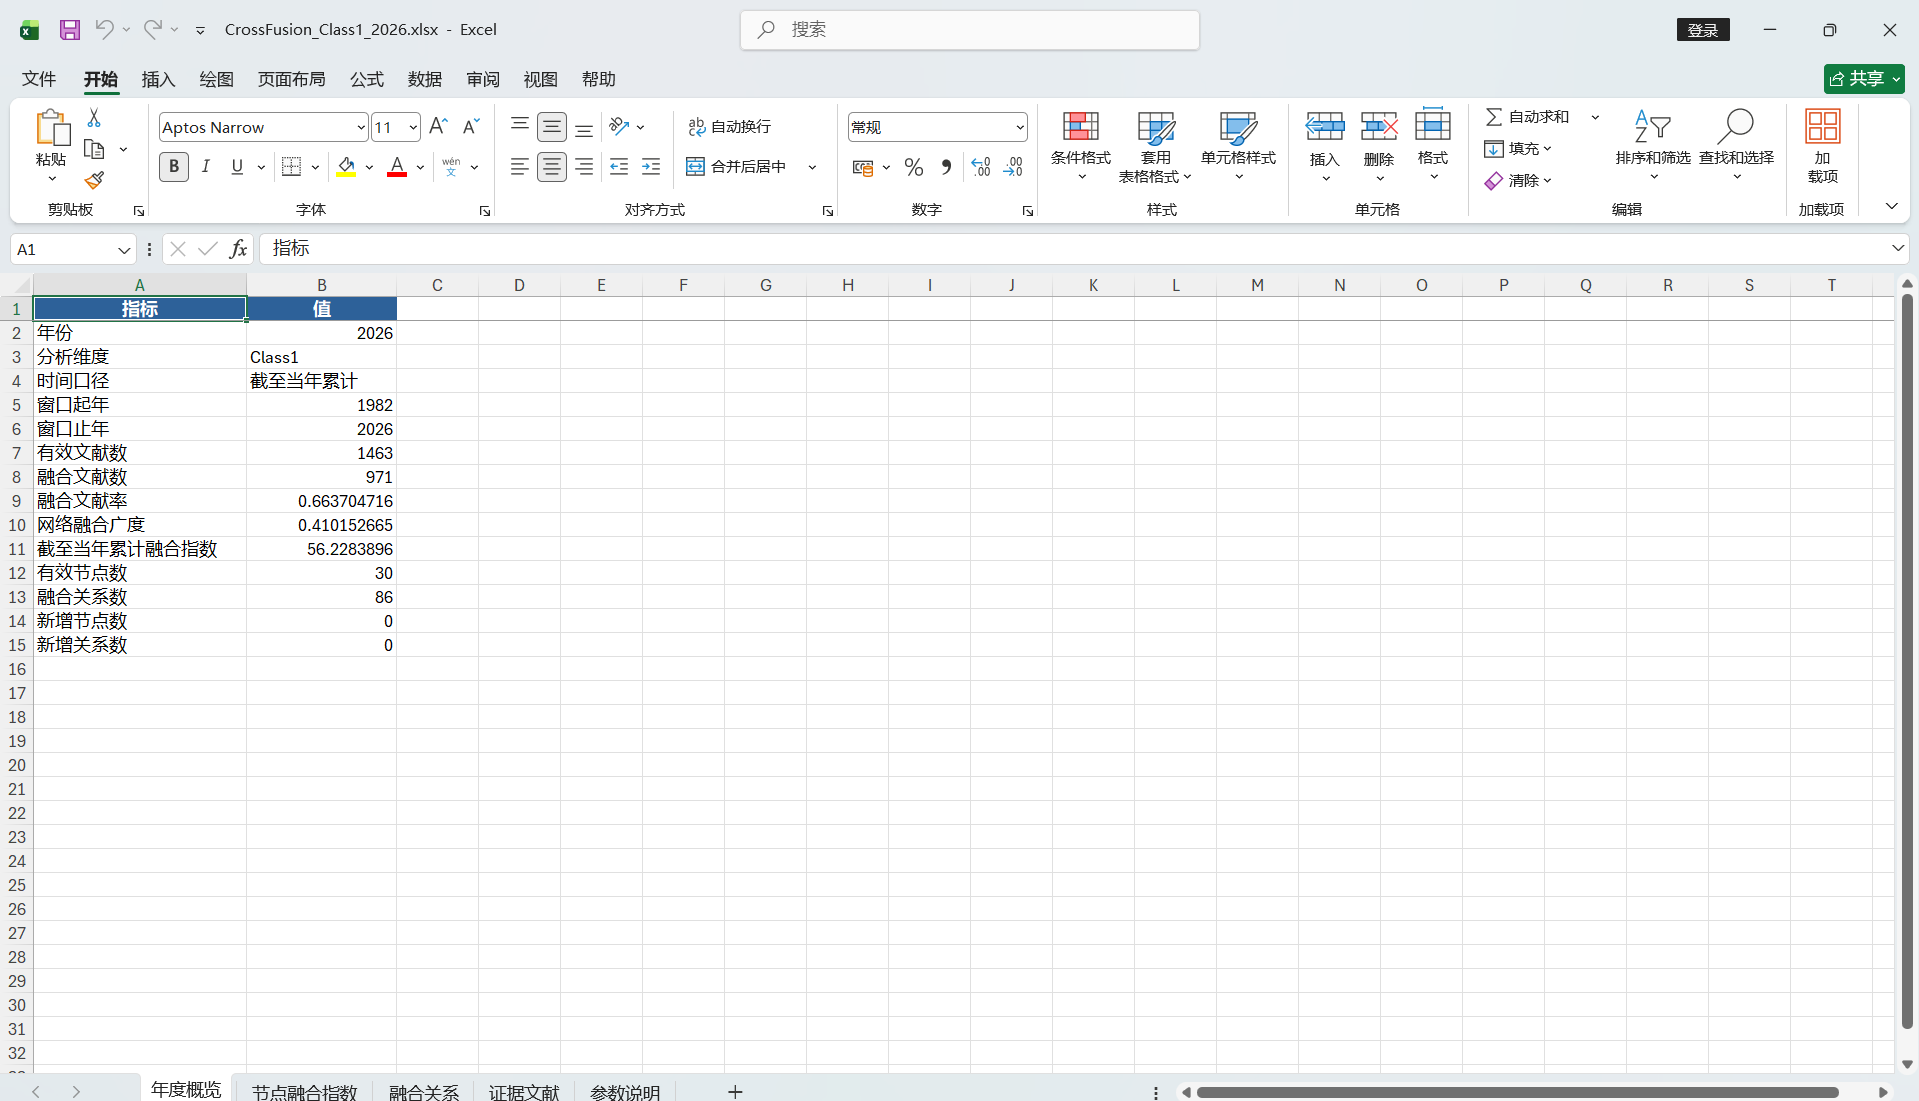
| Format | Content | Use case |
|---|---|---|
.crossfusion |
Full timeline, options, fixed layout, yearly nodes/edges, and evidence documents. | Reopen later, switch years, or export again. |
.xlsx |
Selected-year summary, node metrics, fusion relations, evidence documents, and parameters. | Review, statistics, reporting, and secondary analysis. |
.svg |
Vector image based on the current Desktop year and display settings. | Papers, briefings, and report layout. |
Desktop supports the interactive window and SVG export. Headless supports the same calculation, native files, Excel, state inspection, and year selection, but does not create a window. An SVG request in Headless returns an explicit instruction to use Desktop instead of reporting a false success.
Use results in a subject service report
Cross-fusion results are suitable for subject service reports, college development analysis, interdisciplinary platform planning, and major project planning. A useful reporting order is:
- State the data source, time range, checked scope, and analysis dimension.
- Report yearly overview indicators and explain the overall fusion level.
- List high-fusion topic nodes and explain their connected topics and possible roles.
- List strong fusion relations and explain their status and co-document evidence.
- Provide service recommendations, distinguishing observation clues, collaboration opportunities, and directions for focused cultivation.
In the sample dataset, hot dry rock research shows a high document fusion rate under the AI-topic dimension. This suggests that many papers connect multiple topics. A report can focus on fusion among rock-mechanics indicators, hydraulic-fracturing reservoir stimulation, THM coupled behavior, heat-exchange efficiency, and enhanced geothermal systems.
How to ask an AI assistant without knowing an API
Daily use does not require command names. State the dimension, thresholds, data scope, year, and desired output. If a choice is unclear, ask the assistant to inspect the data before recommending it.
Actually use the scim MCP and first check whether the current dataset supports cross-fusion.
Calculate cross-fusion by AI topic with at least 2 documents per node and 2 co-documents per edge, using checked documents only.
Open the interactive window at the latest year and explain the document fusion rate, network fusion breadth, and cumulative fusion index.
Read the window state again after execution to verify the result.
For a classification dimension:
Use SciMetrics MCP to calculate cross-fusion by Class2.
Use only checked documents and checked classification items, with node threshold 3 and edge threshold 2.
Save the complete result to D:\Research\output\class2.crossfusion and export the 2024 table to D:\Research\output\class2-2024.xlsx.
Verify both files afterward.
If you are not sure which classification level to use:
First inspect whether Class1-Class4 and AI topics are available for cross-fusion in the current dataset. Do not run immediately.
Recommend one dimension based on data coverage, and explain what happens if the node or edge threshold is too high or too low.
MCP and Automation API
MCP discovers these commands from the running SciMetrics host, so it does not duplicate the cross-fusion algorithm:
| Capability | Automation command | Purpose |
|---|---|---|
| Calculate | analysis.cross_fusion |
Calculate from the active dataset; optionally open the window or write .crossfusion, Excel, and SVG outputs. |
| Open | visual.open_cross_fusion |
Open or load a saved .crossfusion file. |
| Inspect | visual.get_cross_fusion_state |
Return options, years, current metrics, top nodes/edges, and display state. |
| Control | visual.set_cross_fusion_options |
Change year, labels, clusters, hulls, background, playback speed, or timeline action. |
| Export | visual.export_cross_fusion |
Export the current analysis as native, selected-year Excel, or SVG. |
System integrations can POST to the local Desktop endpoint http://127.0.0.1:37618/api/automation/command:
{
  "command": "analysis.cross_fusion",
  "arguments": {
    "dimension": "AITopic",
    "minNodeDocumentCount": 2,
    "minEdgeDocumentCount": 2,
    "onlyCheckedDocuments": true,
    "year": 2026,
    "openWindow": true,
    "nativePath": "D:\\Research\\output\\ai-topic.crossfusion",
    "excelPath": "D:\\Research\\output\\ai-topic-2026.xlsx",
    "language": "en-US"
  }
}
To control the current window before export, call:
{
  "command": "visual.set_cross_fusion_options",
  "arguments": {
    "year": 2022,
    "showLabels": true,
    "showClusters": true,
    "showClusterHulls": true,
    "backgroundColor": "#FFFFFF"
  }
}
Then call visual.export_cross_fusion with path, optional format, and optional year. The Headless endpoint defaults to http://127.0.0.1:37619/api/automation/command.
FAQ
Why are there no fusion edges?
Possible causes include documents having only one label, an edge threshold that is too high, or no shared topics/classifications in the data. Lower the edge threshold or check whether labels were written correctly.
Does a high fusion index always mean the direction is worth strategic investment?
No. The index is only an entry point. Formal service recommendations should also consider representative papers, team capacity, college needs, and expert judgment.
How can I avoid surface-level cross-fusion?
Return to evidence documents and judge whether the co-documents truly show shared problems, method transfer, technical diffusion, or application-scenario fusion.
How should I use the exported Excel file?
Use the yearly overview for report summaries, the node table for topic ranking, the relations table for identifying topic combinations, and the evidence-document table for source review.
Export and Report
Export tables, images, and report materials for papers, projects, subject services, or briefings.
Export and Report
Export tables, images, and report materials for papers, projects, subject services, or management briefings.
Delivery workflow
- Export key tables with filtering conditions and statistical definitions.
- Export high-resolution or vector graphics and check fonts, colors, and legends.
- Organize findings by question, evidence, conclusion, and recommendation.
- Archive project files and exported files for later review.
Before reporting
- Data sources, time range, and filters are clearly described.
- Chart conclusions can be traced back to the source data.
- Terms, organization abbreviations, and topic labels are consistent.
- AI-assisted text has been reviewed by a domain expert.
FAQ
Troubleshoot import, sign-in, AI, and export issues in a predictable order.
FAQ
When import, sign-in, AI, or export issues occur, troubleshoot them in this order.
Troubleshooting order
- Confirm software version, account permissions, and network status.
- Check whether the data file is open elsewhere or has encoding or format issues.
- Use logs or error messages to locate the failure stage: import, analysis, AI, or export.
- Submit screenshots, version number, and reproduction steps through the guestbook or support channel.
Common problems
| Problem | First check |
|---|---|
| Cannot sign in | Account status, network, license validity. |
| Import result is incomplete | File format, encoding, field mapping, selected filter. |
| AI call fails | Model endpoint, key, quota, network, and prompt length. |
| Export image is unclear | Export resolution, vector option, font and label size. |